Trade idea - GBPCHF Short4H
Corrective approach towards entry zone.
-27 Fibonacci completion aligning with entry zone.
= Sell limit set.
1% risk.
Fxtrading

Trade idea - EURUSD Long4H
Corrective approach towards entry zone.
-68 Fibonacci completion aligning with entry zone.
Bullish M pattern, Bullish Fake Out flag as extra evidence.
= Instant market execution Buy.
1% risk.

Trade idea - NZDCAD Long4H
4H Inverse Head & Shoulders pattern aligning perfectly with the Daily one.
Corrective approach towards entry zone.
-68 Fibonacci completion aligning with entry zone.
= Buy limit set.
1% risk.

AUDCAD Sell/ShortAUDCAD looks like a good signal from here that has bounced off resistance, came back a bit, and seems to not be a strong higher low for AUDCAD. Our analysts and myself am calling a sell short here due to the fact this pair has repeated multiple patterns in the same way in the last few months and as well it has the best risk/reward ratio I have seen so worth the bet to make. Please follow the entry, SL, and TP. Please make sure to follow our page for more daily signals!

USDCAD: Detailed Support & Resistance Analysis 🇺🇸🇨🇦
Here is my latest structure analysis for USDCAD.
Vertical Structures:
Vertical Support 1: Rising trend line
Horizontal Structures:
Support 1: 1.3664 - 1.3682 area
Support 2: 1.3590 - 1.3627 area
Support 3: 1.3547 - 1.3570 area
Support 4: 1.3420 - 1.34920 area
Resistance 1: 1.3777 - 1.3804 area
Resistance 2: 1.3828 - 1.3846 area
Consider these structures for pullback/breakout trading.
❤️Please, support my work with like, thank you!❤️

EURUSD - Key Area. Will the rally fail?OANDA:EURUSD Completed a small Gartley pattern on Friday, now we look for a rally to see if it's going to fail around the 1.0853-1.0880 area.
There are bigger TF patterns that take it a lot lower with the first one down below 1.0600 and larger pattern below 1.0300.
A move above 1.0950 could send it towards 1.1100 and even 1.1300.
That's why this week is so critical to where we head next.
I will post the weekly AI to see if we can find a CIT Window.
Enjoy the week.

EURJPY - Correction over, Back to highs?OANDA:EURJPY Looks to have completed the correction and if we break above 170.00 again then upside targets are around 172.00. Looking for PBs to get long.
Ideal scenario is if we get a move back to 169.00 but watching for a top in this run.
Enjoy the day.

EURUSD Long/BuyEURUSD looks like it can go long from here, last two supports have respected the trend and as well the fact being that EURUSD looks like its third wave back up for a retrace after a heavy drop. I have placed the entry, TP, and SL for the trade. Please message me or let me know any questions you may have in regard to this trade or in general about us and our page! Please make sure to follow our page for more daily signals!

Trade idea - AUDCAD Long4H
Corrective approach towards entry zone.
Market approaching in Bull Flag formation towards entry zone.
-68 Fibonacci level aligning with entry zone.
= Buy limit set.
1% risk.

GBPJPY Sell/ShortGBPJPY looks like it is in a phase of bearish return in a downtrend channel pattern. We are currently looking to short on the market due to the rejection at level of 200.700 and we will be looking to see a drop of at minimum 200-400 pips before touching the main support trend line. I have my profits set there, however, please feel free to take any profits you wish ahead of time. Thank you and please be sure to follow our page!

EURAUD SELL TP HITEURAUD SELL analysis got 80 pips TP
The perfect 🥰 1:2 RR always 😍
Money management always 🤴

EURUSDGood morning, after yesterday's clearance of the main high-liquidity zone, we got a reaction and shifted the structural context to bullish. This morning, I was looking for positions with targets at the PDH, but unfortunately, there was no suitable setup. In two hours, we have the Inflation Rate news, so I am stepping away from the chart to let the price move as it wants. I wish you the best in staying out of the market as well.

GBPAUD Sell/ShortLooking at a new rejection that seems to have been struggling to break past 1.93100 I can confirm to say this seems like a bearish downtrend that is occurring. I will take my entry now at 1.93072 with all inputs for TP and SL below. Please use proper risk management as always.
GBPAUD Sell/Short
ENTRY: 1.93072
TAKE PROFIT:
TP 1: 1.89317
TP 2: 1.86379
SL: 1.94623
Please use proper risk management upon entering this trade.

USD/CAD looks set to break higherPrice action may be choppy on the daily timeframe, but it remains in an uptrend none the less. Price action since the April high appears to be corrective, and support was found around a prior VAH (value area high) and 1.36 handle.
The 1-hour chart shows strong bullish momentum from 1.36, and prices are now consolidating within a potential bull flag. The pattern projects an upside target around 1.3745, and the lows of the consolidation are holding above the weekly/monthly pivot and 10-day EMA.
The bias is for prices to rise to at least 1.37 near the weekly R1 pivot and 1-day implied volatility band.

CADJPY: One More Bullish Yen Pair 🇨🇦🇯🇵
CADJPY looks very strong, after a test of a key support.
The price formed a double bottom pattern and broke its neckline.
With a high probability, the market will reach 115.0 level soon.
❤️Please, support my work with like, thank you!❤️

Currencies Chart & DXYCurrencies Chart & DXY ..........................................................................122131
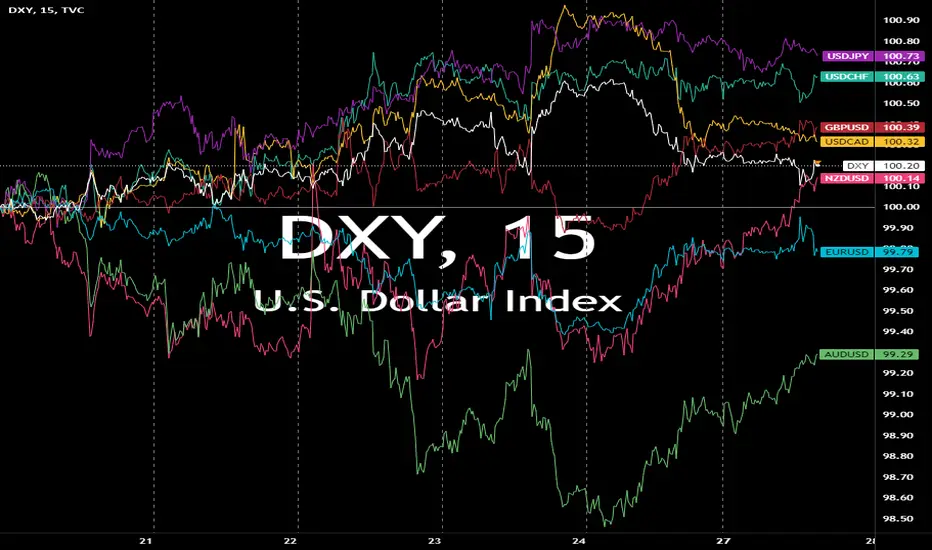
Currencies Chart & DXYCurrencies Chart & DXY ..........................................................................122131

[EDU-Bite Sized Mini Series]All you need for Order types in FX Hello fellow traders , my regular and new friends!
Welcome and thanks for dropping by my post.
Understanding the various order types in forex trading is essential for navigating the market efficiently and executing trades effectively. Here's a concise overview of some common order types:
1. Market Order:
This order is executed immediately at the current market price. It is used when a trader wants to enter or exit a trade quickly.
More of for Day Trading - A trader might use market orders to quickly enter and exit positions based on real-time news events or technical signals.
Live example
> A trader sees a positive European's news release and expects a quick upward move in the EUR/USD pair. They use a market order to buy EUR/USD at the current price of 1.1950, aiming to sell it later in the day at a higher price based on the expected market reaction.
2. Limit Order:
A limit order allows traders to specify the price at which they want to enter or exit a trade. It's used to buy below the current market price or sell above it, ensuring entry or exit at a specific price level or better.
For example for Swing Trading - A trader might place a buy limit order at a support level, expecting the price to bounce back up, or a sell limit order at a resistance level, expecting the price to fall.
Live Example
> A trader identifies strong support for USD/JPY at 110.50 and places a buy limit order at this price, expecting the price to rebound. When the market price dips to 110.50, the order is executed, and the trader aims to sell at 111.50.
3. Stop Order(Stop-Loss Order):
A stop order becomes a market order once a specified price level is reached. It's commonly used to limit losses or protect profits by triggering a trade when the market moves in a certain direction.
This, in my opinion should be used as Risk Management for all traders - A trader sets a stop-loss order below the entry price for a long position or above the entry price for a short position to limit potential losses if the market moves against their position.
Live Example
> A trader buys GBP/USD at 1.3500, anticipating a rise. To protect against unexpected drops, they place a stop-loss order at 1.3450. If the price falls to 1.3450, the order executes, limiting the trader's loss to 50 pips.
4. Stop-Limit Order:
A stop-limit order combines features of both stop and limit orders. It triggers a limit order to buy or sell at a specified price once the stop price is reached, offering more control over entry and exit prices.
More of for Advanced Trading - A trader might use a stop-limit order to ensure they enter a position only if the price reaches a certain level but still want to control the maximum price they are willing to pay.
Live Example:
A trader wants to buy EUR/GBP only if it breaks above 0.8500 but not pay more than 0.8520. They place a stop-limit order with a stop price of 0.8500 and a limit price of 0.8520. If the price hits 0.8500, the order becomes a limit order, executing only if the price is 0.8520 or lower.
5. Trailing Stop Order: A trailing stop order is a dynamic stop-loss order that adjusts automatically as the market price moves in the trader's favor. It helps lock in profits while allowing for potential further gains.
For Trend Following - A trader might use a trailing stop order to lock in profits as the price moves in their favor, allowing the stop price to trail the market price and protect gains if the market reverses.
A trader buys USD/CAD at 1.3000 and sets a trailing stop order with a 50-pip trail. As the price rises to 1.3100, the trailing stop adjusts to 1.3050. If the price then falls to 1.3050, the order executes, locking in a 50-pip profit.
Hopefully these explanations on the various Trading Orders open you up to more strategies that you can applied in the market for you to trade more efficiently and profitably!
Do check out my recorded video (in trading ideas) for the week to have more explanation in place.
Do Like and Boost if you have learnt something and enjoyed the content, thank you!
-- Get the right tools and an experienced Guide, you WILL navigate your way out of this "Dangerous Jungle"! --
*********************************************************************
Disclaimers:
The analysis shared through this channel are purely for educational and entertainment purposes only. They are by no means professional advice for individual/s to enter trades for investment or trading purposes.
*********************************************************************

EURUSDEURUSD
Good morning. At the opening of the London session, the context shifted to long, with local problem areas below being cleared. The intraday target is PDH.

EURUSDGood morning, the local context currently looks bullish. We have two confirmations of market structure. Below, there is a liquidity cluster, and after it is taken out, the optimal intraday target is the previous week's high (PWH). The scenario will be invalidated if an hourly candle closes below 1.08715. In case of changes, I plan to update the idea.

GBJPY Sell/ShortClear signs is showing that GBPJPY has been breaking its main resistance from 196.881 and we can see that a reversal is on its way. I have placed TP, SL, and Entry on screen. Please follow for more updates and signals with breakdowns! Please message me directly if you have any inquires about these trades.

EURAUD Sell/ShortEURAUD seems to have been forming on the daily a perfect second leg for W formation to reverse and go bearish from here. A perfect bearish doji is being formed and we can clearly see that the next stop is bottom support. Please use proper risk management upon entering the trade!
EURAUD Sell/Short
ENTRY: 1.66453
TAKE PROFITS:
TP 1: 1.66186
TP 2: 1.61633
SL: 1.66978

EURUSD 1D1D - the daily timeframe is in a short context. Currently, we are in a corrective movement with the aim of overlapping the FVG. The lack of activity below the fractal compression (marked on the chart) inspires confidence. The target is 1.06. The scenario will be invalidated if the price closes above 1.088.
