Nasdaq 100 Near Breakout – Eyes on 22,200 ResistanceThe Nasdaq 100 is approaching a critical technical level at 22,200. This resistance marks the upper boundary of recent consolidation and aligns with prior rejection zones. A clean break above this threshold could trigger a sharp upside move, possibly propelling the index into uncharted territory.
Geopolitical tensions have eased, and the dollar’s renewed weakness is supporting risk appetite, particularly in the tech-heavy Nasdaq. Strong earnings from key sectors are reinforcing bullish sentiment, with investors increasingly pricing in a favorable macro backdrop.
Technically, momentum is building. Price action has formed a series of higher lows, and buying pressure is intensifying near resistance. A breakout above 22,200 could ignite a strong rally, driven by stop orders and fresh bullish entries.
That said, traders should remain cautious. While the breakout setup is promising, a retracement toward support zones—such as 21,500 or the 20-day moving average—remains possible, especially if upcoming inflation or macro data disappoints.
For now, the 22,200 level remains the key to watch. A daily close above this level would shift the bias clearly higher, confirming breakout strength and potentially accelerating gains toward 22,800 or beyond.
Fxtrading

EURUSD Short Part IIEURUSD Analysis
On EURUSD daily chart from CMC Markets quota, indicates a bullish trend with a symmetrical triangle pattern forming. The price has recently broken above a key resistance level, suggesting potential for continued upward movement.
Key Price Levels
Current Price: 1.16932
Stop Loss (SL): 1.16549
Take Profit 1 (TP1): 1.12003
Take Profit 2 (TP2): 1.09318
Trend Analysis
EURUSD shows clear signs on an ascending trend supported by higher lows and higher highs since early 2025. Both orange trend-lines which I created form a symmetrical triangle, with the price nearing the apex, hinting at a potential breakout or reversal which I have been looking for a reversal bearish breakout.
The upward momentum is strong, but the proximity to the upper trend-line and set take-profit levels indicates preparation for a possible correction. I still believe in shorts on EURUSD.
Conclusion
Traders and investors should monitor the price action near the triangle apex for breakout confirmation. The set stop loss and take-profit levels provide a structured approach to managing the trade, balancing potential gains with risk mitigation. Stay tuned for more updates on the trade.

XAGUSD - Buy for RR1XAGUSD – Positioning for a Continuation Push 🚀
Silver's recent structure shows bulls defending the 35.5 region with conviction. After a healthy consolidation, price has reclaimed short-term momentum, eyeing a return to previous highs.
I'm entering long from 36.147, expecting bullish continuation toward the next key resistance level.
Entry: 36.147
Take Profit (TP): 37.0
Stop Loss (SL): 35.4
RR:1
Let’s see how price action unfolds — I’ll be watching closely for momentum confirmation.
#XAGUSD #SILVER #MJTRADING #FOREX #SIGNALS

XAUUSD - 4H Breakout and Retest Setup🟡🟡🟡
🕒 June 17, 2025
Bias: Medium-Term Bullish
Structure: Breakout → Retest → Continuation
Context: Trendline break + confluence with EMA + prior resistance turned support
🔍 Market Structure Insight:
Major descending trendline broken with strong impulsive momentum.
Pullback held at the intersection of:
Broken trendline retest
EMA 60 dynamic support
Bullish structure of HL-HH (Higher Low / Higher High)
Strong bullish candle at support
✅ Trade Plan – Buy Stop Setup
Entry (Buy Stop): 3402
SL: 3373 (below the pullback structure + EMAs)
TP1: 3430 (local resistance area)
TP2: 3470 (measured move from previous leg height)
#XAUUSD #Gold #TechnicalAnalysis #BreakoutSetup #Forex #EMA #SqueezePlay #TrianglePattern #tradingview #MJTrading

Gold | 4h Structural LookoutPEPPERSTONE:XAUUSD
📅 June 18, 2025
Chart Title: “Gold's Battle at the Midpoint – Compression Before Explosion”
Bias: Neutral-to-Bullish
Structure: Ranging with Bullish Channel
✳️ Technical Summary:
Gold continues to coil near the upper half of its multi-month structure, testing traders’ patience before a potentially explosive move. Current PA is forming a tight consolidation right beneath mid-channel resistance, suggesting a directional breakout is imminent — especially with the FOMC catalyst ahead.
📏 Key Chart Features:
Clear Rising Channel: Acting as medium-term trend guide
Major Consolidation: Identified around 3,330–3,380
Historical Boxes & Reaction Lows: Multiple orange circles show clear buying interest zones
Possible Long-Term Range: Defined between 3,123 and ATH zone (3,500)
EMA Support: Price currently holding both 15 & 60 EMAs
📈 Scenarios to Watch:
🔼 Bullish Breakout Path:
Trigger: Break and close above 3,400
Confirmation: Follow-through above consolidation +full body close
TP1: 3,460
TP2: ATH retest around 3,500–3,540
SL: Below 3,320 or lower trendline
Invalidation: Break below channel
🔽 Bearish Breakdown Path:
Trigger: Breakdown below 3,325 support
First Target: 3,250
Expansion Target: 3,123 – base of the macro range
Extreme Bear Target: 3,000 zone
SL: Above 3,400
Consolidation Zoom in:
#Xauusd #Gold #Trading #MJtrading #forex #Chart #chartanalysis #signal #freesignal


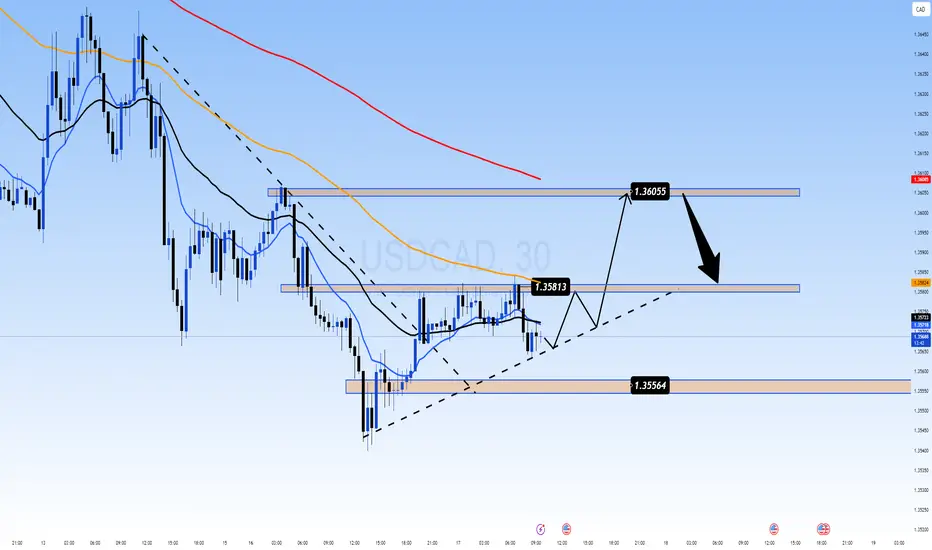
Oil Rises, Canadian Yields Surge: Can USD/CAD Rebound?USDCAD 17/06 – Oil Rises, Canadian Yields Surge: Can USD/CAD Rebound?
After a significant drop to the 1.355x area, USD/CAD is showing early signs of recovery. However, the pair remains influenced by strong macro headwinds—particularly oil prices and Canadian monetary policy signals.
🌐 Macro & Sentiment Overview
WTI crude oil is rising due to ongoing tensions between Israel and Iran, which increase the risk of global supply disruptions. This supports the Canadian Dollar (CAD) as a commodity-linked currency.
Canada’s 10-year bond yields have reached their highest levels in 5 months (~3.4%), reinforcing expectations that the BoC may remain hawkish in the near term.
USD weakens slightly as traders await more clarity from the Federal Reserve about the next rate cut timeline, potentially in Q3.
📊 Technical Analysis (M30 Chart)
Price is printing higher lows above the key trendline.
EMAs 13–34–89 are tightening → sign of sideways pressure before breakout.
Short-term bullish channel still intact.
Key resistance zones: 1.3581 and 1.3605.
🎯 Trade Setup Scenarios
📈 Long Scenario
Entry: 1.3556 – 1.3560 (trendline bounce)
Stop Loss: 1.3535
Take Profits: 1.3581 → 1.3605
✅ Wait for M30/H1 confirmation like bullish engulfing or price-action breakout.
📉 Short Scenario
Entry: 1.3605 (if price rejects resistance)
Stop Loss: 1.3630
Take Profits: 1.3581 → 1.3556
⚠️ Trigger only on bearish rejection with strong candle and volume at resistance.
📌 Strategic Outlook
USD/CAD is caught in a tug-of-war: stronger Canadian fundamentals (oil + yields) vs. cautious USD movement post-FOMC. If oil prices and Canadian yields continue to climb, CAD may remain in favor. However, short-term technical rebounds toward 1.3600 remain valid if price structure holds.
Sell Limit Setup above 2025 High📉 AUD/USD – 2H Chart Analysis
🕒 Published: June 16, 2025 | TF: 2H
🔔 Trade Idea: 2x Sell Limit at Key Resistance Zone
🔹 Market Context:
Price is trading within a rising broadening wedge pattern (marked by the white and blue trendlines).
Current rally retraced aggressively toward upper wedge resistance (2025 High), an area that has repeatedly capped bullish momentum.
Price approaching previous supply zone.
🔻 Sell Limit Setup 1
Entry: 0.65400
SL: 0.6584
TP: 0.6503
R:R ≈ 1
➕ Fades rally into resistance
➕ Aligns with EMA structure and intraday exhaustion
🔻 Sell Limit Setup 2
Entry: 0.6550
SL: 0.6584
TP: 0.6499
R:R ≈ 2
➕ Higher entry into wick zone (liquidity trap)
➕ Potential false breakout above structure
➕ SL above key swing high = cleaner invalidation
⚠️ Aggressive short: smaller SL, better RR

Squeeze in Progress: Will BOJ Trigger the Next Breakout?USDJPY 17/06 – Squeeze in Progress: Will BOJ Trigger the Next Breakout?
The USDJPY pair is currently consolidating just below the key 144.650 resistance, stuck within a tightening triangle structure. As markets await more clarity from both the Bank of Japan (BOJ) and the Fed, price action is showing signs of indecision — but pressure is building.
🌐 Macro & Sentiment Overview
BOJ maintains a neutral stance: Despite growing speculation of a hawkish shift, the BOJ held rates steady, providing no strong forward guidance. Markets remain cautious.
US Dollar remains resilient amid stable bond yields and expectations that the Fed may delay rate cuts, adding short-term support to USDJPY.
Geopolitical risk is on the rise: Ongoing Middle East tensions are fueling safe-haven demand for JPY, capping bullish momentum.
🔍 Technical Setup (M30 Chart)
Price is trapped inside a symmetrical triangle, tightening between 144.652 resistance and 143.126 support.
EMA 13/34/89 are aligned bullishly, but EMA 200 (red) is acting as a dynamic ceiling near 144.300.
Key support zones:
144.071: Minor structural level and trendline test.
143.126: Major liquidity zone and untested demand.
🎯 Trade Scenarios
📉 Scenario 1 – Sell on Rejection at 144.652
Entry: 144.650–144.700
Stop Loss: 145.250
Take Profit: 144.071 → 143.600 → 143.126
Ideal if BOJ shifts tone or USD weakens post-Fed comments.
📈 Scenario 2 – Buy on Bullish Reaction at 143.126
Entry: 143.100–143.150
Stop Loss: 142.700
Take Profit: 143.600 → 144.071 → 144.650 → 145.200
Valid only with clear bullish confirmation on M15–M30 structure.
🧠 Final Thoughts
USDJPY is coiling tightly ahead of a potential breakout. Macro uncertainty from central banks, geopolitical instability, and upcoming CPI data make this week highly volatile. Instead of chasing, let price come to your zones and react accordingly.
🔔 Focus on structure, confirm with price action, and avoid emotional trades. Patience and discipline are key in this compression phase.

Buy for R/R1Buy or Buy Limit @ 42615
SL: 42377
TP1: 42850
Signal from a backtested strategy with a win rate of 60 %.
Manage your risk...

EURJPY Breaks Out From Major Zone, Eyes Higher LevelsEURJPY Update, structure remains bullish
The pair has officially broken above a key resistance zone, showing solid bullish intent. This breakout is even more meaningful when you look at how price has been consistently supported by the long-term rising trendline. Every time price touched this trendline, it bounced with strength — and this time is no different.
The recent move suggests that buyers are firmly in control, and with the structure now pushing above resistance, momentum could continue to build.
As long as EURJPY holds above this breakout zone, the path of least resistance is to the upside.
DYOR, NFA

AUDUSD Coiling Near Key Resistance, Big Move Ahead?After a long period of sideways chop, AUD/USD is finally showing signs of strength. Price has been pressing against the key resistance zone, and we’re now seeing a tightening wedge breakout structure forming just beneath it.
A key moment on the chart is where sellers got trapped during that sharp downside wick. Since then, price has been recovering in a steady, controlled manner.
Now, with higher lows forming and momentum building near resistance, a parabolic move could be on the horizon if price manages to break out cleanly.
This is a classic setup where patience could pay off, the structure is bullish, and breakout confirmation may unlock strong upside potential.
DYOR, NFA

GBPJPY Hello traders,
I'd like to share the first trade of the day with you. The setup is a Buy trade on the GBPJPY pair.
Today is the last trading day of the week and we have major economic events on the calendar, including:
🔹 Average Hourly Earnings (MoM)
🔹 Non-Farm Payrolls (NFP)
🔹 Unemployment Rate
So it's wise to remain cautious while executing trades today.
🔍 Trade Details
✔️ Timeframe: 15-Minute
✔️ Risk-to-Reward Ratio: 1:1(me) /1:1.50
✔️ Trade Direction: Buy
✔️ Entry Price: 195.054
✔️ Take Profit: 195.403
✔️ Stop Loss: 194.985
🔔 Disclaimer: This is not financial advice. I’m simply sharing a trade I’ve taken based on my personal trading system, strictly for educational and illustrative purposes.
📌 Interested in a systematic, data-driven trading approach?
💡 Follow the page and turn on notifications to stay updated on future trade setups and advanced market insights.

USDCAD 04/06 – BoC Rate Decision Ahead USDCAD 04/06 – BoC Rate Decision Ahead | Will the Market Break Higher or Reverse From 1.3820?
The USDCAD pair is trading around the 1.3700 area as markets prepare for the upcoming Bank of Canada (BoC) interest rate decision. Price action shows potential for a breakout, but macro risks remain high.
🌍 MACRO OUTLOOK
BoC Expected to Hold Rates
Analysts widely expect the BoC to keep the interest rate unchanged at 2.75%, marking the third consecutive pause. Inflation has slipped below 2%, supporting the case for a dovish tone.
Trade Policy in Focus
With growing global uncertainties and Trump’s trade stance back in the spotlight, BoC Governor Tiff Macklem is expected to address policy risks, especially related to tariffs.
Market Sentiment
USD is mildly weaker after soft ISM data.
CAD remains near YTD highs but sensitive to policy commentary.
📉 TECHNICAL OUTLOOK – H2 Chart
Price is forming a potential double bottom near the 1.3693 zone – a key structure support.
Resistance sits at 1.3725 – 1.3757. A confirmed breakout could lead to a test of 1.3824, the recent high.
Failure to hold 1.3690 may expose deeper downside toward 1.3620–1.3600.
🔑 KEY LEVELS TO WATCH
🟢 BUY ZONE: 1.3693 – 1.3700
SL: 1.3670
TP: 1.3725 → 1.3757 → 1.3800 → 1.3824
🔴 SELL ZONE: 1.3824 – 1.3830
SL: 1.3850
TP: 1.3780 → 1.3750 → 1.3700 → 1.3650
🎯 TRADE STRATEGY
If BoC holds rates with a dovish bias, USDCAD may rally sharply toward 1.3824 and potentially higher.
If BoC surprises with hawkish comments, CAD strength may push the pair lower, targeting the 1.36 handle.
Traders should be cautious around 1.3690 – this is the pivot zone for the week.
📌 CONCLUSION
“The BoC’s decision may already be priced in – but the true volatility could come from Governor Macklem’s press conference. Any hint regarding Trump’s trade policies could trigger sharp moves. Stick to clean key levels and protect your capital.”

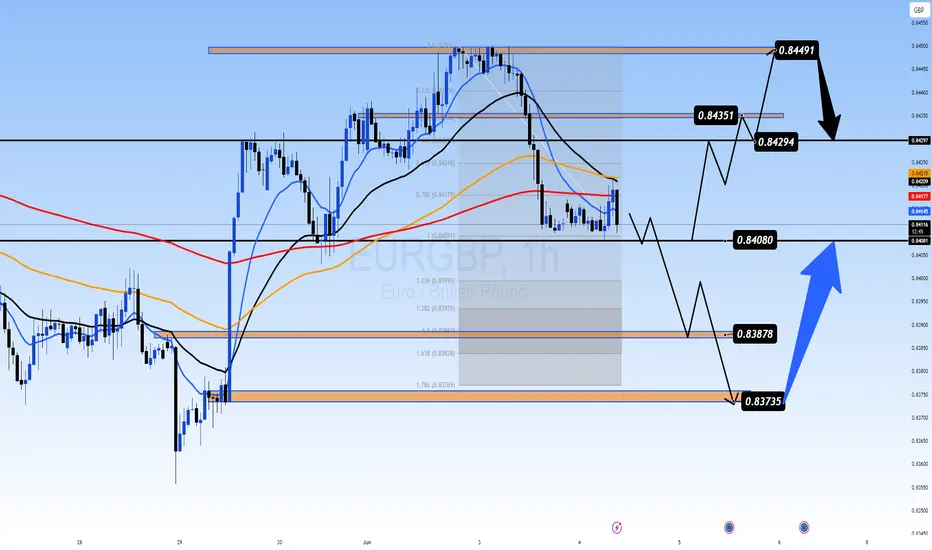
PMI Divergence & ECB Rate Decision Looms:0.84 Key Level in PlayEURGBP 04/06 – PMI Divergence & ECB Rate Decision Looms: 0.84 Key Level in Play
EUR/GBP is hovering around the 0.8420 mark after mixed PMI releases from the Eurozone and Germany. Traders are cautiously awaiting the ECB’s interest rate decision this Thursday, while the Bank of England signals potential easing — but remains non-committal on timing.
🌍 MACRO OUTLOOK
Eurozone & German PMI:
Eurozone Composite PMI eased to 50.2, still above forecasts (49.5) but reflecting slowing momentum.
German Composite dropped to 48.5; Services fell further to 47.1 — signaling contraction risk in Europe’s largest economy.
ECB Dovish Expectations:
Core inflation fell to 1.9% YoY in May — below the 2% ECB target for the first time in eight months.
Markets are fully pricing in a 25bps rate cut this week.
BoE Shifts Cautiously Dovish:
Governor Andrew Bailey acknowledged that monetary easing is likely, but warned of "uncertainty ahead."
The MPC is split — some fear sticky inflation; others warn that rates staying too high too long may damage growth.
Market Sentiment:
EUR remains pressured by ECB dovish expectations.
GBP is also under pressure from weak UK macro indicators and global trade tensions.
📉 TECHNICAL OUTLOOK (H1 Chart)
Price is consolidating near the EMA200 (0.8409) — a crucial dynamic support.
A tight sideways range has formed; 0.8408 is a key horizontal level to watch for breakout/breakdown confirmation.
Break below 0.8408 could send price toward Fibo 1.618 at 0.8383 or psychological support at 0.8373.
If bulls defend 0.8408, we may see a bounce toward 0.8429 → 0.8449 resistance zone.
🔑 KEY TRADE ZONES
🟢 BUY ZONE: 0.8380 – 0.8373
SL: 0.8358
TP: 0.8400 → 0.8415 → 0.8429 → 0.8435
🔴 SELL ZONE: 0.8448 – 0.8450
SL: 0.8460
TP: 0.8435 → 0.8420 → 0.8408 → 0.8388
⚠️ TRADE STRATEGY
Watch the 0.8408 area closely. If price holds → short-term BUY scalp opportunities.
If it breaks strongly → consider SELL toward lower Fibo/structure levels at 0.838x.
Be cautious around ECB release — avoid trading during the spike. Wait for structure confirmation post-news.
📌 CONCLUSION
"EUR/GBP is entering a critical zone near 0.8400. With ECB and BoE both leaning dovish, expect increased volatility. Hold or break at this key level will likely define the next directional leg. Stay patient and let the market show its hand."
Waiting for a Short-Term Pullback Before the Next Bullish Leg? NZDUSD – Waiting for a Short-Term Pullback Before the Next Bullish Leg?
As global markets await the upcoming U.S. Non-Farm Payrolls (NFP) report later this week, NZDUSD is showing early signs of short-term weakness following a strong bullish rally from the 0.5905 low. While the broader structure remains bullish, a corrective move may be necessary to shake out weak hands and reload liquidity before a renewed surge.
🌐 Macro & Fundamental Outlook:
New Zealand: Recent economic releases from New Zealand have been lackluster, yet the RBNZ's hawkish policy stance (high interest rates) continues to support the Kiwi. However, pressure from China – New Zealand’s top trading partner – remains a drag.
United States: The U.S. Dollar remains under pressure due to rising expectations that the Fed will start cutting rates by Q3 2025, despite some hawkish tones from FOMC officials. This week’s NFP report will be a decisive factor.
Market Sentiment: After a ~150-pip rally, traders are beginning to take profits. The correction could offer a golden re-entry opportunity.
📊 Technical Analysis:
Trend Bias: The market structure is still in an uptrend, maintaining Higher Highs and Higher Lows.
Fibonacci Retracement: Price is currently pulling back toward the 0.5 – 0.618 Fibo zone (0.5992 – 0.5978), aligning with the H1 89 & 200 EMAs.
EMA Structure (13 – 34 – 89 – 200): Still bullish but currently signaling a short-term pullback.
🔑 Key Price Zones:
Resistance Levels: 0.6014 – 0.6052
Support Levels: 0.5973 – 0.5951 – 0.5932
🧭 Trade Plan
📌 Buy Setup (trend continuation):
BUY ZONE: 0.5951 – 0.5932
SL: 0.5900
TP: 0.5978 → 0.6014 → 0.6052
📌 Expecting a bullish bounce off the 61.8% Fibo + EMA 200 confluence ahead of NFP.
📌 Sell Setup (short-term countertrend scalp):
SELL ZONE: 0.6014 – 0.6025
SL: 0.6060
TP: 0.5978 → 0.5951
📌 Anticipating a reaction at a key resistance zone – ideal for intraday scalpers.
⚠️ Risk Management Notes:
Stay cautious ahead of high-impact U.S. data (ADP, Jobless Claims, NFP).
Favor buying the dip in line with the higher-timeframe trend.
Maintain discipline with tight SLs (30–35 pips max per setup).

EURUSD CRACK!I first turned bullish on the EUR back in November 2024 after the disastrous election results.
I have always felt the 105 area was a good area to go long, fundamentally going back all the way to 2017. Here is an example.
After 17 years of data, we can all agree that the 105 area was a great value to get long the EUR. Now we see a major CRACK! in the chart with the fundamentals to back it up.
Again, I remind you I am a MACRO Trader. So my trades hold for a long, long time unless the facts change. I don't do 3 pips and i am out crap!
Let this be a WARNING! To the dollar bulls!
Click Boost, follow, subscribe! Let's get to 5,000 followers so I can help them navigate these crazy markets, too. ))

The Ultra Idea : d-MR96nBa's Ultimate Market Journal🌌The Ultra Idea : d-MR96nBa's🌠Ultimate Market Journal🎨
Hello Fellow Travelers
It's been some time since I've posted a Fresh Idea, though I've remained actively trading.
What better way to mark my TradView return, than to start an Ultimate Market Journal.
Financial Markets have taken my deep interest again recently, especially as we seem to be at a time of accelerating change and shifting regimes.
I believe many opportunities abound to those with open, flexible and creative minds.
A bit more about myself.
I've been involved with financial markets in one form or fashion for 18 years now.
I started out like most of us, approaching the game with fundamental analysis, only to later incorporate and then fully graduate to T/A.
I'm a natural Contrarian.
My brand of technical analysis is as much about aesthetics, creative expression, discovering hidden truths and applying Universal Principles as it is running the numbers.
I'm starting this off with Ultra Bond Futures, as UB's are the trading instrument I've come to specialise in, having had the most ongoing consistent success trading.
This by no means is going to be a "I bought here and sold there" type of Journal, as that's not my style.
Nor am I going to focus on a single market instrument, observation or style of analysis.
I'd like this to become a repository of accumulated wisdom and unique market perceptives.
I've just begun contemplating what this may evolve into in time, and I invite you to join me in taking this Leap
d-MR96nBa🌌
Concept
Inversion📈📉
Seek out and analyse whatever moves exactly inverse to what you intend to trade.
If you're having trouble discerning trend or observing price patterns, check the inverse.
This can be an excellent technique for exposing Bias.
This can work particularly well for currency traders, though can be Universally applied.
For US Ultra Bonds, the inverse is the US 30 Year Yield
Ultra Bond Futures
US 30 Year Yield
Currency traders, say you're about to trade AUD/CHF
Check out the CHF/AUD chart first, if they both appear Bullish or Bearish, you've got a Bias.
AUD/CHF
CHF/AUD
GBP/JPY
JPY/GBP
EUR/USD
USD/EUR
Are there any examples of Inversion in Trading you'd like to share ?
What else is on my🧠
Well just casually, I believe we're currently witnessing Peak Bitcoin in it's entire Life-cycle.
Have we Bull Trapped & Breakaway Gapped on Berkshire Hathaway
BRK.B
It's in the Detail

$3350 would indicate short-term strengthGold Price Analysis – Technical Outlook
Gold is currently approaching a critical resistance level around 3350. If the price manages to break and close above this level on the 15-minute chart, it could signal the continuation of the bullish trend. A confirmed 15-minute candle close above 3350 would indicate short-term strength and increased buying pressure.
To strengthen this bullish bias, we are also watching for a Break of Structure (BOS) on the 1-hour timeframe. A BOS would suggest a shift in market structure, potentially transitioning from a consolidation or retracement phase into a new impulsive leg to the upside.
If both conditions – the 15M candle close above 3350 and a 1H BOS – are met, the next immediate target would be 3370. Depending on how the price action unfolds beyond that point, and supported by additional confirmations such as volume, momentum indicators, or price patterns, there could be further upside potential.
As always, ensure you apply risk management and conduct your own thorough analysis before making any trading decisions.
Disclaimer: This is not financial advice. Please do your own research (DYOR).

XAUUSDGold kicks off the week with a strong bullish move — and the same applies to BTC, which is now getting very close to its all-time high.
Gold is also showing impressive strength, so despite being on a lower time frame, I’ve decided to activate a Buy position on XAUUSD.
🔍 Trade Details:
✔️ Timeframe: 15-Minute
✔️ Risk-to-Reward Ratio: 1:1.50
✔️ Trade Direction: Buy
✔️ Entry Price: 3308.62
✔️ Take Profit: 3315.25
✔️ Stop Loss: 3304.20
🔔 Disclaimer: This is not financial advice. I'm sharing a trade I'm personally taking based on my own strategy, strictly for educational and illustrative purposes.
📌 If you're interested in a systematic and data-driven approach to trading:
💡 Follow the page and enable notifications to stay updated on future setups, analysis, and strategic insights.

GBP/USD Breaks Key Resistance Zone – Bullish OutlookGBP/USD has broken above a long-standing resistance zone on the weekly chart, signaling a potential shift in long-term trend. This breakout aligns with a strong rising trendline that has held firm for months, showing growing bullish momentum.
If price continues to hold above the breakout level, the market could be setting up for a sustained upward move. A successful retest of the breakout zone would further confirm bullish continuation. The structure looks healthy, and the momentum is clearly on the buyer’s side.
DYOR, NFA
Thanks for following along — stay tuned for more updates!

GBPUSDHello traders!
There’s currently an opportunity for a Sell trade on GBPUSD, and the position is now active.
🔍 Trade Details:
✔️ Timeframe: 15-Minute
✔️ Risk-to-Reward Ratio: 1:2
✔️ Trade Direction: Sell
✔️ Entry Price: 1.33695
✔️ Take Profit: 1.33531
✔️ Stop Loss: 1.33777
🔔 Disclaimer: This is not financial advice. I’m simply sharing a trade I’m personally taking based on my own strategy. It is intended purely for educational purposes.
📌 Interested in a more systematic and data-driven approach to trading?
💡 Follow the page and turn on notifications to stay updated with future trade ideas and market breakdowns.

XAUUSDHello traders!
I’m sharing what may be your first trade of the week. This setup comes from the XAUUSD pair. I currently see a Buy opportunity in Gold, and the trade is already active on my side.
🔍 Trade Details:
✔️ Timeframe: 15-Minute
✔️ Risk-to-Reward Ratio: 1:1.50
✔️ Trade Direction: Buy
✔️ Entry Price: 3223.82
✔️ Take Profit: 3237.39
✔️ Stop Loss: 3214.78
🔔 Disclaimer: This is not financial advice. I’m simply sharing a trade I’m personally taking, based on my own methodology. It is intended purely for educational purposes.
📌 If you're interested in a more systematic and data-driven approach to trading:
💡 Follow the page and turn on notifications to stay updated with future trade ideas and market breakdowns.
