Dollar vs Yuan Divergence US Dollar vs Yuan or US Dollar vs Offshore Yuan, technically they are establishing divergence. Above chart is my projection in time to come.
When Dollar vs Yuan moves lower, this means we are seeing a weaker Dollar and a stronger Yuan. See the following link for its video version.
The Chinese yuan, also known as RMB, is the official currency of China. It is used both onshore in mainland China and offshore in international markets.
The offshore yuan, also known as the CNH (Chinese yuan - Hong Kong), is the version of the yuan that is traded outside of mainland China. It is traded in offshore financial centers, such as Hong Kong, Singapore, and London. The offshore yuan is not subject to the same restrictions and regulations as the onshore yuan.
The main difference between the onshore and offshore yuan is that the onshore yuan is subject to capital controls imposed by the Chinese government, while the offshore yuan is not subject to these same restrictions. This means that the offshore yuan is more freely tradable and can be used for a wider range of international transactions, such as international trade and investment, while the onshore yuan is more restricted in its use.
Offshore Yuan -
Standard-Size USD/Offshore RMB (CNH)
Outright:
0.0001 per USD increment = 10 CNH
MICRO USD/CNH FUTURES
0.0001 offshore Chinese renminbi per USD
CNH Option
Google search:
USD/CNH Monthly Options Contract Specs - CME Group
Google search
Frequently Asked Questions: USD/CNH options - CME Group
Disclaimer:
• What presented here is not a recommendation, please consult your licensed broker.
• Our mission is to create lateral thinking skills for every investor and trader, knowing when to take a calculated risk with market uncertainty and a bolder risk when opportunity arises.
CME Real-time Market Data help identify trading set-ups in real-time and express my market views. If you have futures in your trading portfolio, you can check out on CME Group data plans available that suit your trading needs www.tradingview.com
Fxtrading


Bullish Trend Continues for GBP/USD PairThe GBP/USD pair is currently in an uptrend and has been continuing its rally despite experiencing a pullback at the previous 61.8% Fibonacci level. We have observed that the price has rebounded in this area, and our forecast remains bullish as we anticipate a new and fresh impulse to push the price towards the upside of the chart.
To elaborate further, it seems that the currency pair is gaining momentum, and traders can expect a positive trend to emerge. Based on the technical analysis, we can anticipate a steady rise in the GBP/USD price, which may be fueled by a range of economic factors, such as strong market sentiment and a robust global economy.
Therefore, we advise traders to stay vigilant and keep a close eye on the market as it evolves. The current trend suggests that the GBP/USD pair has a potential for further growth, and investors should capitalize on this opportunity.
In conclusion, the GBP/USD pair is showing signs of strength, and the market outlook remains positive. We recommend traders to exercise caution, but at the same time, take advantage of the prevailing bullish trend.

EUR/USD in Correction Mode: Potential Pullback Ahead.The EUR/USD currency pair has witnessed a decline in its value and subsequently bounced back from the 1.0975 region. Over the past week, the EUR/USD has been retreating from its recent highs in the proximity of 1.1100. This drop can be attributed to the correction in the upside movement of the dollar.
As of now, the price movement of the EUR/USD is expected to continue to follow the dynamics of the dollar closely. It is also expected to be influenced by the diverging intentions of the Fed and ECB banks regarding potential interest rate changes.
Despite the hawkish stance of the ECB, which supports further rate hikes, there seems to be a loss of momentum in economic fundamentals in the region, which contrasts this view.
Our analysis suggests that the EUR/USD might experience a pullback in the 50%-61.8% Fibonacci area before setting up for a new long position. However, if the price falls below the 78.6% Fibonacci level, it could indicate a short entry opportunity.

GBP/JPY Faces Bearish Chart Formation with Mild Gains: AnalysisAt the start of the London trading session on Monday, GBP/JPY shows a slight increase in value, hovering around 166.50. However, the cross-currency pair is facing a challenge in maintaining its upward momentum over the past four days, as it is currently caught in a bearish chart pattern, known as the Head and Shoulders pattern.
If the dynamic trendline of the pattern, referred to as the "Neckline," is broken, this could confirm a downside trend for the pair. However, if the price manages to rise above the level of the Right Shoulder, it may indicate a long setup.

GBPUSD Long setup 1:4RRConfluences
1.Weekly/Daily/4H - Bullish
2. Trendline
3. 1H Oversold
4. 30M Engulfing
5. Major resistance break and retest
Take profit targets
TP1 - 1.25000
TP2 - 1.25400

USDJPY and how to Short itHey Guys,
So here's another YEN.
137 Area is FAR more feasible for shorts. Currently you are low still after the grand fall we looked at.
Let the market retrace and short POPS.
That is the only way to trade with the overall natural trend of the market (up and down Via waves)

GBPNZD And Key PAGBPNZD has gone sideways for a very, very long time...
WHY? Well it's easy. Open your eyes and look for areas of rejection.
Just like the ones drawn (new long zones)
Exit any shorts taken.

EURJPY And Historical Market PricesEURJPY is a clear example of when it is a good idea to check back for old PA levels.
This is because the price has rallied and becomes more extreme.
The more extreme price gets the older the PA levels that are relevant become because they have not been hit for a while. As the EUR gains VS the JPY this becomes the case.
You can see to the LEFT handside of the chart denoted PA levels (where traders have created rejection)
That forms the Bias for new moves.
Any Qs ask.

USD/JPY Bears Eye Downward Trend as US Dollar Faces PressureThe current market for USD/JPY is dominated by the bears, who are eagerly anticipating a continuation of the downward trend. At this crucial moment, the trendline support is highly vulnerable. As Tokyo traders enter the market on Friday, the price of USD/JPY remains stagnant, resting below a significant resistance area near 132.70 on the 4-hour charts. The US Dollar is facing pressure, mainly due to the week's data that has led to the belief that the Federal Reserve will pause in its tightening policy campaign, with just one last rate hike scheduled for May.
The primary focus of the market has been on the inflation data, with the Consumer Price Index (CPI) showing a year-on-year decrease from 6% in February to 5% in March. Furthermore, the Producer Price Index (PPI) for final demand, which was released on Thursday, also indicated a continued decrease in inflationary pressures, with a 0.5% drop last month. Over the twelve months leading to March, the PPI increased 2.7%, representing the smallest year-on-year rise since January 2021, following a 4.9% increase in February.
In the event that the price breaks out of the dynamic trendline, we can expect to see a further pushdown in the price, moving in a downward direction.

GBPJPY RejectionIf you are looking at the GBP JPY and wondering why it looks like it does..
Remember it's just one reason ONLY.
Price rejection re occurs because it becomes obvious (just use your eyes) that that certain area is for sellers.
Looking short accordingly on any RE pushes.

Euro VS USD Full Multi Time Frame AnalysisHey Traders,
After CPI data yesterday and FOMC Discussing Rate hikes we can touch on each Timeframe for the EURUSD.
This comes as we rise past the latest prev high.
Ask any Qs should you have them.

EURUSD: Strongly Bullish Bias MaintainedYesterday, our long Take Profit (TP) for the EURUSD was successfully achieved, and we have now expanded the TP zone to encompass the 1.1060 level, where the price could potentially rise in the coming days. Our trading bias remains decidedly bullish for the days ahead.

Bearish Bias Maintained as USD/JPY Prepares for Potential DropAfter successfully implementing yesterday's trading idea, the USD/JPY is currently profitable. However, a new bearish momentum may be on the horizon, and as a result, we have updated the Take Profit (TP) target to reflect a potential drop in price. Our trading bias remains bearish, given that the EUR/USD is currently showing growth.

For Those Asking About Buying GBP..Hey Guys,
Some have asked me about buying the GBPUSD FX pair. We just had CPI data falling inline with expectations that did not enormously shift GBP upwards or to the downside.
Nonetheless our bias remains higher for shorts. WHY? Because that is where Key Risk Averse PA zones exist (larger money short zones). This coincides with the fact you have risen on the GBP for a long amount of time now as a retracement. Within these retracements you will inevitably get rebounds of price as sellers RE move into the market within the upmove.
So having said that we are not looking to buy LATE. the train has gone and we need to just wait at the stop again. Buying high is never a good idea. This is an issue. That's because if you are buying it you are buying it WAY after it's been bought (and it's no longer cheap)... If you keep doing that you will statistically be unprofitable (and naturally).
Buy dips, sells rips.

EURUSD Bullish Uptrend: New Long Position IdeaThe EURUSD currency pair is exhibiting a continued upward momentum today, favoring the existing bullish uptrend. As a result, our team has formulated an insightful analysis, proposing a new long position to align with the prevailing trend.

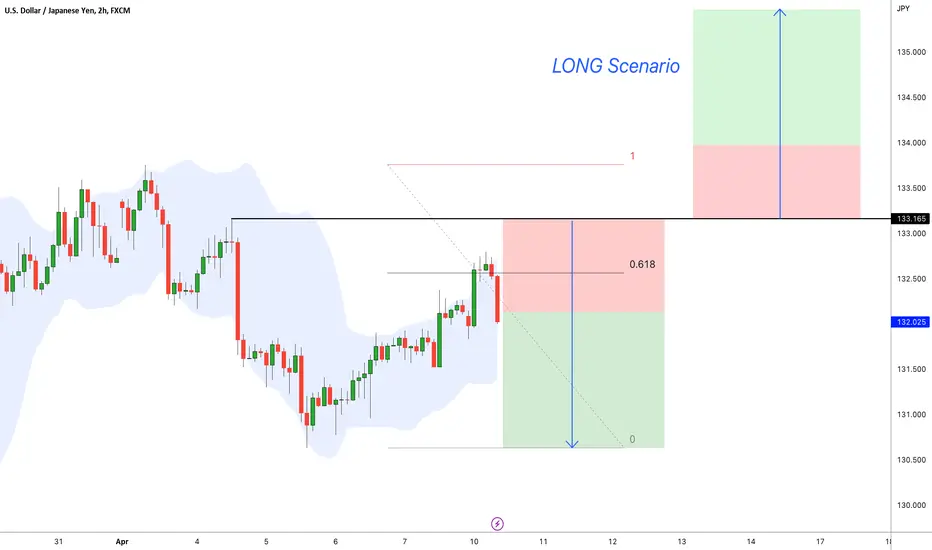
USD/JPY Divergence: Short Setup ScenarioHello traders,
Today, I have observed a divergence in the USD/JPY currency pair, and based on my analysis, I propose a new short setup for this pair. However, if the price manages to break the resistance level at 134.20, it will invalidate the short setup, creating room for a long scenario.
Thank you for considering my analysis, and happy trading!

USDCAD | Entry Price 1.34681 | Target Price 1.36165Engulfing Candlestick Pattern formed on the 4H Chart. Pin Bar Candlestick formed on the 4H Chart. Entered Long Position At Price Level 1.34681.

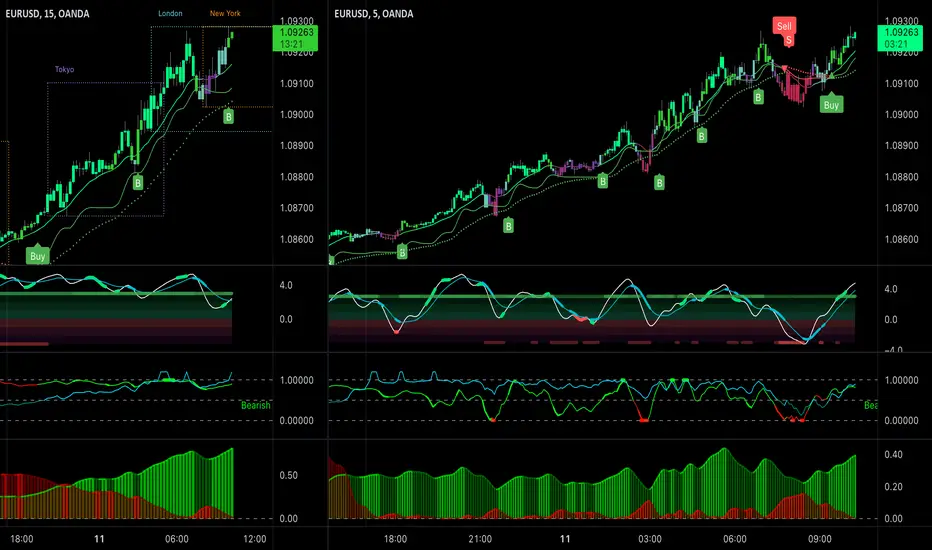
Using The DXY To Trade Currency Markets Pre NewsHey Traders,
As you know we have a wave of news coming tomorrow that could move markets.
Often my students ask me how to use the DXY appropriately as a tool for currency markets. The secret is to not make it confuse you. Do not let it sway your decisions so that you can't move a muscle unless all is perfect.
Use it for value and use it as a gauge.
Any Q's drop below.
So here it is as a tool.
Watch and trade safely.

EUR/USD - Proving that the Dollar Index Really Does MatterOANDA:EURUSD
Nice moves to the upside since yesterday's NY closing.
How many littles scalp pieces did you snag?
Know when, and when not, to jump on board, as all trends come to an end sooner than later.
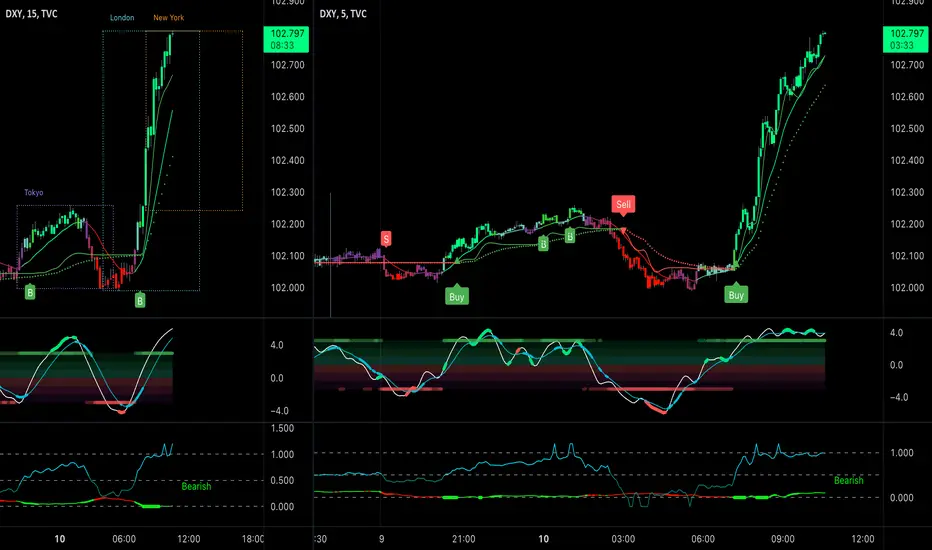
Dollar Dollar Dollar - Always about the DollarTVC:DXY
Smooth as butter these days with the Dollar Index.
Don't trade against it when looking at your favorite pair.
It just might give you that edge.
Short Continuation Bias for USD/JPYHello traders! As we discussed in our last idea, the USD/JPY is currently experiencing a bearish trend and has already reached the 61.8% Fibonacci level. We anticipate further downward movement in the market and maintain our bias for a short continuation.
GBP/USD Showing Bullish Continuation Pattern 50% Fibo 1.2400 SUPDuring early Easter Monday morning in London, the GBP/USD currency pair is experiencing a drop for the fourth consecutive day, as it takes offers to refresh the intraday low near 1.2400. This is a result of the US Dollar rebounding due to risk aversion and hawkish bets on the US Federal Reserve (Fed), following last week's pullback from a 10-month high. Meanwhile, the Bank of England's (BoE) next move is uncertain, causing doubts about the pair's future direction.
Based on our analysis, the GBP has experienced a pullback towards the 1.2400 area, which coincides with the 50% Fibonacci level. We have identified a bullish flag pattern of continuation, indicating that there is a high probability of a new bullish impulse for the Cable.
