GBPJPYHello Traders,
Today’s first setup comes from GBPJPY. Based on current market conditions, I’ve identified a high-probability sell opportunity. The trade has already been executed on my end, with a Risk-to-Reward Ratio set between 1:1.5 and 1:2, depending on your individual risk appetite.
🔍 Trade Details:
✔️ Timeframe: 15-Minute
✔️ Risk-to-Reward Ratio: 1:1.50 / 1:2
✔️ Trade Direction: Sell
✔️ Entry Price: 193.564
✔️ Take Profit: 193.256
✔️ Stop Loss: 193.768
🔔 Disclaimer: This is not financial advice. I'm simply sharing a trade I’m personally taking, based on my own methodology. It is intended purely for educational purposes.
📌 If you're interested in a more systematic and data-driven approach to trading:
💡 Follow the page and turn on notifications to stay up to date with future trade ideas and market breakdowns.
Fxtrading
GBPCHF; FXAN & Heikin Ashi trade exampleOANDA:GBPCHF
In this video, I’ll be sharing my analysis of GBPCHF, using FXAN's proprietary algo indicators with my unique Heikin Ashi strategy. I’ll walk you through the reasoning behind my trade setup and highlight key areas where I’m anticipating potential opportunities.
I’m always happy to receive any feedback.
Like, share and comment! ❤️
Thank you for watching my videos! 🙏
USDJPY On The Verge Of A CollapseA simple trade setup with good risk/reward but with huge economic implications should this structure CRACK!
With all H&S patterns, the risk is that it head tests before breaking down.
We've seen this play out recently in NFLX
That is why it is important to wait for the CRACK! And not front-run the trade.
FXAN & Heikin Ashi Trade IdeaOANDA:NZDUSD
In this video, I’ll be sharing my analysis of NZDUSD, using FXAN's proprietary algo indicators with my unique Heikin Ashi strategy. I’ll walk you through the reasoning behind my trade setup and highlight key areas where I’m anticipating potential opportunities.
I’m always happy to receive any feedback.
Like, share and comment! ❤️
Thank you for watching my videos! 🙏
Sellers Trapped! AUD/USD Flips Structure to BullishAustralian Dollar / U.S. Dollar (AUD/USD)
📆 Timeframe: 1-Day (1D)
📈 Technical Breakdown:
1. Sideways Consolidation Zone
The price has been consolidating within a clear horizontal range.
This range is defined by upper resistance and lower support zones, with several rejections confirming the boundaries.
2. Downtrend Resistance Line Broken
A long-standing resistance trendline has been breached to the upside.
This breakout suggests a potential trend reversal or continuation rally if price holds above.
3. Seller Trap Identified
There was a strong liquidity sweep below the support zone, labeled “Sellers Got Trapped.”
This is a classic liquidity grab, where shorts were likely triggered before price reversed sharply upward.
4. EMA 50 as Dynamic Support
Price has reclaimed the 50 EMA (0.62701), indicating a shift in short-term momentum towards the bulls.
If the price remains above this moving average, it could act as a dynamic support in the near term.
5. RSI (Relative Strength Index) at 57.62
RSI is in bullish neutral territory, suggesting there’s still room for upward momentum before overbought levels (>70).
No bearish divergence is currently visible.
✅ Bullish Outlook:
Breakout above resistance trendline ✅
Recovery above EMA 50 ✅
Seller trap below range ✅
RSI supports further move ✅
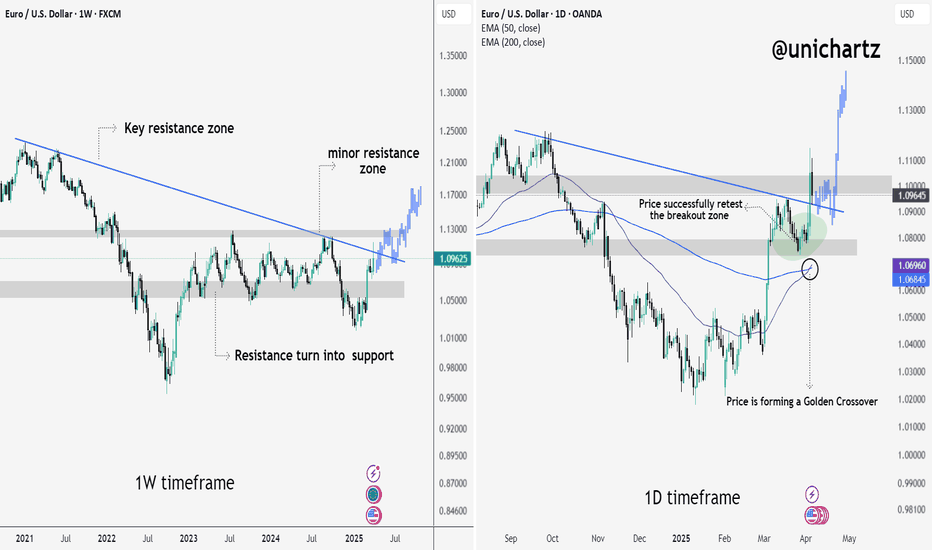
EUR/USD – Golden Crossover & Breakout Confirmation (Multi-T.F)EUR/USD is showing strong bullish signs across both the weekly and daily timeframes, suggesting a potential macro trend reversal in the making. After being trapped below a long-term descending trendline for nearly two years, price has not only broken out but also successfully retested the breakout zone — a key validation for trend continuation.
On the daily chart, a Golden Crossover is now forming, which historically precedes major uptrends in forex pairs. Combined with reclaiming key structural levels and building higher lows, EUR/USD could be positioning for a powerful upside move in Q2 2025.
Let’s dive into the multi-timeframe analysis to understand why this setup could be one of the cleanest trend reversals on the board.
1W Timeframe – Macro Breakout in Progress
EUR/USD has officially broken out of a long-standing descending resistance trendline. This breakout occurred from a structurally important zone that had acted as a ceiling for over 2 years.
📌 Key Observations:
🔹 Price reclaimed and held above the key resistance zone, turning it into strong support.
🔹 Minor resistance zones lie ahead, but structure favors further upside.
🔹 Projection shows potential continuation toward 1.16+ if momentum sustains.
1D Timeframe – Bullish Retest + Golden Cross Forming
Zooming into the daily chart, we see:
✅ A successful retest of the breakout zone, which held as support (bullish confirmation).
✅ Price is now forming a Golden Crossover – where the 50 EMA is crossing above the 200 EMA. This is typically seen as a strong bullish signal in trending markets.
📌 What’s Bullish:
Clean breakout ✔️
Retest with strength ✔️
Momentum crossover ✔️
EUR/USD is now in a strong bullish structure, backed by a confirmed breakout on the weekly and a golden crossover on the daily. If price holds above 1.09, we may see continued upside toward 1.13–1.16 levels in the coming weeks.
Thank you for reading and supporting @unichartz. If you found this analysis helpful, don’t forget to like, follow, and share! 💙
EUR/JPY Eyes Breakout — Can Bulls Push Through Resistance?EUR/JPY Weekly Chart Analysis
EUR/JPY is holding strong above a rising trendline that’s acted as support since 2022. The pair recently bounced from a key support zone and is now testing a major resistance area.
A breakout above this zone could trigger a bullish continuation, while rejection may lead to another pullback toward the trendline.
Key Levels:
Support: 153.5–155.0
Resistance: 163.5–165.0
Watch for: Weekly close above resistance for bullish confirmation.
Structure remains bullish as long as the trendline holds.
FXAN & Heikin Ashi Trade IdeaOANDA:EURUSD
In this video, I’ll be sharing my analysis of EURUSD, using FXAN's proprietary algo indicators with my unique Heikin Ashi strategy. I’ll walk you through the reasoning behind my trade setup and highlight key areas where I’m anticipating potential opportunities.
I’m always happy to receive any feedback.
Like, share and comment! ❤️
Thank you for watching my videos! 🙏
FXAN & Heikin Ashi Trade IdeaOANDA:AUDUSD
In this video, I’ll be sharing my analysis of AUDUSD, using FXAN's proprietary algo indicators with my unique Heikin Ashi strategy. I’ll walk you through the reasoning behind my trade setup and highlight key areas where I’m anticipating potential opportunities.
I’m always happy to receive any feedback.
Like, share and comment! ❤️
Thank you for watching my videos! 🙏
FXAN & Heikin Ashi Trade IdeaOANDA:AUDNZD
In this video, I’ll be sharing my analysis of AUDNZD, using FXAN's proprietary algo indicators with my unique Heikin Ashi strategy. I’ll walk you through the reasoning behind my trade setup and highlight key areas where I’m anticipating potential opportunities.
I’m always happy to receive any feedback.
Like, share and comment! ❤️
Thank you for watching my videos! 🙏
EUR/USD at a Pivotal Level – Will Bulls Push Higher?The EUR/USD pair is showing signs of a trend reversal after breaking above a long-term descending trendline. This breakout, coupled with an inverse head and shoulders pattern and RSI bullish divergence, signals strengthening bullish momentum. However, the price faces key resistance around 1.0500-1.0527, aligned with the 200 EMA.
A confirmed break above this level could push the pair toward 1.10+, while failure to do so may lead to a pullback before another attempt higher.
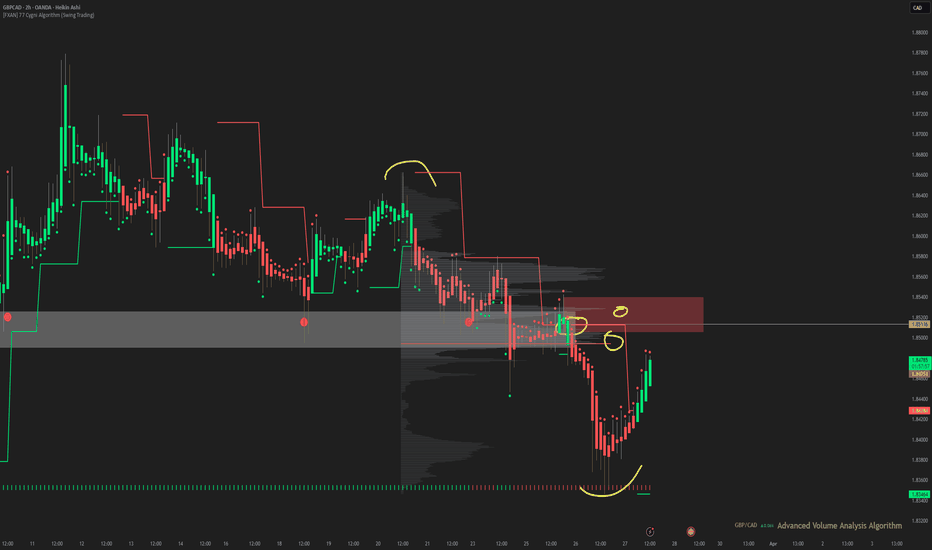
FXAN & Heikin Ashi Trade IdeaOANDA:GBPCAD
In this video, I’ll be sharing my analysis of GBPCAD, using FXAN's proprietary algo indicators with my unique Heikin Ashi strategy. I’ll walk you through the reasoning behind my trade setup and highlight key areas where I’m anticipating potential opportunities.
I’m always happy to receive any feedback.
Like, share and comment! ❤️
Thank you for watching my videos! 🙏
FXAN & Heikin Ashi Trade IdeaOANDA:USDCHF
In this video, I’ll be sharing my analysis of USDCHF, using FXAN's proprietary algo indicators with my unique Heikin Ashi strategy. I’ll walk you through the reasoning behind my trade setup and highlight key areas where I’m anticipating potential opportunities.
I’m always happy to receive any feedback.
Like, share and comment! ❤️
Thank you for watching my videos! 🙏
USDJPY; Heikin Ashi Trade IdeaOANDA:USDJPY
In this video, I’ll be sharing my analysis of USDJPY, using my unique Heikin Ashi strategy. I’ll walk you through the reasoning behind my trade setup and highlight key areas where I’m anticipating potential opportunities.
I’m always happy to receive any feedback.
Like, share and comment! ❤️
Thank you for watching my videos! 🙏
Behind the Curtain The Economic Pulse Behind Euro FX1. Introduction
Euro FX Futures (6E), traded on the CME, offer traders exposure to the euro-dollar exchange rate with precision, liquidity, and leverage. Whether hedging European currency risk or speculating on macro shifts, Euro FX contracts remain a vital component of global currency markets.
But what truly moves the euro? Beyond central bank meetings and headlines, the euro reacts sharply to macroeconomic data that signals growth, inflation, or risk appetite. Using a Random Forest Regressor, we explored how economic indicators correlate with Euro FX Futures returns across different timeframes.
In this article, we uncover which metrics drive the euro daily, weekly, and monthly, offering traders a structured, data-backed approach to navigating the Euro FX landscape.
2. Understanding Euro FX Futures Contracts
The CME offers two primary Euro FX Futures products:
o Standard Euro FX Futures (6E):
Contract Size: 125,000 €
Tick Size: 0.000050 per euro = $6.25 per tick per contract
Trading Hours: Nearly 24 hours, Sunday to Friday (US)
o Micro Euro FX Futures (M6E):
Contract Size: 12,500 € (1/10th the size of 6E)
Tick Size: 0.0001 per euro = $1.25 per tick per contract
Accessible to: Smaller accounts, strategy testers, and traders managing precise exposure
o Margins:
6E Initial Margin: ≈ $2,600 per contract (subject to volatility)
M6E Initial Margin: ≈ $260 per contract
Whether trading full-size or micro contracts, Euro FX Futures offer capital-efficient access to one of the most liquid currency pairs globally. Traders benefit from leverage, scalability, and transparent pricing, with the ability to hedge or speculate on Euro FX trends across timeframes.
3. Daily Timeframe: Key Economic Indicators
For day traders, short-term price action in the euro often hinges on rapidly released data that affects market sentiment and intraday flow. According to machine learning results, the top 3 daily drivers are:
Housing Starts: Surging housing starts in the U.S. can signal economic strength and pressure the euro via stronger USD flows. Conversely, weaker construction activity may weaken the dollar and support the euro.
Consumer Sentiment Index: A sentiment-driven metric that reflects household confidence. Optimistic consumers suggest robust consumption and a firm dollar, while pessimism may favor EUR strength on defensive rotation.
Housing Price Index (HPI): Rising home prices can stoke inflation fears and central bank hawkishness, affecting yield differentials between the euro and the dollar. HPI moves often spark short-term FX volatility.
4. Weekly Timeframe: Key Economic Indicators
Swing traders looking for trends spanning several sessions often lean on energy prices and labor data. Weekly insights from our Random Forest model show these three indicators as top drivers:
WTI Crude Oil Prices: Oil prices affect global inflation and trade dynamics. Rising WTI can fuel EUR strength if it leads to USD weakness via inflation concerns or reduced real yields.
Continuing Jobless Claims: An uptick in claims may suggest softening labor conditions in the U.S., potentially bullish for EUR as it implies slower Fed tightening or economic strain.
Brent Crude Oil Prices: As the global benchmark, Brent’s influence on inflation and trade flows is significant. Sustained Brent rallies could create euro tailwinds through weakening dollar momentum.
5. Monthly Timeframe: Key Economic Indicators
Position traders and institutional participants often focus on macroeconomic indicators with structural weight—those that influence monetary policy direction, capital flow, and long-term sentiment. The following three monthly indicators emerged as dominant forces shaping Euro FX Futures:
Industrial Production: A cornerstone of economic output, rising industrial production reflects strong manufacturing activity. Strong U.S. numbers can support the dollar, while a slowdown may benefit the euro. Likewise, weaker European output could undermine EUR demand.
Velocity of Money (M2): This metric reveals how quickly money is circulating in the economy. A rising M2 velocity suggests increased spending and inflationary pressures—potentially positive for the dollar and negative for the euro. Falling velocity signals stagnation and may shift flows into the euro as a lower-yield alternative.
Initial Jobless Claims: While often viewed weekly, the monthly average could reveal structural labor market resilience. A rising trend may weaken the dollar, reinforcing EUR gains as expectations for interest rate cuts grow.
6. Strategy Alignment by Trading Style
Each indicator offers unique insights depending on your approach to market participation:
Day Traders: Focus on the immediacy of daily indicators like Housing Starts, Consumer Sentiment, and Housing Price Index.
Swing Traders: Leverage weekly indicators like Crude Oil Prices and Continuing Claims to ride mid-term moves.
Position Traders: Watch longer-term data such as Industrial Production and M2 Velocity.
7. Risk Management
Currency futures provide access to high leverage and broad macro exposure. With that comes responsibility. Traders must actively manage position sizing, volatility exposure, and stop placement.
Economic indicators inform price movement probabilities—not certainties—making risk protocols just as essential as trade entries.
8. Conclusion
Euro FX Futures are shaped by a deep web of macroeconomic forces. From Consumer Sentiment and Oil Prices to Industrial Production and Money Velocity, each indicator tells part of the story behind Euro FX movement.
Thanks to machine learning, we’ve spotlighted the most impactful data across timeframes, offering traders a framework to align their approach with the heartbeat of the market.
As we continue the "Behind the Curtain" series, stay tuned for future editions uncovering the hidden economic forces behind other major futures markets.
When charting futures, the data provided could be delayed. Traders working with the ticker symbols discussed in this idea may prefer to use CME Group real-time data plan on TradingView: www.tradingview.com - This consideration is particularly important for shorter-term traders, whereas it may be less critical for those focused on longer-term trading strategies.
General Disclaimer:
The trade ideas presented herein are solely for illustrative purposes forming a part of a case study intended to demonstrate key principles in risk management within the context of the specific market scenarios discussed. These ideas are not to be interpreted as investment recommendations or financial advice. They do not endorse or promote any specific trading strategies, financial products, or services. The information provided is based on data believed to be reliable; however, its accuracy or completeness cannot be guaranteed. Trading in financial markets involves risks, including the potential loss of principal. Each individual should conduct their own research and consult with professional financial advisors before making any investment decisions. The author or publisher of this content bears no responsibility for any actions taken based on the information provided or for any resultant financial or other losses.
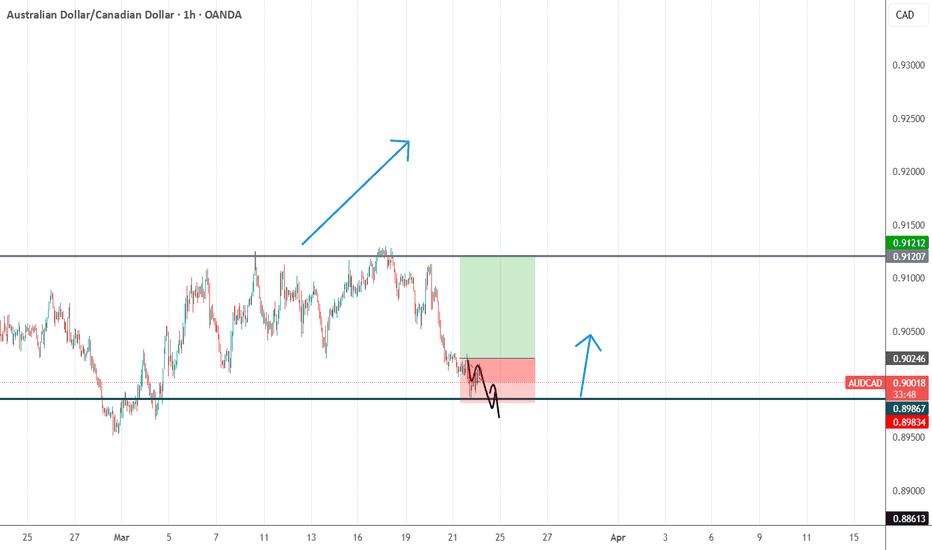
Buy audcadAUD/CAD Reversal Trade Setup: Key Levels to Watch
Market Overview
The AUD/CAD currency pair has shown a strong historical support level around 0.89867, where price has consistently bounced in previous weeks. This suggests a potential bullish reversal in the short term.
Trade Setup
Entry: Buy at 0.90246
Stop Loss (SL): 0.89867 (below key support level)
Take Profit (TP): 0.91212 (next major resistance level)
Analysis & Rationale
Technical Support Zone: The 0.89867 area has acted as a strong demand zone, reinforcing a possible price rebound.
Risk-to-Reward Ratio: This setup offers a favorable risk-to-reward ratio, ensuring optimal risk management.
Trend Confirmation: A confirmed bounce off support will provide further confidence in the bullish momentum.
Trading Plan & Execution
Wait for a clear bullish confirmation at 0.90246 before entering.
If price action aligns with expectations, gradually add positions on pullbacks while maintaining stop-loss discipline.
Close the trade at 0.91212 or trail stop to maximize gains if momentum remains strong.
This trade idea aligns with technical analysis principles, leveraging key support and resistance levels. However, always monitor market conditions, and adjust accordingly to maximize profitability.
📌 Risk Warning: Always use proper risk management strategies, and trade according to your personal risk tolerance.
USDJPY – Major Symmetrical Triangle Breakdown | Retest PlayUSDJPY has recently broken down from a large symmetrical triangle pattern visible on the 4H timeframe. After a prolonged uptrend that formed the triangle structure, price decisively broke below the lower support line, indicating a shift in momentum from bullish to bearish.
📊 Technical Breakdown
1. Symmetrical Triangle Breakdown
Price formed a classic symmetrical triangle pattern over several months.
A strong bearish breakout occurred from the lower trendline, signaling a potential reversal.
The projected measured move target from this breakdown points toward 141.526, representing a 6.5% decline.
2. Retest Zone
Price has pulled back to retest the broken triangle trendline from below.
This bearish retest setup is a textbook confirmation of resistance turning from previous support.
The current consolidation suggests the market is gathering liquidity before a potential next leg down.
3. Market Structure & Momentum
Lower highs and lower lows are now forming post-breakdown, confirming a bearish structure.
A clear rejection from the retest zone around the 151.500–152.000 level would further validate the short thesis.
🧠 Trade Idea
Entry Zone: On confirmation of rejection near the retest (~151.5 area)
Target : 141.526 (Measured move from triangle breakdown)
Stop Loss : Above the triangle high or above the recent swing (~153.00+)
Risk-Reward : High probability play based on pattern + structure shift
⚠️ Key Watch Levels
Resistance: 151.5–152.0 (triangle retest)
Support/Target: 141.5 (measured move)
Break above 153.0 will invalidate this bearish bias.
AUD/JPY Chart AnalysisAUD/JPY Chart Analysis
**Key Patterns Identified:**
1. **Rectangle Pattern (Range-bound Market)**
- The price traded within a horizontal range, forming a consolidation zone.
- Two clear support touches at the bottom of the range (labeled as Bottom 1 and Bottom 2).
- The price respected both support and resistance levels multiple times before breaking out.
2. **Double Bottom Formation**
- A classic reversal pattern, signaling potential bullish momentum.
- Bottom 1 and Bottom 2 indicate strong support, where buyers stepped in.
- The breakout above the rectangle confirms the pattern, suggesting further upside potential.
**Breakout Confirmation:**
- The price successfully **broke out** above the rectangle's resistance.
- Volume increased during the breakout, supporting bullish momentum.
- Moving Averages (EMA 7, 21, and 50) are aligned bullishly, confirming the uptrend.
**Target Projection:**
- The expected target is measured based on the rectangle’s height.
- The breakout suggests a potential move towards **97.00** as the next resistance zone.
**Key Levels to Watch:**
- **Support:** 94.50 (previous range support), 95.00 (psychological level).
- **Resistance:** 96.00 (current price zone), 97.00 (breakout target).
**Conclusion:**
- **Bullish Bias:** Price action and technical indicators favor more upside.
- **Watch for Retests:** A pullback to the breakout zone (around 95.00) could offer buying opportunities.
- **Risk Management:** If price re-enters the rectangle, the breakout may fail, requiring reassessment.
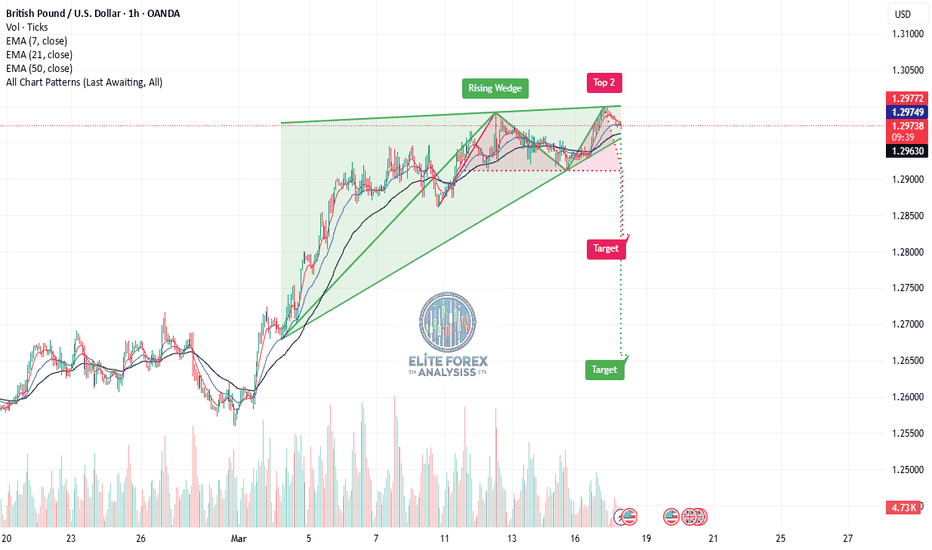
GBP/USD Chart Analysis: (1H Timeframe)**Chart Analysis: GBP/USD (1H Timeframe)**
**1. Chart Pattern - Rising Wedge 📉**
- The price has formed a **rising wedge**, a bearish reversal pattern.
- A rising wedge occurs when price makes higher highs and higher lows but within a narrowing range, suggesting weakening bullish momentum.
- The price has now broken out of the wedge, signaling a potential downward move.
**2. Key Levels & Targets 🎯**
- **Current Price:** Around **1.29720**
- **EMA Levels:**
- **7 EMA:** 1.29767 (Short-term trend indicator)
- **21 EMA:** 1.29748
- **50 EMA:** 1.29629 (More reliable trend indicator)
- **Bearish Breakdown Targets:**
- **First Target (Red Label):** Around **1.2800**, aligning with previous support levels.
- **Final Target (Green Label):** Around **1.2650**, suggesting a larger move downward if selling pressure continues.
**3. Confirmation of Downtrend? 🔻**
- The breakdown below the rising wedge suggests a potential **downtrend continuation**.
- The **break below 1.2900** would likely confirm a stronger bearish move.
- Volume is increasing on the move down, indicating strong selling interest.
*Possible Trade Setups 📊**
1. **Bearish Scenario:**
- A short position can be considered if price continues breaking below key EMAs and previous support.
- **Entry:** Below 1.2960
- **Stop Loss:** Above 1.3000
- **Take Profit:** 1.2800 (first target) or 1.2650 (final target).
2. **Bullish Reversal Possibility:**
- If price **reclaims the wedge** and breaks above 1.3000, it could invalidate the bearish pattern.
**Conclusion:**
- The **rising wedge breakdown** suggests bearish momentum.
- A move below **1.2900** would confirm further downside.
- **Watch for volume confirmation** before entering a trade.
Bearish thesis for GOLD for the weekend XAU had been on a steady Bullish Run , Rightfully so.
if any asset deserves to appreciate in its price while doing the most amount of Good, its GOLD
But we traders , look for technical opportunities
that's where this trade idea comes in.
- Gold is pressuring its recent range with limited bullish strength
- also its its most popular cross - USD gaining substantial momentum the last 2 Quarters can make room for a correction before the trend continues to the upside.
therefore falling back on pure technical calculations leads us back to our excel sheets for daily range projections which put our range to be exactly 1.03% or 3034 /303* pips depending your brokerage metrics.
which leads me to make this 1:4 Trade idea for this week.
cheers.
CADCHF; Heikin Ashi Trade IdeaOANDA:CADCHF
In this video, I’ll be sharing my analysis of CADCHF, using my unique Heikin Ashi strategy. I’ll walk you through the reasoning behind my trade setup and highlight key areas where I’m anticipating potential opportunities.
I’m always happy to receive any feedback.
Like, share and comment! ❤️
Thank you for watching my videos! 🙏


