Bitcoin & Altcoins: Technical Analysis and Market OutlookBitcoin (BTC) Analysis
Bitcoin is currently forming a short-term bullish pennant within a larger long-term pattern, projecting a potential target around $135K.
Key Levels: BTC is consolidating between the lower zone at $117.3K and the upper zone at $119.7K.
Breakout Potential: A break above this pattern could propel BTC toward a new all-time high (ATH), surpassing the current ATH at $123K.
Macro Events This Week:
Wednesday: The Federal Reserve will announce its interest rate decision, with no changes expected.
Wednesday: ADP Employment Report, providing insights into potential future rate cuts.
Friday: Non-Farm Payrolls (NFP) data release, which could further influence market sentiment.
Ethereum (ETH) Breakout
Ethereum has decisively broken through its 4-year historical resistance around $3,725, closing the week above this level. This breakout signals a strong bullish outlook for ETH, with potential for further upside.
Altcoin Highlights
BNB: Has shattered its previous all-time highs, showcasing significant bullish momentum.
XRP: Reached approximately $3.64, reflecting strong gains and market interest.
Market Context
The crypto market is showing robust activity, with altcoins following Bitcoin and Ethereum's lead. Key macroeconomic events this week could introduce volatility, so traders should stay vigilant.
Disclaimer: This is not financial advice. Every trader is responsible for their own strategy and risk management.
Happy trading and good profits! 🚀
G-money

Gold at a Crossroads: $100 Drop Ahead or New All-Time High?Gold is now sitting at a critical decision zone near the $3300 level — a key bank-level area. If we see a daily candle close below this level, I anticipate a minimum drop of 1,000 pips, with the first major support around the $3220–$3200 range. The $3200 level is extremely significant, and I’ll discuss its importance more in future updates if necessary.
On the flip side, if buyers step in and we get a daily close above $3300, I still believe it’s too early to jump into longs. The selling pressure remains quite obvious, and we’ve already seen multiple failed attempts to push beyond this level toward the $3500 all-time high. That tells me the orders at this level might be exhausted.
Personally, I’ll only consider a long position if we get at least a clean 4-hour candle close above $3350.
It’s going to be an exciting week ahead with high-impact data releases including ADP, Core PCE, the Federal Funds Rate — and most importantly, Friday’s NFP.
📌 Stay tuned for updates throughout the week!
Disclaimer: This is not financial advice. Just my personal opinion!!!

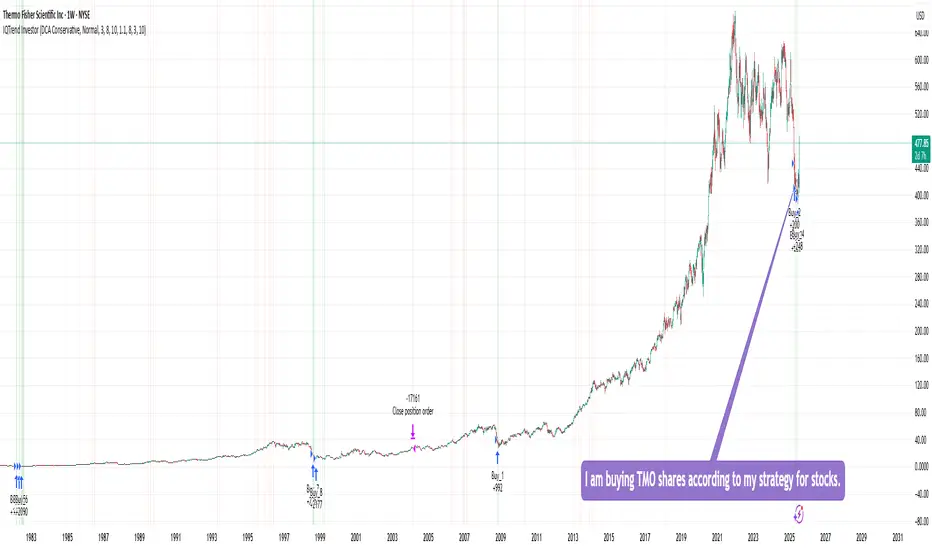
Buying TMO sharesI am buying TMO shares according to my strategy for stocks, ETFs, and precious metals.
This strategy shows 100% performance on this stock on a weekly timeframe. Therefore, I am investing a small percentage of my deposit in it and will wait for it to perform. I hope that everything will work out this time too :)
Of course, the price may go even lower, but I will buy more if the strategy shows a buy signal. In the long run, I think there will be an excellent profit.
DYOR
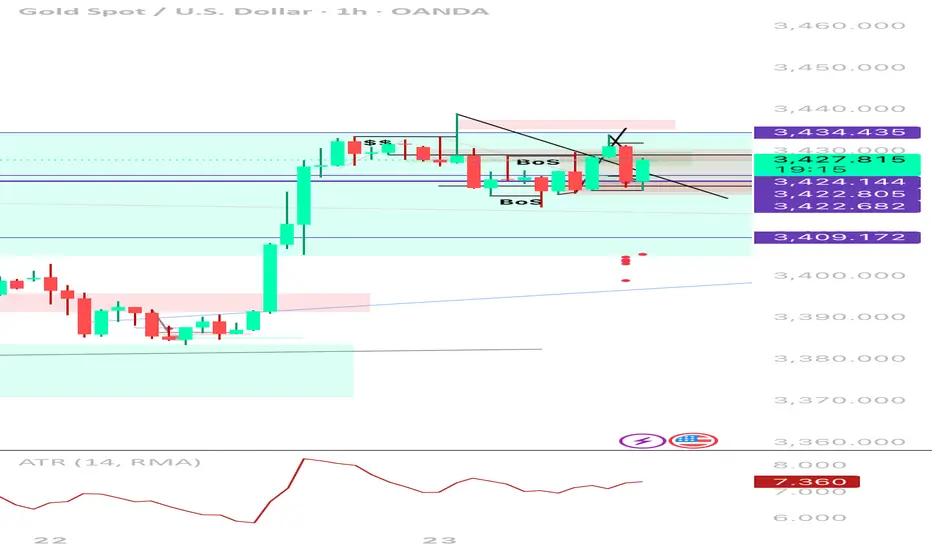
XAUUSD 1H | Sell TP Hit → Now Flipping Long After Liquidity SweeSmart Money Buy Setup | 1H Execution | Reversal from Demand Zone
Just hit full TP (396 pts) on a clean short from 3,434. Now flipping bias to long after price tapped into a key 4H OB and demand zone near 3,422. Price swept downside liquidity, mitigated the imbalance, and is now showing bullish intent.
⸻
🔄 Trade Narrative:
• ✅ Sell-side liquidity swept below previous HLs
• 🧱 Price tapped into 4H Order Block + FVG zone
• 💧 Internal liquidity vacuum filled (3,422–3,409)
• 🔁 Potential 1H BOS to the upside forming
• 🕯️ Bullish wick reaction from demand = early entry signal
• 📉 ATR low + building pressure = potential expansion incoming (likely NY)
Buy plan:
Entry Zone
3,422–3,424 (with confirmation on BOS)
Stop Loss
Below 3,409
TP1
3,434.435 (prior supply tap)
TP2
3,439.210 (range high)
TP3
3,455–3,460 (weekly extension target)
📌 Why I’m Flipping:
Price didn’t just reject randomly — it reacted exactly where smart money would’ve wanted to rebalance after the previous long impulse. This is the textbook scenario where you don’t marry a bias — just follow liquidity and structure.
🧠 Key Lessons:
• Don’t force continuation when the market is clearly absorbing
• Liquidity grabs often lead to strong reversals — watch BOS to confirm
• Same zone that gave you your TP? Can give you your next entry 💡
🔖 Tags:
#XAUUSD #SmartMoney #LiquiditySweep #OrderBlock #BreakOfStructure #BuySetup #PriceAction #1HChart #GoldTrading
XRP head to 7$XRP will make it the 2nd biggesst crypto in histiry surprassing Ethereum once ET Network is suffeering the biggest sells ever by traders.
Everyone on the other side is beting on Bitcoin, making it bigger but with room for others like XRP the best performing crypto in history.

BTC Smart money Bullish don’t be fooled !**BITCOIN MICROSTRUCTURE ANALYSIS: Institutional Accumulation Through Order Flow Divergence**
The current BTCUSD market structure presents a compelling case study in institutional accumulation mechanics, utilizing sophisticated order flow analysis to identify smart money positioning ahead of retail market participants.
**Technical Infrastructure Analysis**
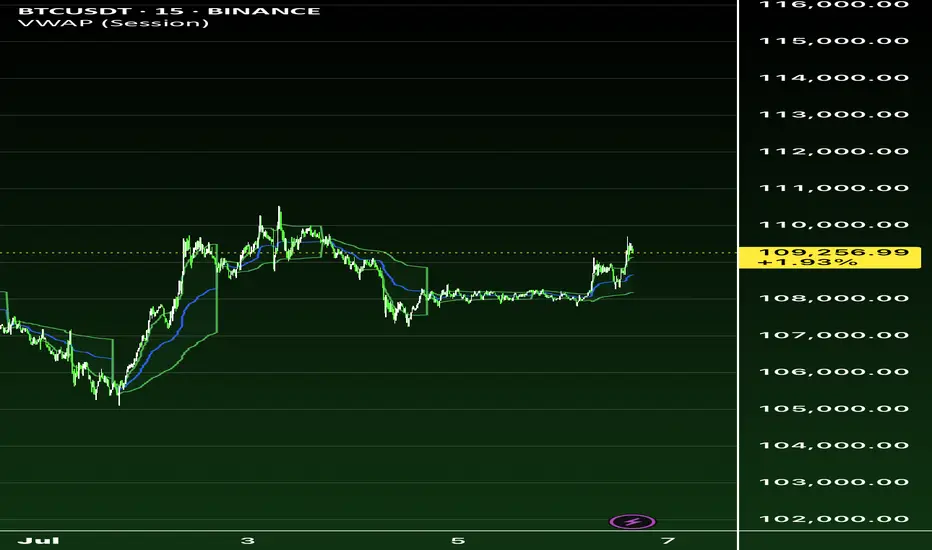
The convergence of multiple analytical frameworks reveals a coordinated accumulation pattern across various timeframes and exchanges. Volume Profile Analysis on the primary chart indicates substantial institutional interest between $108,000-$110,000, with the Point of Control (POC) establishing a robust foundation for directional bias determination.
**Order Flow Microstructure Dynamics**
The Bitfinex footprint data reveals critical microstructural imbalances that traditional technical analysis often overlooks. The current candle displays a **-4.52 delta** with price resilience at $109,480, indicating aggressive institutional absorption of retail selling pressure. This negative delta combined with price strength represents a classic **Wyckoff accumulation signature** - large participants are utilizing iceberg orders and hidden liquidity pools to build positions without triggering algorithmic momentum systems.
**Smart Money Positioning Mechanics**
Three key indicators confirm institutional accumulation:
1. **Cumulative Volume Delta (CVD) Divergence**: Both spot and perpetual markets showing negative CVD (-95.77K spot, -50.05K perp) while price maintains elevation, indicating off-exchange accumulation through dark pools and cross-trading networks.
1. **Open Interest Expansion**: The increase from 77.89K to 78.75K contracts with minimal funding rate pressure suggests fresh institutional capital rather than retail speculation.
1. **Volume Profile Concentration**: The heatmap reveals 105.85M in trading volume concentrated within the $108K-$110K range, representing systematic accumulation rather than random market activity.
**Institutional Arbitrage Mechanics**
The funding rate dynamics (0.001783 with periodic negative spikes to -0.000753) indicate sophisticated carry trade positioning. Institutions are likely utilizing the negative funding periods to establish leveraged long positions while simultaneously hedging through spot accumulation, creating a self-reinforcing feedback loop.
**Market Microstructure Implications**
This accumulation pattern typically precedes **Phase C markup** in Wyckoff methodology, where institutional players transition from absorption to active price discovery. The thin volume profile above $112,000 suggests minimal resistance once the breakout occurs, creating conditions for rapid price expansion toward the $113,600 target.
**Risk-Adjusted Positioning Strategy**
The confluence of volume profile analysis, order flow dynamics, and institutional positioning indicators supports a high-probability long bias with the following parameters:
- **Entry Zone**: $109,000-$109,200 (current accumulation range)
- **Risk Management**: Stop loss at $108,200 (below institutional POC)
- **Target Sequence**: $110,653 → $112,000 → $113,600
- **Confidence Level**: 90% (upgraded from initial 75% based on footprint confirmation)
**Forward-Looking Market Structure**
The sophisticated nature of this accumulation pattern suggests institutional preparation for a significant directional move. The combination of hidden liquidity absorption, funding rate arbitrage, and volume profile concentration creates optimal conditions for sustained upward momentum once the $110,000 psychological resistance is cleared.
This analysis exemplifies how advanced order flow techniques can provide substantial informational advantages over traditional technical analysis, particularly in identifying institutional positioning ahead of retail market recognition.
*Position sizing should remain within 3-5% of total portfolio allocation, with dynamic risk management protocols adjusted based on evolving market microstructure conditions.*
CULT DAO ON ITS WAY TO A BILLION DOLLAR MARKET CAPIf you want an in-depth look at everything CULT DAO, check out the TA below:
This is just a technical update.
A massive breakout occurred as expected. I’ve been highlighting the divergence forming in the MACD for months — it’s all detailed in the TA above.
Over the last 1,096 days, CULT DAO has formed a giant descending wedge — both in price structure and on the MACD. The path was clear.
Onwards and upwards.
A billion-dollar market cap is very possible by Q4 2025.
Breakthrough tech.
Mainnet launch around the corner.
Rocket ship loading.

Internal and external liquidity Here's another mechanical lesson for you.
In my last post I covered a mechanical technique to identify swing ranges. Rule-based, simple and repeatable.
In this post, I want to share another little technique, again part of the mechanical series. But this time I want to talk about liquidity.
Most traders talk about liquidity, they might even have a grasp of what it is. But most do not know how liquidity forms the sentiment and how that creates a type of algo for the market.
You might have heard of Elliott wave theory. There is a saying along the lines of "you ask 10 Elliott traders for their count and you get 11 answers".
But the point is here, when you simplify the concept, it's clear to see that sentiment caused by liquidity swings is what causes a repeatable pattern in the market.
Let's take the idea of the ranges from my last post.
Now after a fair amount of accumulation, this level becomes "defended" - the price will gradually move up until old short stop losses are tagged and new long entries are entered into.
This allows the institutional players to open up their orders without setting off the alarm bells.
Price then comes back from external liquidity to find internal liquidity (more on this in a later post).
But then it looks for the next fresh highs.
As the highs are put in, we can use the range technique to move our range to the new area as seen in the image above.
Next we will be looking for an internal move, not just internal to the range, but a fractal move on the smaller timeframe that drives the pullback down. See this in blue.
The logic here is simple; on the smaller timeframes we have witnessed an accumulation at the 2 region and as we spike up for 3; we will witness a distribution on the smaller timeframes.
Wyckoff called this the accumulation, followed by a mark-up and then the distribution and a mark-down.
It is this pattern, over and over again that leads to this type of structure.
This will then be re-branded by various analysts who will call it things like a head and shoulders, smart money will see a change of character and a retest before breaking the structure.
This is all the same thing - just a different naming convention.
Again, I hope this helps some of you out there!
Disclaimer
This idea does not constitute as financial advice. It is for educational purposes only, our principal trader has over 25 years' experience in stocks, ETF's, and Forex. Hence each trade setup might have different hold times, entry or exit conditions, and will vary from the post/idea shared here. You can use the information from this post to make your own trading plan for the instrument discussed. Trading carries a risk; a high percentage of retail traders lose money. Please keep this in mind when entering any trade. Stay safe.

$XAU Showing Bearish Flag Pattearn & Dropped $3K Support area...TVC:XAU Showing Bearish Flag Pattearn & Dropped $3K Support area. Price dropping now and back to $3K price level area. price FVG touch and Strong support $3K Price Level area. Here is many support Holder.
Stoploss: $3,536
Entry: $3,377
1st Target point $3,377
2nd Target point $3,249
3rd Target point $3,028
Disclaimer: This article is for informational purposes only and does not constitute financial advice. Always conduct your own research before making any investment decisions. Digital asset prices are subject to high market risk and price volatility. The value of your investment may go down or up, and you may not get back the amount invested. You are solely responsible for your investment decisions and Binance is not available for any losses you may incur. Past performance is not a reliable predictor of future performance. You should only invest in products you are familiar with and where you understand the risks. You should carefully consider your investment experience, financial situation, investment objectives and risk tolerance and consult an independent financial adviser prior to making any investment.

Argentina Money Supply Reduced Along With InflationWe once again see that MMT ("Modern" Monetary Theory) is 100% wrong. Milton Friedman wins again.
"Inflation is always and everywhere a monetary phenomenon."
Don't let modern economic hacks fool you.

Global M2 Money SupplyWith more money than ever before in circulation available. Asset prices should go up..
Do you agree or disagree?

Why Gold and Not Forex Pairs?The truth behind XAUUSD’s sniper potential.
— by GoldFxMinds
Let’s get real. If you’ve ever asked:
“Why does everyone trade Gold? Why not EURUSD, GU, or NAS?”
Here’s the straight answer from a sniper’s perspective 👇
🔑 1. Structure Never Lies on Gold
Gold respects pure price action like no other pair.
Break of Structure, CHoCH, FVG, OB, liquidity sweeps — they hit perfectly. No fake noise, just clean technicals.
📌 Gold tells the truth. The question is: Can you read it?
🚀 2. Massive Intraday Range
XAUUSD can move 200–500 pips in a single session
EURUSD? You’re lucky with 80–100 pips.
More volatility = more sniper opportunities.
But only for those with discipline and a plan.
🌍 3. Gold Reacts to the Real World
Unlike other pairs that follow interest rates or risk sentiment, Gold responds directly to fear, war, and uncertainty.
War in the Middle East? Gold pumps.
Fed chaos? Gold spikes.
Unemployment shock? Gold shifts.
It’s a true macro indicator — a safe haven in times of global panic.
Master the macro + structure, and you’ll never be lost.
🔁 4. Repeating Liquidity Patterns
Gold runs on liquidity traps, sweep-and-reverse setups, and smart money moves.
Once you master its rhythm, it becomes a game of patience — not guessing.
🧠 5. Sniper Logic Wins, Not Indicators
Most pairs need heavy indicator confluence.
Gold?
Just structure, liquidity, OBs, and confirmation.
Clean. Precise. Tactical.
🔥 6. It’s a Mirror of Your Mindset
Gold punishes greed. Gold exposes hesitation.
It will show you exactly what you lack as a trader.
If you respect the chart and your rules — it will reward you.
If not, it humbles you instantly.
💛 So Why Gold?
Because it’s the only chart that gives you truth if you learn to read it.
Not noise. Not manipulation.
Just structure, liquidity, and opportunity.
Trade it right — and Gold will reward you with clarity.
📍 Follow GoldFxMinds if you’re tired of guessing
and ready to learn how to read price like a sniper.
💬 Drop a comment:
Why did you choose Gold?
Let’s build this community with logic, not hype.
— GoldFxMinds 🔥

Tatasteel on the MoveTatasteel NSE:TATASTEEL on the Move. You can make a safe Target for 160 and exit.

AUDCHF Take Profit. Yes, once again we caught the right trade with the right analysis, and this marks our second TP of the day — closing the day in profit.
If you like my trades, feel free to follow me.
🔔 I post detailed trade ideas and daily market analysis like this every day on my TradingView profile.
👉 Follow me to get notified and read the full breakdowns.

DXY SINGLING DANGER!Any Time The Dollar Gets In This Range Bad Things Happen!
With the exception of the 2008 GFC which confirmed we have entered Debt Deflation (Meaning the Gov will need to borrow more and more, faster and faster without any benefit to the real economy). A strong dollar is signaling something very bad is coming.
Gun to head I would guess something like an Asian Currency Crisis. Russian ruble & economic collapse is now a certainty! Russia has lost the war no matter what they are trying to do on the battlefield it is irrelevant as the economy is now suffering from Dutch Disease. (So Much for the BRICS fantasy!)
Most Americans believe a strong dollar is good. They are wrong. Here are a few things to know about a strong US Dollar.
1. A strong dollar weakens exports, costing American jobs as everything America made becomes more expensive to the rest of the world.
2. US Imports increase as everything internationally made becomes cheaper.
3. Acquiring USD as foreign reserves becomes much more difficult and expensive. As exporters to the US have to produce more for less $s.
4. US investment in international currency collapses, forcing inflation, rates higher making borrowing/investment in foreign economies weaker. Leading to a snowball effect.
5. Commodities are traded in USD. As such energy/food to many poor nations will become a problem as they are net importers with already limited access to NYSE:S it will be magnified.
6. Finally (I could go on but I won't you get the point) when everyone leans on one side of the boat it capsizes. Meaning when everyone is running to invest in the US & the dollar.
Techanically how high can the USD go?
-120 is likely. (hopefully not much more)
-Longer term if things get bad enough it can break all-time highs of 165 as we have this massive bottoming inverse HEAD & SHOULDERS in place. CARNAGE!
- What I hope will happen is that it hits previous recent highs of 115 and that will be it for the upside. HOWEVER!
We do have a rising structure that needs to be corrected. As such when it does correct there is a good possibility it tests previous lows.
For now, if you live in the US. enjoy dollar strength and think about how much worse inflation would have been if the $ was weakening. ))

'Inflation is transitory' by FEDFED did that. And it was not elaborate lie. They made money on it. What is next ?

USDCADLooking Ahead: USD/CAD Forecast for the Coming Years
When analyzing the future outlook of USD/CAD over the next few years, several key factors come into play, including economic policies, commodity prices, and overall market sentiment.

Is the ZIP DIP OVER? Is it a suitable time to Buy?Is the Base solid enough to drive the price to 3 OR will it require a manipulation below the base to test key support "2"?
THIS IS ONLY AN IDEA AND COULD BE RIGHT...
For the Fundamental lovers:
Also keep in mind:
Dow Jones Newswires:
"Zip Price Target Raised 5.9% to A$3.60/Share by Ord Minnett"

Bitcoin’s Secret Path to $1 MILLION – Sooner Than Anyone Thinks🚨 **BREAKING: Bitcoin’s Secret Path to $1 MILLION – Sooner Than Anyone Thinks!** 🚨
Everyone is watching **Bitcoin flirt with $100K**, but what if I told you the **real target isn’t $150K or $250K**… it’s **$1 MILLION**, and it’s happening WAY faster than expected? 📈💰
Here’s what no one is talking about:
🔥 **The “Liquidity Black Hole” Effect** – The more institutions buy, the less Bitcoin is left for retail. Soon, the supply will be so scarce that prices will skyrocket overnight.
🔥 **Hyper-Bitcoinization Is Coming** – Governments and banks are running out of time. When even nations start adding BTC to their balance sheets, fiat currencies will collapse, and BTC will become the global reserve asset.
🔥 **Post-Halving Supply Shock** – The 2024 halving will be the **most extreme in history** because **over 70% of Bitcoin is already locked up** by long-term holders. When demand spikes, price discovery will break records.
🔥 **Retail FOMO Hasn’t Even Started** – The 2017 and 2021 bull runs were fueled by regular investors jumping in late. **The next wave will be 10X bigger, pushing BTC to levels no one thought possible.**
The world is sleeping on the biggest financial shift in history. **Bitcoin isn’t just going to $100K—it’s on a path to $1 MILLION.** If you wait too long, you’ll be buying at prices that seem impossible today. 🚀🔥
#Bitcoin1Million #BTCShockwave #CryptoTakeover #HyperBitcoinization #TheFutureIsNow


USDJPY - SHORT - 02/02/25On the daily timeframe, USDJPY is still on a retracement. This idea is based off of looking to continue with this trend and reach the daily tf FVG marked.
On the 30min, price has been reaching higher towards a 30min Order Block. This order block meets the criteria: 1.Swept Liquidity 2. Break of Structure 3. Prescence of Structural Liquidity.
The target being the previous structural low, with hopes of price continuing further down.

ETH – What Happened? A Detailed Breakdown and What to do next!Crypto Panic or Manipulation? Breaking Down Ethereum’s Crash and the Entire Market
🔥 Hello everyone, this is Ronin!
The last two trading days have seen one of the biggest crashes in the history of the cryptocurrency market. 📉 We witnessed a massive wave of liquidations that burned through the capital of many traders.
Looking at the numbers:
Most assets lost 10–30% of their value.
Some altcoins dropped by 50%.
The total crypto market capitalization shrank by more than 10% in just a few days.
But the biggest victim of this crash was not Bitcoin, nor low-cap altcoins—it was Ethereum (ETH) itself.
What Happened to Ethereum? Why Did It Drop from $3600 to $2000?
If we talk about the strangest asset in this cycle, Ethereum stands out.
While other coins were breaking all-time highs, ETH didn’t even come close to its peak valuation. This is despite:
The launch of Bitcoin ETFs, bringing in a wave of institutional capital.
News that Donald Trump was reportedly buying ETH for his projects.
Growing interest in L2 scaling solutions and Ethereum network upgrades.
None of these bullish catalysts helped ETH break even $4000.
And then, within just four days, Ethereum plunged from $3600 to $2000. On Binance’s futures market, the price briefly hit $2080.
❓ Has Ethereum ever seen such a sharp drop before?
Personally, I don’t remember such a massive drop happening in such a short time without catastrophic fundamental events.
This wasn’t a network hack, a mining ban, or a major DeFi collapse—nothing fundamentally bad happened.
So who crashed the market, and why?
Who Benefited from This Crash?
Let’s analyze the key question: who had the most to gain from this crash?
The obvious answer is that the biggest winners were major crypto exchanges and market makers.
Why Didn’t Bitcoin Drop as Much?
At the time of the crash:
📌 Bitcoin’s liquidation zones were nearly empty. Many traders had both buy and sell orders in place, so there was no strong incentive to push BTC down.
What About Ethereum?
📉 ETH futures open interest exceeded tens of billions of dollars.
📉 Leverage was heavily skewed towards long positions, meaning liquidations brought massive profits to exchanges.
📉 ETH’s open interest was even higher than BTC’s, making it a prime target for manipulation.
How Crypto Exchanges Made $2 Billion in One Night
The cryptocurrency market is unique because the major players not only provide liquidity but also profit from liquidations.
💰 Crypto exchanges are not just trading platforms—they are global market makers who actively move prices.
📌 On Sunday night, the following happened:
Big players spotted an overloaded leverage in ETH long positions.
They triggered a wave of sell-offs, forcing liquidations.
On Binance alone, exchanges raked in $2 billion in a single day from liquidations.
⚠ Ask yourself this: if you had the power to make $2 billion in a single day, wouldn’t you do it?
Of course, they want to and they do.
How the Smart Money Strategy Works
If you’ve heard of Smart Money trading strategies, you know that big players always think ahead.
📌 The classic scheme:
1️⃣ Pump the market up—give traders confidence that the rally will continue.
2️⃣ Open short positions in zones overloaded with leverage.
3️⃣ Dump the market sharply, triggering stop losses and liquidations.
4️⃣ Buy back at the bottom, raking in billions.
📉 This is exactly what happened with Ethereum—exchanges used a false news narrative about trade sanctions to tank the price.
How I Survived This Crash
🔥 I was long on Ethereum with leverage and held a total position of over 200 ETH.
Honestly, that night was brutal.
📌 When the price dropped to $2080, I had two options:
❌ Panic and close the position, taking a six-figure loss.
✅ Hold and wait for a recovery, because I knew this was a fake move.
I chose the latter. Not only that—I added to my position at the lower levels.
This doesn’t mean the market can’t drop further, but…
📌 Trading rule: Buy when everyone is selling—Sell when everyone is buying.
📌 Right now, the market is in panic mode—which means some smart players are accumulating ETH at these prices.
Conclusion: What Comes Next?
📌 This was an artificial correction—big players intentionally crashed the market.
📌 The coming days should see a recovery, especially if trading volumes start picking up again.
📌 Market psychology is the key factor. When everyone is afraid, that’s when big players accumulate assets.
If you’re interested in how I will navigate my $200,000 ETH drawdown, follow me on TradingView—I’ll be posting regular updates.
🚀 In upcoming articles, we’ll break down the analysis of other altcoins and provide a microeconomic perspective on the most promising assets.
💬 Boost this post if you found it insightful—your engagement helps, and a little positive activity never hurts!
This was Ronin—stay tuned for more updates! Big things are coming. 🎯

GBPTRY long biasHey guys.
I just found a demand pcp on gbptry D1.
Most likely price would test it and it will remain valid unless we don't get another demand level.
Destination is top supply area.
Stick with it 👍
