#GALA/USDT#GALA
The price is moving within an ascending channel on the 1-hour frame, adhering well to it, and is poised to break it strongly upwards and retest it.
We have support from the lower boundary of the ascending channel, at 0.1640.
We have a downtrend on the RSI indicator that is about to break and retest, supporting the upward move.
There is a key support area (in green) at 0.01580, which represents a strong basis for the upward move.
Don't forget one simple thing: ease and capital.
When you reach the first target, save some money and then change your stop-loss order to an entry order.
For inquiries, please leave a comment.
We have a trend of stability above the Moving Average 100.
Entry price: 0.01780
First target: 0.01800
Second target: 0.01886
Third target: 0.01952
Don't forget one simple thing: ease and capital.
When you reach the first target, save some money and then change your stop-loss order to an entry order.
For inquiries, please leave a comment.
Thank you.
Galausdtbuy

#GALA/USDT Gala bull run possible ?#GALA
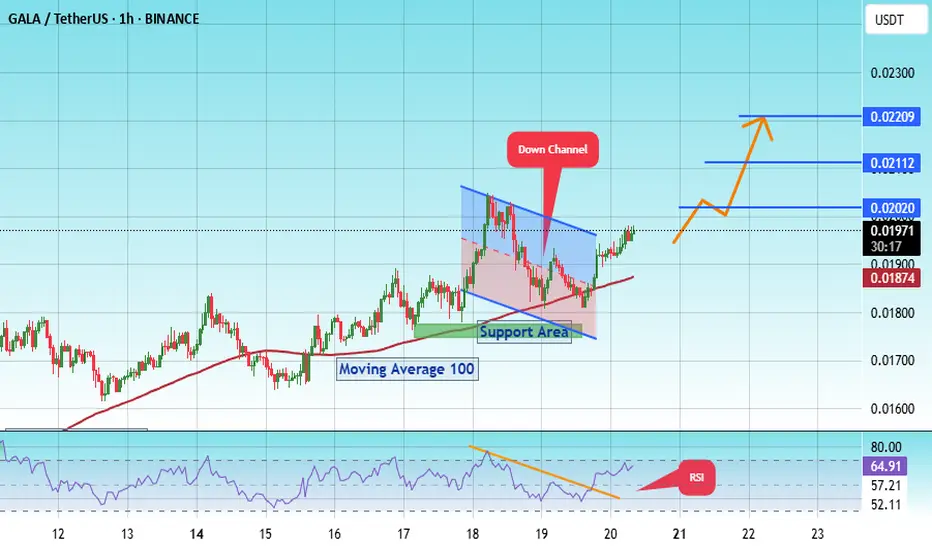
The price is moving within a descending channel on the 1-hour frame, adhering well to it, and is on its way to breaking strongly upwards and retesting it.
We have support from the lower boundary of the descending channel at 0.01750.
We have a downtrend on the RSI indicator that is about to be broken and retested, supporting the upside.
There is a major support area in green at 0.01770, which represents a strong basis for the upside.
Don't forget a simple thing: ease and capital.
When you reach the first target, save some money and then change your stop-loss order to an entry order.
For inquiries, please leave a comment.
We have a trend to hold above the 100 Moving Average.
Entry price: 0.01975
First target: 0.02020
Second target: 0.02112
Third target: 0.02210
Don't forget a simple thing: ease and capital.
When you reach the first target, save some money and then change your stop-loss order to an entry order.
For inquiries, please leave a comment.
Thank you.
#GALA/USDT Gala bull run possible ?#GALA
The price is moving within a descending channel on the 1-hour frame, adhering well to it, and is poised to break it strongly upwards and retest it.
We have a bounce from the lower boundary of the descending channel. This support is at 0.01630.
We have a downtrend on the RSI indicator that is about to break and retest, supporting the upside.
There is a key support area (in green) at 0.01590, which represents a strong basis for the upside.
Don't forget one simple thing: ease and capital.
When you reach the first target, save some money and then change your stop-loss order to an entry order.
For inquiries, please leave a comment.
We have a trend of stability above the Moving Average 100.
Entry price: 0.01711
First target: 0.01763
Second target: 0.01812
Third target: 0.01874
Don't forget one simple thing: ease and capital.
When you reach the first target, save some money and then change your stop-loss order to an entry order.
For inquiries, please leave a comment.
Thank you.

#GALA/USDT#GALA
The price is moving within a descending channel on the 1-hour frame, adhering well to it, and is poised to break it strongly upwards and retest it.
We have a bounce from the lower boundary of the descending channel. This support is at 0.01340.
We have a downtrend on the RSI indicator that is about to break and retest, supporting the upward trend.
There is a key support area in green at 0.01320, which represents a strong basis for the upward trend.
Don't forget one simple thing: ease and capital.
When you reach the first target, save some money and then change your stop-loss order to an entry order.
For inquiries, please leave a comment.
We have a trend of stability above the Moving Average 100.
Entry price: 0.01430
First target: 0.01465
Second target: 0.01500
Third target: 0.01533
Don't forget one simple thing: ease and capital.
When you reach the first target, save some money and then change your stop-loss order to an entry order.
For inquiries, please leave a comment.
Thank you.

GALA/USDT | Testing Critical Historical Support – Rebound?🧠 Full & Professional Analysis:
GALA/USDT is currently sitting at a critical inflection point on the weekly timeframe. The price has returned to a major historical demand zone between $0.01200 – $0.01400, which has served as a strong support base for over a year.
This level has repeatedly acted as a launchpad for rallies since early 2023, making it a high-interest area for long-term investors and swing traders.
🔍 Key Technical Structure & Zones:
🟨 Major Weekly Support Zone:
$0.01200 – $0.01400 → A historically proven demand zone that has held multiple times. A stronghold for buyers, and a potential accumulation base.
🟦 Layered Resistance Zones (If Rebound Occurs):
$0.02176 → First minor resistance; initial confirmation of a bullish reversal.
$0.03432 → Mid-range resistance within current consolidation.
$0.06044 → Key breakout level to shift trend structure.
$0.11093 – $0.18485 → Medium-term targets if bullish momentum builds.
$0.26464 to $0.72473 → Historical distribution zones if full recovery unfolds.
🟥 Bearish Risk Zone (Breakdown Scenario):
Break below $0.01200 opens downside risk toward the all-time low at $0.00571, or even lower if sentiment worsens.
✅ Bullish Scenario:
If the $0.01200–$0.01400 support holds:
1. A bullish engulfing candle on the weekly chart could be an early reversal signal.
2. Potential formation of a double bottom in this demand zone (yet to be confirmed).
3. Initial target at $0.02176, with possible extension toward $0.06044—a major pivot zone.
4. Sustained buying and volume confirmation could push GALA toward $0.110 – $0.184 in the mid-term.
❌ Bearish Scenario:
If the price fails to hold above $0.01200:
1. A breakdown may trigger a capitulation move to the $0.00700 – $0.00571 range (historical lows).
2. This would invalidate the current sideways base structure and extend the downtrend.
3. Lack of buying interest could open the door to deeper losses.
📐 Pattern & Technical Context:
Accumulation Base Formation: Still possible if support holds and buyers step in.
Tight Range Compression: Price is coiling at the bottom, indicating a potential breakout move soon.
No major reversal patterns confirmed yet, such as Inverse H&S or W-bottom, but structure suggests accumulation pressure.
🧭 Summary:
> GALA is dancing on the edge of a crucial support level. The price action in this zone will likely determine the next major direction. A bounce could ignite a multi-week rally, while a breakdown may send the asset to new lows. Volume and weekly close will be key confirmation points.
📊 Recommendations:
Swing Traders: Watch for bullish candle patterns and breakout above $0.02176.
Long-Term Investors: Consider conservative accumulation in the support zone with clear risk management.
Bearish Traders: Wait for confirmed weekly close below $0.012 before considering short setups.
#GALA #GALAUSDT #CryptoTA #AltcoinAnalysis #WeeklyChart #BullishSetup #BearishScenario #TechnicalAnalysis #AccumulationZone #BreakoutWatch

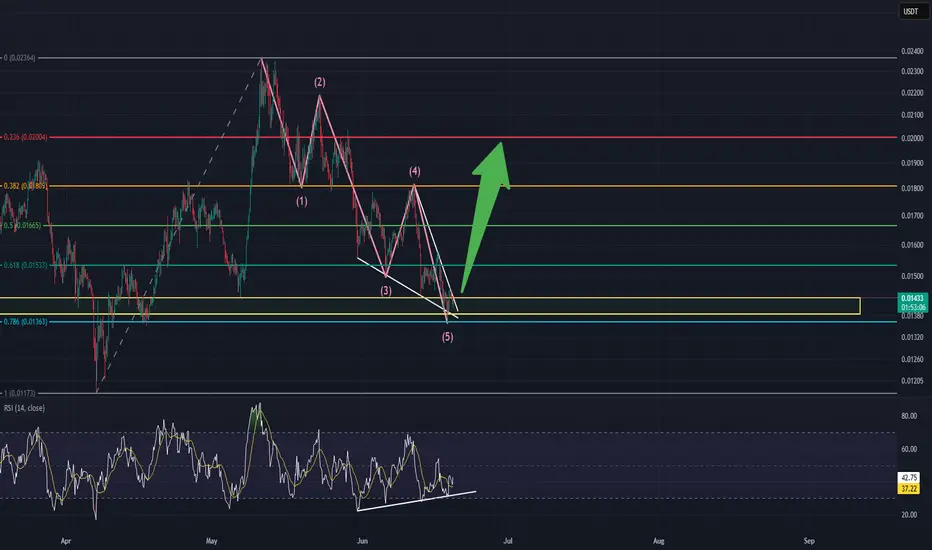
GALA/USDT - 4HR TIME FRAME - BULLISH!!This chart illustrates a bullish reversal setup using Elliott Wave Theory, Fibonacci retracement levels, and RSI divergence. Here's a detailed breakdown:
📉 Elliott Wave Count:
The chart shows a complete 5-wave impulse down labeled (1) to (5), suggesting a potential end of a bearish trend.
Wave (5) appears to have just completed, indicating a possible reversal point.
🔍 Falling Wedge Pattern:
A falling wedge is visible between waves (4) and (5), which is typically a bullish reversal pattern.
Price is near the wedge’s apex, hinting at an imminent breakout.
🟡 Strong Demand Zone:
Price is currently inside a yellow demand zone (roughly $0.0136 to $0.0144).
This zone coincides with the 0.786 Fibonacci retracement level at $0.01363, a common reversal level.
📊 RSI Indicator:
The RSI at the bottom shows a bullish divergence:
Price made a lower low, while RSI made a higher low.
This signals weakening bearish momentum and potential upside ahead.
🧠 Summary:
This is a technically sound bullish setup, suggesting a bottoming structure and an upcoming uptrend. The confluence of Elliott Wave completion, wedge breakout, RSI divergence, and Fibonacci support all point to a strong reversal probability.
GALAUSDT 1W AnalysisGALA ~ 1W Analysis
#GALA Buy at support block if you still have confidence in this coin with a short term target of at least 20%+ from here.

GALAUSDT 1D AnalysisGALA ~ 1D Analysis
#GALA Buy back on retest of this support block with short term target of at least 15%+ from here.

#GALA/USDT#GALA
The price is moving within a descending channel on the 1-hour frame and is expected to break and continue upward.
We have a trend to stabilize above the 100 moving average once again.
We have a downtrend on the RSI indicator, which supports the upward move by breaking it upward.
We have a support area at the lower limit of the channel at 0.01940, acting as strong support from which the price can rebound.
Entry price: 0.02042
First target: 0.02101
Second target: 0.02193
Third target: 0.02300

#GALA/USDT#GALA
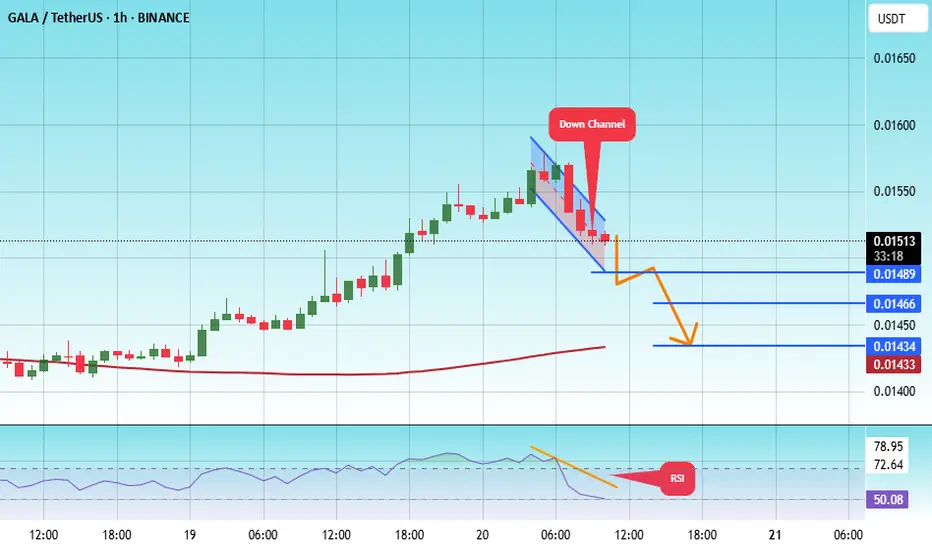
The price is moving within a descending channel on the 1-hour frame, adhering well to it, and is on track to break down strongly and retest it.
We are seeing a bounce from the upper boundary of the descending channel. This support is at 0.01533.
We have a downtrend on the RSI indicator that is about to break and retest, which supports the decline.
We are looking to stabilize above the 100 moving average, but the price is on track to touch it first.
Entry price: 0.01516
First target: 0.01489
Second target: 0.01466
Third target: 0.01434
GALAUSDT 1D AnalysisGALA ~ 1D Analysis
#GALA Buy after successfully penetrating this resistant line with a short -term target of at least 10%+ from here.

GALAUSDT 1WGALA ~ 1W Analysis
#GALA Buy gradually from here if you still have a Conviction on this coin with a short -term target of at least 20%+.

GALAUSDT 1WGALA ~ 1W Analysis
#GALA This is the lowest support for now. Buy from here if you still have a Conviction on this coin. with a short -term target of at least 20%+.

GALAUSDT 1WGALA ~ 1W Analysis
#GALA Buy gradually from here if you still have a Conviction on this Coin with a minimum target of 20%+.

#GALA/USDT Ready to go higher#GALA
The price is moving in a descending channel on the 1-hour frame and sticking to it well
We have a bounce from the lower limit of the descending channel, this support is at 0.03330
We have a downtrend on the RSI indicator that is about to be broken, which supports the rise
We have a trend to stabilize above the moving average 100
Entry price 0.03500
First target 0.03597
Second target 0.03778
Third target 0.03986

GALAUSDT 5DGALA Update ~ 5D
#GALA If you still have Conviction on this coin,. Buy gradually within this support block,. with a short term target of at least 20%++

GALAUSDTGALA ~ 1W
INDEX:GALA This is the support block that has been holding the price from falling lower.
If you still have Conviction on this coin. do the buying in stages here. With a minimum target of 20%++. This is a very good buy with lower risk

#GALA/USDT#GALA
The price is moving within a descending channel pattern on the 1-hour frame and is expected to rise after it has been largely committed to it
We have a downtrend on the RSI indicator that is expected to break upwards and we have a tendency to stabilize above it
We have a major support level in green at a price of 0.01800
We have a tendency to stabilize above the moving average 100
Entry price 0.01850
First target 0.01955
Second target 0.02060
Third target 0.02176

#GALA/USDT#GALA
The price is moving below a downtrend on a 1-hour frame, and the trend is being tested now and is about to break to the upside.
We have a bounce from the green support area at 0.001900
We have a tendency to stabilize above the Moving Average 100
We have a downtrend on the RSI indicator that is about to break higher and supports the rise
Entry price is 0.02000
The first target is 0.02370
The second target is 0.02600
The third goal is 0.02870

GALA: pollback📊Analysis by AhmadArz:
🔍Entry: 0.04496
🛑Stop Loss: 0.04286
🎯Take Profit: 0.04741 - 0.05022
🔗"Uncover new opportunities in the world of cryptocurrencies with AhmadArz.
💡Join us on TradingView and expand your investment knowledge with our five years of experience in financial markets."
🚀Please boost and💬 comment to share your thoughts with us!

#GALA/USDT LONG#GALA
The price has been moving in a bear flag since April 2022
It was a lot of events on this pair
It has achieved nearly 2x in the last two months
The downtrend is expected to break through to turn the trend to the upside with the breaking of the Moving Africa 100 upwards.
Current Price0.03195
First Goal 0.04940
Second Goal 0.06419

#GALAUSDT LONG#GALA
The price has been moving in a downward channel since June 2023
This descending channel was broken upward
It is expected that the price will continue to rise with the support of Moving Average 100
The current price is 0.02625
The first target is 0.02830
The second target is 0.4770
The third goal is 0.06279

🚨#GALA/USDT Long#GALA
The price is moving in a descending channel on the 12-hour frame
Now it is about to break that channel upward after testing the downtrend of the channel
We have buying momentum on the MACD indicator
Entry price is 0.02287
The first target is 0.02424
The second goal is 0.02689
The third goal is 0.02965
