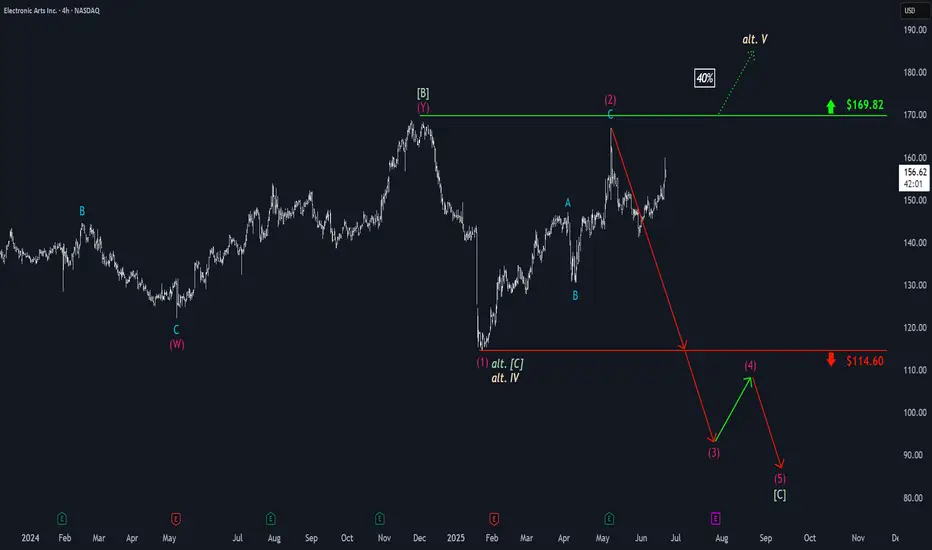
Electronic Arts: Upward Momentum PersistsDespite notable bearish attempts, upward momentum in Electronic Arts has remained strong, once again pushing price toward resistance at $169.82. If the stock breaks above this level, this will suggest that the major correction concluded with the low of beige wave alt.IV at $114.60, and that a sustainable rally as part of wave alt. V is now underway. However, in our primary scenario, we still see EA in a downward impulse, which is expected to eventually break below support at $114.60.
📈 Over 190 precise analyses, clear entry points, and defined Target Zones - that's what we do (for more: look to the right).
Gaming

ARTY - The Undervalued Gaming Rocket?While most eyes are on memecoins and major Layer-1s, a sleeping giant may be gearing up in the GameFi sector — and this time, it’s powered by real innovation and user growth.
🎮 Fundamental Boost
Artyfact has just launched its long-awaited Play-and-Earn mode — the first of its kind. This new feature is expected to onboard hundreds of thousands of gamers into the ecosystem. And here’s the catch: players can only purchase gaming NFTs using KUCOIN:ARTYUSDT . This shift not only introduces a fresh wave of demand but also builds real token utility — the kind most GameFi tokens lack.
💼Additionally, recent sell pressure from early investors has now faded. Those who had been staking ARTY for three years have finally taken their profits. With that wave of selling behind us, the token now has room to breathe — and potentially fly.
And yes, I bought ARTY myself — not financial advice, but I’m personally betting on its next big move.
📊 Technical Analysis
AMEX:ARTY has been trading within a bullish ascending triangle, forming higher lows and maintaining strong support around the $0.13 level. Each time it tapped this zone, it triggered strong impulse moves — one up 88%, another over 100%.
Right now, ARTY is back at that exact support level, with a third impulse wave potentially brewing. A bounce from here could send it back toward the upper trendline near $0.30 — our first target.
If that breaks, the next resistance sits around the $0.70 zone, a previous structural high and psychological round number. And if the gaming adoption kicks in as expected, we could be heading toward a macro bull market target of $1+, which would represent a multi-X move from here.
📈 3 Bullish Targets for AMEX:ARTY
$0.30 — top of ascending triangle
$0.70 — structural resistance from prior impulse
$1.00+ — psychological milestone backed by new NFT demand and adoption
📍 Why ARTY?
Artyfact is not just another GameFi project — it’s building a functional gaming economy where NFTs have real use, and where the token is required for participation. In a sea of hype-driven tokens, ARTY stands out by actually shipping product and onboarding users.
With the new Play-and-Earn mode gaining traction, a solid technical base forming, and sell pressure behind us, ARTY could be setting up for its biggest run yet.
➡️ As always, make sure to do your own research and only invest in what you truly believe in.
🎯 Stick to your trading plan — entry, risk, and execution.
Good luck!
All strategies are good, if managed properly.
~ Richard Nasr

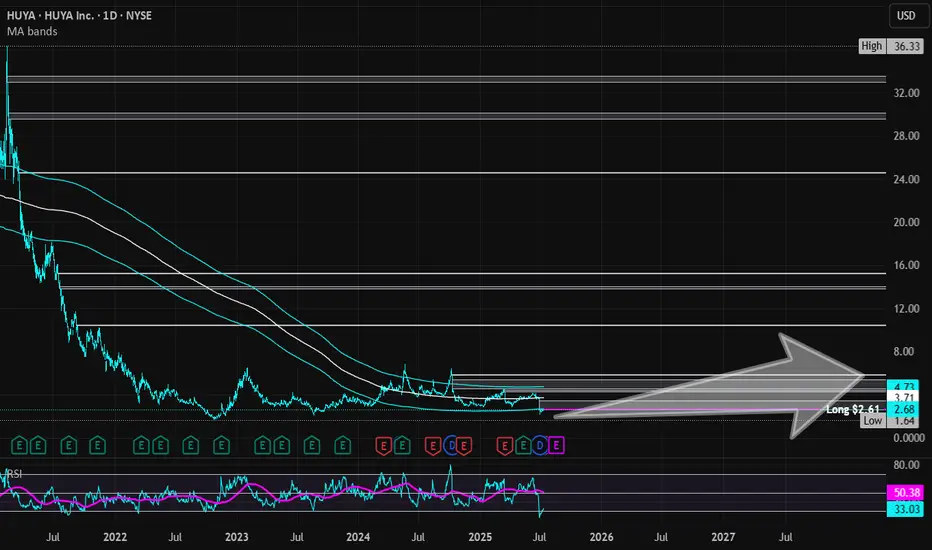
HUYA | HUYA | Long at $2.61HUYA NYSE:HUYA operates game live streaming platforms in China. This stock got my attention based on the reported fundamentals and price position, but moderate "Chinese delisting" risks exist given the US's new political administration.
Book Value = $3.23 (Undervalued)
Forward P/E = 4.1x (Growth)
Debt-to-equity = 0x (Healthy)
Quick Ratio = 1.56x (Healthy)
Altman's Z Score = <1.8 (Bankruptcy risk is relatively high)
From a technical analysis perspective, the stock price momentum has shifted upward based on the historical simple moving average. The price often consolidates within and slightly outside of this simple moving average band before progressing higher (after a long period of selling). While near term-declines are a risk, a longer-term hold (if the fundamentals do not change and delisting doesn't occur) may pay off given the value, growth, and overall health of the company.
Thus, at $2.61, NYSE:HUYA is in a personal buy zone.
Targets into 2028:
$3.45 (+32.2%)
$5.80 (+122.2%)
Electronic Arts: Under PressureEA has shown notable upward pressure, diverging from our expected downside continuation. Despite the recent strength, our primary scenario remains valid: we still anticipate an extension of the ongoing magenta five-wave decline, with wave (3) expected to break below support at $114.60. The remaining legs of this impulsive sequence should also stay beneath that threshold, ultimately forming the low of the broader green wave . However, if bullish momentum persists and pushes the stock above resistance at $169.82, we will shift to the alternative scenario (40% probability). This path suggests green wave alt. – and by extension, beige wave alt.IV – has already concluded, and that EA is now in the early stages of wave alt.V, a significant new uptrend.
📈 Over 190 precise analyses, clear entry points, and defined Target Zones - that's what we do.
TradeCityPro | APE: Key Breakout Watch in Gaming Token’s Range👋 Welcome to TradeCity Pro!
In this analysis, we’re taking a look at the APE coin — one of the prominent American gaming and metaverse projects that gained major traction during the last bull run.
⭐ Currently, APE holds a market cap of $540 million and ranks 110th on CoinMarketCap.
📅 Daily Timeframe
As shown on the daily chart, price has reached a key resistance zone and has tested it several times.
✔️ If this resistance breaks, it could confirm a trend reversal, potentially opening the way toward higher levels like 0.8990 and even 1.973.
🛒 For spot buying, an entry can be considered upon the breakout of this resistance, though it's safer to wait for confirmation of bearish momentum in Bitcoin dominance before entering a spot position on APE.
📈 However, for futures positions, this same breakout trigger can be used — either on the daily chart or lower timeframes.
🔽 On the short side, a support level has formed at 0.6073. A break below this could extend the bearish trend toward 0.3833.
⚡️ Still, there’s a major support level nearby at 0.5633. If you’re looking for a more conservative short entry, you might wait for a clean break below 0.5633.
💥 Momentum confirmation for the short position would come with an RSI breakdown below 46.46, which would signal stronger bearish pressure entering the market.
📝 Final Thoughts
This analysis reflects our opinions and is not financial advice.
Share your thoughts in the comments, and don’t forget to share this analysis with your friends! ❤️

Why Echelon Prime will hit $200 and potentially $400 in 2025Echelon Prime (PRIME) is at the forefront of a transformative movement in Web3 gaming and AI-driven virtual economies. With its innovative ecosystem and upcoming flagship game, Parallel Colony, Echelon Prime is poised for significant growth.
The Echelon Ecosystem: Merging AI and Gaming
Echelon Prime is a blockchain-focused organization supporting a decentralized gaming ecosystem. It provides the PRIME token and Web3 tools for game developers, facilitating resource allocation and governance within a community-led environment.
The ecosystem's cornerstone is the PRIME token, which serves as the native currency across its platforms. PRIME enables players to access exclusive content, participate in governance, and engage in various in-game activities.
Parallel Colony: A Revolutionary AI-Driven Game
Parallel Colony is an upcoming simulation game where players partner with AI avatars to navigate a mining colony. Each avatar controls a wallet, allowing them to own digital possessions and interact with other semi-autonomous agents.
This "1.5 player" game design introduces a new paradigm in gaming, where AI agents operate alongside human players, creating a dynamic and immersive experience. The game's integration of AI and blockchain technology exemplifies the innovative direction of the Echelon ecosystem.
Market Potential and Price Outlook
As of now, Echelon Prime (PRIME) is trading at approximately $4.24, with a market capitalization of around $151 million. Given the ecosystem's innovative approach and the anticipated release of Parallel Colony, there is substantial growth potential.
A projected market cap of $15 billion would correspond to a PRIME token price of approximately $204, representing a 50x increase from current levels. This projection is based on the expected adoption of the Echelon ecosystem and the success of its flagship game. This could very well be a $30 billion market cap by end of 2025 as well, depending on other game title releases and new updates to other ambitious projects.
Conclusion: A Promising Investment in Web3 Gaming
Echelon Prime stands at the intersection of gaming and AI, offering a unique and forward-thinking ecosystem. With the upcoming release of Parallel Colony and the continued development of its platforms, Echelon Prime presents a compelling opportunity for investors interested in the future of Web3 gaming.

Can Axie Infinity Grow 8,000%? Let's Ask The ChartAxie Infinity is recovering from a final flush episode this week. The action just turned green after AXSUSDT hit the lowest price in 4 years, since May 2021.
First, it is still early for buyers and Cryptocurrency traders. Why? Because the action is happening at bottom prices. Just look at the chart, truly low prices as AXSUSDT is still trading below its 3-Feb. low but recovered above its March low already.
The recovery above the 10-March 2025 low within a single candle reveals that the bottom is already in. The final drop, which was a strong shakeout or stop-loss hunt event, not a bearish impulse, is over.
On the left side we can see the bear market wave. It lasted an entire year from November 2021 through November 2022.
This bear market is followed by a neutral-sideways market. This is the transition period.
Now the market is set to turn ultra-bullish but before this bullish cycle there is one final shakeout and that's the drop from December 2024 until April 2025. This move is intended to activate the stop-loss of thousands of traders. Once these people sell lower than what they bought, the market changes course. This is why I do not recommend using a limit stop-loss.
As soon as the multi-year low is hit, the market turns green. This is what is happening now, just watch! Axie Infinity is set to grow long-term.
Buy low to sell high.
Never set a stop-loss limit order on an exchange, it is a recipe for disaster. It is better to wait patiently because the market will recover and will produce strong, sustained, long-term growth.
I have two set of targets, the easy-local targets and the "global" targets.
The easy targets are 560%, 927% and 1,660%. The global targets include the potential for a new All-Time High. We will have to wait and see. I don't know of these purple targets will hit, but is good to be prepared.
Hope for the best and prepare for the best.
Thank you for reading.
Namaste.

Electronic Arts: Jump!Recently, EA has made a strong upward jump, coming very close to the significant resistance at $169.82. However, the price quickly fell again, providing us with sufficient confirmation to consider the magenta wave (2) as completed. The current wave (3) should extend below the support at $114.60, and the subsequent wave (4) countermovement should also occur below this mark. With the final wave (5) of the magenta downtrend impulse, the larger green wave should then be completed. On the other hand, we see a 40% chance that EA has already completed the green wave alt. at $114.60 and will directly rise above the resistance at $169.82 during the beige wave alt. V .

TradeCityPro | ICP: Breakout Watch in Web3 Veteran’s Price Range👋 Welcome to TradeCity Pro!
In this analysis, I’m going to review the ICP coin for you. The Internet Computer project is one of the older projects in the crypto space, focused on Web3 and gaming.
⚡️ The coin currently has a market cap of $2.65 billion, placing it at rank 36 on CoinMarketCap.
⏳ 4-Hour Timeframe
As you can see in the 4-hour timeframe, a range box has formed between the levels of 4.648 and 5.239, and the price has currently reached the top of the range.
✔️ During this upward leg from the bottom of the box, market volume has been increasing, which indicates that the probability of breaking through 5.239 is high.
🔍 If 5.239 is broken, we can enter a long position. The next resistance levels are at 5.558 and 6.313.
✨ There’s also a larger range box between 4.648 and 6.313, and as long as the price stays above 4.648, we can say that this broader range is valid and price is fluctuating within it.
📉 To open a short position, wait for the break of 4.648. The momentum in higher timeframes for this coin is bearish, so if this level breaks, the trend may continue downward with another leg to the downside.
📊 For that to happen, selling volume must increase, so that when 4.648 breaks, there is no volume divergence, ensuring a healthy continuation of the trend.
📝 Final Thoughts
This analysis reflects our opinions and is not financial advice.
Share your thoughts in the comments, and don’t forget to share this analysis with your friends! ❤️

TradeCityPro | AXS: Gaming Token at Risk of New Lows or Rebound?👋 Welcome to TradeCity Pro!
In this analysis, I want to review the AXS coin for you. The AXS project is one of the crypto gaming projects, currently ranked 124 on CoinMarketCap with a market cap of $357 million.
⚡️ This project was highly hyped during the previous bull run in 2021, but after a while, the hype faded and we witnessed severe declines in this coin. It is still in a downtrend.
📅 Daily Time Frame
In the daily time frame, as I mentioned, this coin has been in a long-term downtrend, and recently, with the break of the 4.193 level, the next leg of the trend has begun, and the price has moved downward.
✔️ In the previous analysis , if you remember, I told you that to buy this coin, you should wait for the price to stabilize above the 7.366 level, and if it stabilizes below 5.439, a drop could occur.
📉 As you can see, the price never stabilized above 7.366, and after breaking 5.439, a strong bearish trend began. I hope you used this trigger and made good profits from this bearish move.
⭐ We can draw a trendline from the price lows, and in every move the price has made, it has reacted to this dynamic area and started a new leg after some correction.
🧩 Currently, the price is near an important support at the 2.2 area, and both volume and RSI strongly indicate momentum. If this support breaks and RSI enters the oversold zone, we can expect a sharp bearish move from the price.
🎲 The next support the price has is at the 1.355 level, which is the most important price support, and in my opinion, if the price makes another bearish leg, it will react to this area.
⏳ 4-Hour Time Frame
In the 4-hour time frame, as you can see, the price is in a descending channel and has now formed a range box at the bottom of the channel.
💫 The bottom of the box is at 2.2 and the top is at 2.431. A break of the box bottom can bring the price back to the box low again. A break of the box top can start a bullish leg up to the top of the channel.
💥 On the other hand, usually when a box forms at the bottom of a descending channel, the price goes through some time-based correction and likely ranges toward the channel midline.
🔍 Also, pay attention to the RSI oscillator. RSI entering the oversold zone confirms a short position, and a break of the 50 level confirms a long position.
📝 Final Thoughts
This analysis reflects our opinions and is not financial advice.
Share your thoughts in the comments, and don’t forget to share this analysis with your friends! ❤️

TradeCityPro | GALA: At Key Support, Wait for Bitcoin Dominance👋 Welcome to TradeCity Pro.
In this analysis, I want to review the GALA coin for you. It is one of the first gaming crypto projects, currently ranked 86th on CoinMarketCap with a market cap of 628 million dollars.
📅 Weekly timeframe
In the weekly timeframe, as you can see, a very long-term range box has formed between the zones of 0.01307 and 0.08243, and the price has been ranging between these two areas for quite a while.
🔍 An interesting point regarding the volume within this box is that every time the price moved upward from the bottom to the top of the box, the volume increased, and during the price declines from the top to the bottom, the volume decreased.
📊 However, if we only look at the candles, we can see that the bearish momentum has been much stronger than the bullish momentum, and the probability of the bottom breaking is higher than the top. But this divergence between the price and the volume reduces the probability of the bottom breaking because, in my opinion, volume is more important than candles.
📉 Currently, this coin is located at the bottom area of its box, and we can say that there is a support zone between 0.01307 and 0.01547, which is almost the last support area for the price, and if this zone is broken, a new all-time low will be recorded.
💥 There is also an important area in the RSI, which is the 35.93 zone, and breaking this zone in the RSI increases the probability of breaking 0.01307.
🛒 For buying this coin in spot, the trigger at 0.08243 is suitable, but in my opinion, even if this zone is broken, do not buy any altcoins until Bitcoin dominance becomes bearish. I personally will wait until dominance changes trend and, for now, will not buy any altcoins.
🎯 The main target that the price might be able to reach is the 0.73643 zone, which is the all-time high, but considering that the inflation of this coin has been very high, the probability of reaching its all-time high is very low.
📅 Daily timeframe
In the daily timeframe, we can review the last bearish leg that the price has had in more detail.
🎲 As you can see, after the price reached the 0.06136 resistance and got rejected from this area, the bearish trend started and the price continued along a descending trendline down to the 0.01276 zone.
⚡️ Currently, the 0.01276 support is the most important support for the price, and as we saw in the weekly timeframe, if this zone is broken, a new all-time low will be recorded. The RSI entering the oversell zone brings bearish momentum into the market and helps the break of this zone.
🔼 However, for spot buying in this timeframe, we can use earlier triggers. The best trigger is the break of the trendline, and currently, the trendline trigger is around the 0.01761 zone, and you can buy if this zone is broken.
✔️ An important point, as I mentioned in the weekly timeframe, is that Bitcoin dominance is still bullish, and as long as it does not turn bearish, buying any altcoin is not logical.
📝 Final Thoughts
This analysis reflects our opinions and is not financial advice.
Share your thoughts in the comments, and don’t forget to share this analysis with your friends! ❤️

BULLISH RSI DIVERGENCE ON NINTENDO? SWITCH 2 RELEASE DATE BELOW!Nintendo (NTDOY), the Kyoto based home entertainment company known for games like Mario, recently announced the release date of its new video game console: the Nintendo Switch 2. According to Nintendo they hope to have the system released by June 5th 2025 for customers. A bullish divergence has formed on the 1 hour chart. Will this provide investors with a bullish opportunity, or will Trump Tariff's keep this stock's costs from rising?
Disclaimer: Not financial advice.

BILI | China's Gaming Industry will RiseBilibili, Inc. is a holding company, which engages in the provision of online entertainment content. The firm enables broad video-based content consumption scenarios centered around professional user generated videos supplemented with live broadcasting, occupationally generated videos, or occupationally generated videos. The company was founded by Xu Yi in June 2009 and is headquartered Shanghai, China.

Gamium: Do We Need More Proof? (+250% In 1 Day)This is a different type of publication. I am not doing TA but using Gamium (GMMUSDT) as an example of what is coming to the Cryptocurrency market, specially the Altcoins.
Here we can see a 250%+ candle today.
This candle just deleted six months of sideways and a bearish support breakdown.
If you held this pair for six months and suddenly went into the red when support failed, all the loss would be recovered within the past 24 hours. Amazing. Patience is key.
Why is this happening now and what does it mean?
This is happening now because we are entering a major bull-market. The biggest wave since 2021, minimum, and potentially the biggest bull-market in the history of Cryptocurrency and the whole world. The biggest bull-market in the history of digital finance. The biggest bull-market since the invention of the Internet.
GMMUSDT: Highest volume ever; bullish breakout confirmed; the bottom is in; change of trend; higher highs and higher lows next long-term. This is the current situation.
Basics:
—The Altcoins trading at bottom prices will move first and breakout strongly.
—The Altcoins trading high, those that grew nicely in late 2024, can produce consolidation before the next bullish impulse.
There are many pairs in-between these two. This is just a generalization.
This chart here proves what I've been saying lately: The Cryptocurrency market is preparing for massive growth.
We are only 8 days away from a major marketwide advance. This advance will only be the start. It will take months and months of green, up and bullish action before the positive sentiment loses its force. We are set for something amazing.
This is an early reminder.
This is a friendly reminder.
You deserve the best.
Thanks a lot for your continued support.
Namaste.

WATCoin: The Chart Says 2,097% Potential Within The Next PhaseThis is a gaming platform? Looks like it.
Everything gaming is great. Games are an ever expanding industry and I love the take Cryptocurrency has on games. Play and get paid.
The chart is interesting. I see potential for it to grow.
Would you mind reviewing it together with me?
Your time, energy and attention is highly appreciated.
We can grow together.
We can beat the market.
We can be successful in this game.
There is nothing that says that we cannot win or that we must lose in some way.
Nothing restricts anybody from achieving their goals.
All is possible for you who want to succeed and grow.
All is possible for me if I truly want to win.
Focus myself on the right action. Take care of what needs to be taken care of.
Learn, study, focus. Take action. The market will produce the desired results.
Insist until you achieve your goals. Never give up.
WATCoin bottomed some 20 days ago, 20-January-2025, and it has been producing higher lows.
I see good things for you and for this market.
I see great happenings for those that are involved now. For those persistent, patient and dedicated souls. Trading is not an easy game. But trading can yield fortunes if approached in the right way.
Trading volume lately is low but the highest ever happened after the 20-January bottom, on 26-Jan. This day, session and signal reveals that a whale entered the market. The whales enter to cement a bottom or right after a bottom is in.
All is good and ready now.
There can always be price swings to either side and strong shakeouts.
You can avoid being shaken out of your position by not using a stop-loss. A stop-loss is a sure way to lose money. Instead of committing yourself to sell at a lower price, make sure to set a sell order at a very high price. That's more like it. You buy low and sell high. Never buy low to sell lower, that's a waste of time and money.
If prices move lower, what then?
Simply hold.
If prices move lower, what to do?
Buy more, buy again.
After buying we wait. We wait patiently and happy because we know growth is going to happen. We don't know if it will happen tomorrow, in a week or in 30 days, but it will happen, that's all we know. So patience is key.
You can also define a certain risk level, say 20%. If you don't like it, you can quit but that's not like me. Never quit. Never give up.
Buy lots, accumulate and hold.
When the boom-boom bull-market starts, you will be happy with the results.
Thanks a lot for reading.
Trading can change your life if it is approached in the right way. Just some training and some experience and you can be a winner long-term.
It is possible. Remove leverage. Buy spot and wait.
This way you can remove the risk of being liquidated.
Leverage trading is for experts only.
Instead of gambling, go for a sure win.
Namaste.

Chainlink goes for the title of top-1 blockchain in the worldChainlink is going mainstream! The project is being implemented in a number of major European banks and has also reached an agreement on partnership with SWIFT! This is an incredible result for cryptocurrencies. Chainlink also has multiple applications in other areas: DeFi, Gaming, NFT, DePin and RWA. Take note, don't miss out on an Apple-level project in its infancy!

BEAMX: Dormant Beast Ready to 5x From HereMight not get a retest of the 0.023 area, but the idea remains, and I’ll follow it in case the initial entry isn’t given.
I expect this to start trading above 10c by the end of Q2.
Be patient. BINANCE:BEAMXUSDT

DOGS token price for mid-term and expected targets for this yearthis is my new idea for this token
Unfortunately, things went worse than expected, and the bull season was delayed from normal, but let's look positively and remember that patience is the key
half a cent to 1 cent is the decent target for this token in the mid-term for this year
But there is a possibility of the price falling to the level of 0.00017 first
Good Luck.

Time to BUY Injective Protocol!Hi fellow traders, INJUSDT is ready to make a move higher after completing the complex correction in WXY formation. Target the 58.4946 level. Good luck and trade safe!

BEAM/USDT bullishSame as on FIL and other coins, I see BEAM in an accumulation zone now. Possible a reverse if retesting the 0.04$ zone and then we go for the 0.05 zone. Spot only. Good luck.

Electronic Arts: Heading DownwardWe assume that EA’s recent high at $169.82 marked the completion of a prominent wave in green. This top stands out because it represents a typical corrective pattern where a seemingly new uptrend is simulated. Unlike a standard B wave, an overshooting B wave can significantly exceed the prior peak – in EA’s case, the last major high of July 2018. We primarily locate the stock in an extended correction, whereby a magenta downward impulse should push the price below the support at $108.62. However, if EA breaks decisively above the $169.82 resistance in the near term, we will switch to our 33% likely alternative scenario and reckon with further rises.

My TOP10 project list - pick number 1/10 - GFALAs I dropped WTK from my list, I will replace it with a different project:
GFAL Games for Living is a 30 M MarketCap gaming project (FDV 85 M).
I chose is because of the remarkable Team (Trip Hawkings, Founder and former CEO of Electronic Arts is on the board).
The project is well funded and in April 2024 had a seed round of 3.2 M with Supercell.
Supercell are the makers of 'Hay Day' ; 'Brawl Stars' and 'Clash of Clans', some very prominent games that have earned millions of dollars !
The entry is perfect:
1 Start of the Bitcoin Dominance breakdown (confirmed)
2 Start of the Altcoin bull run (confirmed by major tokens breakout)
3 Price at an 18 month low
4 Huge 8 months bullish divergence on the RSI (price red, rsi green)
5 Break out of the yellow descending channel on September 2024
6 Break out of the bullish descending wedge in the making
7 The actual price entry corresponds to the double of the seed round price (0.004$)
The only downside is that it is an ERC20 token, wich I dislike.
However I own it on the Binance chain, which makes me more comfortable, especially with the fees.
I am very bullish on GFAL and expect great rewards of this token.

ARTY - Bullish Phase Confirmed!Hello TradingView Family / Fellow Traders. This is Richard, also known as theSignalyst.
📌Fundamental:
Artyfact is redefining the AI gaming industry, introducing cutting-edge technologies that not only elevate gameplay but also transform the way games are developed.
🥇The potential for AMEX:ARTY is immense, with a current market cap of just $17 million and 80% of its tokens already in circulation, signaling a strong foundation for growth.
Additionally, Artyfact is gearing up for several major milestones, poised to capture the attention of millions of users, making it a project to watch closely and consider adding to your portfolio.
Milestones include:
- Artyfact in Epic Games Store
- Artyfact Mini-App in Telegram
- Artyfact Launchpad Launch
- Artyfact on PlayStation
- Artyfact on Xbox
- Artyfact in AppStore
- Artyfact in Google Store
📌Technical:
📈 After breaking above the $0.3 - $0.7 accumulation phase, ARTY started its MarkUp (bullish) phase.
Currently, its short-term correction is almost over as it is retesting a massive demand zone.
🏹As long as the structure holds, I expect a bullish continuation towards the $2.3 major high as a short-term target, and starting with $10 as a first long-term target.
📚 Always follow your trading plan regarding entry, risk management, and trade management.
Good luck!
All Strategies Are Good; If Managed Properly!
~Rich
