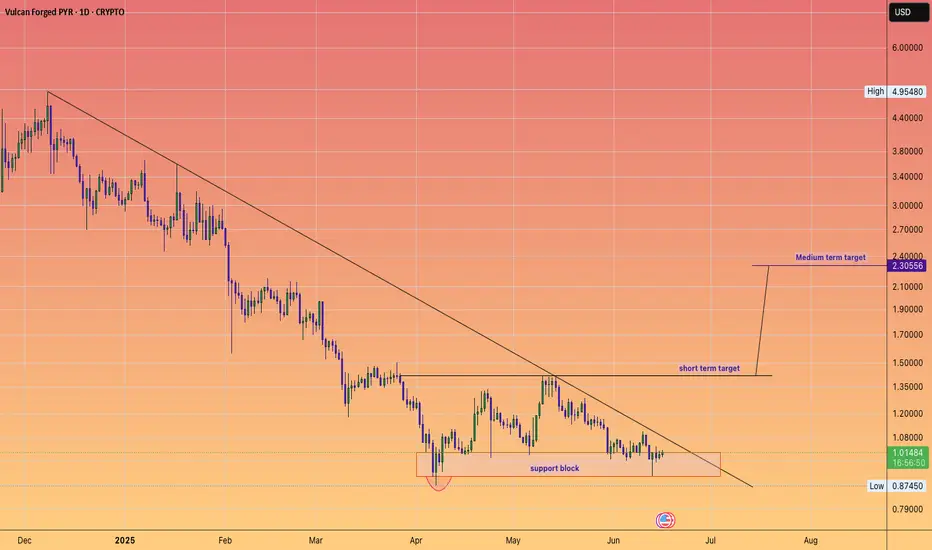
Can Vulcan forged double over the summer?#PYR
#PYRUSD
Clear defined downtrend line, small support block.
#Gaming coin
so needs interest in gaming sector to reinvigorate this coin.
Gamingcrypto
Enjin Coin (ENJ) Analysis & Long-Term Investment Outlook!Current Market Overview
Current Price: ~$0.15
24H Range: $0.1389 - $0.1515
Volume: 16.37M
All-Time High (ATH): $4.5 (achieved in 2021)
Recent Trend: Bearish correction but approaching a key accumulation zone
Technical Analysis
1. Discount Zone & Accumulation Opportunity
The chart shows that ENJ is trading near its discount zone, an area where institutional and long-term investors look to accumulate before a potential reversal. This zone is typically considered undervalued, offering a strategic entry point.
2. Price Structure & Smart Money Concepts
Break of Structure (BOS): Multiple BOS signals indicate a strong bearish trend, but price is nearing a potential support level.
Change of Character (ChOCH): Some ChOCH signals suggest that the downtrend may be weakening, hinting at possible accumulation.
Equilibrium & Premium Zones: The price is far below the equilibrium and premium zones, reinforcing that it is at a historical discount for accumulation.
3. Moving Averages & Watson Envelope
The Watson Envelope (blue and red bands) suggests that price is near the lower bound, indicating a mean reversion could soon occur, leading to a potential bounce.
Fundamental Analysis & Catalysts
1. Enjin’s Utility & Real-World Adoption
Enjin Coin powers a blockchain gaming and NFT ecosystem, allowing developers to integrate digital assets into games, metaverse platforms, and virtual economies. Its real-world use case makes it attractive for long-term adoption.
2. Binance Supporting Network Upgrade (Positive News)
Binance has backed an Enjin Coin network upgrade (September 2024), signaling continuous development and network improvements.
This upgrade improves Enjin’s scalability, security, and NFT ecosystem, strengthening its long-term utility.
Binance’s support ensures liquidity and investor confidence.
3. Coinbase Delisting (Negative Impact in 2024)
In June 2024, Coinbase delisted ENJ, causing a short-term decline in liquidity and investor sentiment.
However, delisting from a single exchange does not impact the coin’s fundamental value.
Investment Potential & Price Prediction
Short-Term: Possible consolidation in the $0.12 - $0.18 range before a breakout.
Medium-Term (6-12 months): If accumulation holds, ENJ could target $0.30 - $0.50, testing previous resistance levels.
Long-Term (2+ years): If Enjin’s adoption continues and the crypto market recovers, a return to $1 - $2 is feasible, with ATH of $4.5 as a long-term target.
Investor Takeaway
✅ Bullish Factors
✔️ Trading at a discount near historical accumulation zones
✔️ Binance supporting network upgrade (strong ecosystem development)
✔️ Real-world use case in gaming & NFT sector
✔️ Market sentiment could shift as crypto recovers
❌ Bearish Risks
⚠️ Still in a downtrend, needs confirmation of trend reversal
⚠️ Coinbase delisting may impact liquidity & exposure
Final Thoughts
Enjin Coin is currently at a key accumulation level that offers an attractive opportunity for long-term investors. With strong fundamentals, upcoming network improvements, and historical price performance, ENJ has the potential to reclaim higher levels, possibly targeting $1+ in the next cycle.
If you’re looking for a high-risk, high-reward opportunity, this could be a great entry point. However, investors should watch for trend confirmation before going all in. 🚀

GALA's Explosive Potential – A Technical Outlook for 2025Current Market Structure & Momentum
GALA is currently trading at $0.0285, up by +4.61%, showing signs of potential accumulation. The chart presents a strong historical cycle of breakouts (BOS – Break of Structure) and retracements, which typically indicate a high-volatility asset gearing up for another bullish wave.
Key Bullish Indicators
Smart Money Concepts – The presence of Buy-side Liquidity at multiple levels signals that institutional players may be accumulating. Historically, such patterns have preceded massive price surges.
Nadaraya-Watson Envelope Support – The price is currently in a discount zone, meaning this could be a prime accumulation phase before a major rally.
Historical Pump Patterns – Previous price cycles show massive price expansions following extended accumulation periods. The last breakout saw an explosive run from $0.015 to $0.08 (~+400% gain).
Price Targets & Potential Growth
If GALA follows a similar trajectory, a 300% move from the current levels would target $0.12, aligning with historical resistance zones. However, if macro factors, gaming adoption, and broader market trends support the rally, a full-scale bull run could push prices towards the $0.50 to $1.20 range in 2025.
Investor Takeaway
🔹 Current accumulation zone suggests a strong potential for an upcoming rally.
🔹 Break of key resistance levels (around $0.05-$0.07) could fuel a parabolic move.
🔹 Long-term holders and strategic investors may find this an ideal accumulation zone before a potential explosive breakout.
With increasing blockchain gaming adoption, a growing Web3 ecosystem, and GALA's historical patterns, this could be a golden opportunity to position yourself before the next wave of institutional and retail interest floods in! 🚀🔥

PYRUSDT Building for a Breakout? Bulls Could Take Charge Soon!Yello, Paradisers! Is #PYRUSDT gearing up for a powerful move that could leave sellers scrambling? Let’s break it down because this setup could be one of the juiciest plays on the horizon.
💎#PYR is currently sitting at the base of a massive triangle formation—a pattern that often precedes explosive breakouts. The price has been respecting the strong support zone between $2.50 and $2.40, with bulls consistently defending this region since early November 2024. Sellers have tried to push lower, but every reaction from this support has only strengthened the bullish case.
💎If the bulls maintain control and keep this support intact, momentum could shift dramatically in their favor. The first major test for buyers lies at the $3.00 descending resistance, a critical level that, if broken, could trigger strong buying pressure and signal the beginning of a bullish breakout.
💎Above $3.00, the next key zone to watch is $3.65 to $3.80, where stronger resistance could cause some profit-taking. However, if bulls continue to build momentum, PYR could aim higher toward the wickless candles between $4.40 and $4.60, potentially setting the stage for a significant rally.
Patience and discipline are key here, Paradisers. The market often tests both bulls and bears before making decisive moves, so stay vigilant.
MyCryptoParadise
iFeel the success🌴

BFTD on $GAME AI AGENTGAME enables AI agents to function independently, analysing inputs and crafting responses while gaining insights from previous interactions. It boosts decision-making capabilities by utilising long-term memory, which encompasses experiences, reflections, and evolving personality traits. Through ongoing assessment of the results from actions and dialogues, GAME allows agents to enhance their understanding and elevate their planning and performance as time progresses.
Following an incredible surge in the crypto market, which propelled its market cap to an impressive $370 million, a golden opportunity has emerged to capitalise on the dip. This groundbreaking protocol is gearing up to reach a staggering $1 billion. Now is the moment to buy the dip and buckle up for an exhilarating ascent.

AXS Price Analysis: The Road to $10, $13, and Beyond 50$The cryptocurrency market is heating up, and Axie Infinity (AXS) is positioning itself as a potential breakout star. Currently trading around $5.70, AXS is showing signs of accumulation, setting the stage for a significant move.
🔎 Market Structure & Key Levels
📊 Support Zone: Strong support is forming around $5.00-$5.50, indicating that buyers are stepping in.
📊 Breakout Zone: A breakout above $7.00 could trigger bullish momentum.
📊 Short-Term Targets: $10 and $13, based on previous resistance and Fibonacci levels.
📊 Long-Term Potential: If momentum builds, AXS could revisit $50-$100, aligning with historical uptrends.
🔥 Why AXS Could Rally in This Bull Market
🚀 Bullish Market Cycle: With Bitcoin leading the way, altcoins like AXS often follow with explosive gains.
🚀 Token Unlock Events: While unlocks can create short-term supply pressure, they also increase liquidity and market participation.
🚀 Smart Money Moves: Institutional investors and whales may accumulate at these levels before the next rally.
🌍 Macro Factors Boosting Crypto
💡 Pro-Crypto Sentiment: The new U.S. administration is leaning towards clearer crypto regulations, which could fuel mainstream adoption.
💡 Institutional Interest: BlackRock’s CEO Larry Fink believes Bitcoin could reach $700,000, suggesting crypto still has massive upside potential.
💡 Growing Adoption: As Web3 gaming gains traction, AXS stands to benefit from increased utility and user engagement.
📌 Investor Takeaway
AXS is currently at a discounted price, making this a strategic entry point for investors eyeing the next bull run. A break above $7.00 could confirm a strong uptrend, paving the way for double-digit gains in the short term and exponential growth in the long run.
🔔 Stay ahead of the market – monitor AXS closely and position accordingly!

Bigtime breakout still eminent! I like the reaction I am seeing on the downtrends if u follow closely you see we broke out to 17cents then back test and still showing strength where I expected. Let’s go …below 10ce t invalidated

$ AXS | How do I expect to see AXS in coming weeksLet’s dive into another crypto asset analysis from the gaming sector to see if it has any chance to make us more money. This time I picked Axie Infinity with the AXS ticker. Most have heard of this famous project, but for those who have not known about the project, here is the CMC info on BINANCE:AXSUSDT
Axie Infinity is a blockchain-based trading and battling game that is partially owned and operated by its players.
Inspired by popular games like Pokémon and Tamagotchi, Axie Infinity allows players to collect, breed, raise, battle and trade token-based creatures known as Axies.
These Axies can take various forms, and there are more than 500 different body parts available, including aquatic, beast, bird, bug, plant and reptile parts. Parts from each type class come in four different rarity scales: common, rare, ultra rare and legendary — and Axies can have any combination of body parts, making them highly variable and often rare and unique.
Each Axie is a non-fungible token (NFT) with different attributes and strengths and can be entered into 3v3 battles, with the winning team earning more experience (exp) points that are used to level up an Axie's stats or evolve their body parts. These Axies can be bred together to produce new and unique offspring, which can be used or sold on the Axie marketplace.
The Axie Infinity ecosystem also has its own unique governance token, known as Axie Infinity Shards (AXS). These are used to participate in key governance votes and will give holders a say in how funds in the Axie Community Treasury are spent.
BINANCE:AXSUSDT
Market Cap: $ 1.45 B
Market Cap Rank: 95
Market Price: 9.31 $
ATH: $ 165 (-94%)
ATL: $ 0.1234 (+7414%)
Technical highlights:
- W1:
Trend:
Price has been in a parallel channel for 800 days. We had the last LL in Nov.2022 at $ 4. After that price tested that level twice and both times bounced. Price managed to break local resistance level from $ 6.00 to $ 6.6 with sharp candle and good volume. That was a clean break through but price remains in the parallel channel. The point is, price trend from downtrend turned to sideways and many times (not all times) sideways after a long downtrend means accumulation phase. Still we need to check volume and I checked OBV. OBV increased in this sideway phase (769m to 885m) so people bought more in this 800 days.
the next hints.
MA: Price holding above MA20 in monthly time frame. In the weekly time frame, MA20 located below MA50 but with the help and support of MA20, price jumped above MA50 at $ 6.94. MA50 acted as support and been tested successfully last week. On the other hand, in the daily time frame, price hovers above MA20, 50, and 200 and says bulls are in control.
RSI: The value is around 67.9 and is strong in the weekly time frame, which supports the local bullish trend direction. The RSI value in the daily time frame is 68 and it’s almost at the same value of W1. The difference is the RSI in D1 turned into overbought twice and printed a bearish divergence. So, I think there will be a cooldown before any major growth for a healthier growth.
Stoch RSI: The Stochastic RSI in W1 is in the overbought zone. That’s another reason to expect a retracement.
The Darvas Box:
Charts sometimes create patterns with repeating results. That’s why we use them to predict the next move of the trend. In the accumulation phase, there are many patterns that can help us earn profit by following them, but most of them need to be observed and backtested every day to see if they’re still working and reliable. The Dravas box is one of the patterns that can be seen in accumulation periods. Simply put, it’s a sideways (trend must clarify the range high and low) move that eventually breaks above the 52-week high with increased volume. In this chart, the price is still located below the 52-week high ($13.5) and it is still early to call it a box, but if that happens anytime, then the price will most of the time increase for days.
In addition to volume increase, we must observe the absorption of supply at 52 weeks' high. Meaning the price needs to stick right below that level for a few days before the breakout, and it’s better to see OBV increase for more confirmation.
Gaming tokens are still underwater and haven’t moved like other assets like MEME coins, but I believe this is a good time to pick some of the best gaming tokens with real use cases and a well-known team.
In my point of view, channels play an important role in trend direction and targets.
Supports:
$ 8.00 at Ma20 in D1
$ 7.00 at Ma50 in W1
$ 6.00 last known resistance break
Resistances:
$ 10.7 D1 Supply zone
$ 13.50 Range high / 52 weeks high
$ 19.00
$ 23.00 MA200 in W1
$ 45.00
$ 65.00 W1 local high
$ 100 W1 supply
Conclusion:
All these opinions are mine and can be wrong, so please DYOR.
This token is one of the best gaming token with many users and strong community. I will buy partially on the possible pullback. Please always do the risk management.
** In addition to the volume increase, we must observe the absorption of supply at the 52-week high. This means that the price needs to stick right below that level for a few days before I need more energy to carry on, which is provided by your support. Don't forget to hit boost, share, and comment on your point of view with me. **
My strategy goes as below:
🛒 Pair: AXS/ USDT 🛒
👑 Bitcharge 👑
🕰 08/12/2024 🕰
POSITION: 🟢"Buy"🟢
2 % of capital
🛒 Buy: $ 9.3 (10%) – $ 8 (20%) – $ 7 (30%) - $6 (40%)🛒
👉Sell Targets👈
🎯TP1: $ 10.6 🥉
🎯TP2: $ 12 🥈
🎯TP3: $ 13.4 🥇
🎯TP4: $ 15 🚁
🎯TP5: $ 17 ✈️
🎯TP6: $ 19 🚀
🎯TP7: $ 23 🛰
🎯TP8: $ 33 🛰
🎯TP9: $ 45 ✨
🎯TP10: $ 55 ⭐️
🎯TP11: $ 65 💫
🎯TP12: $ 75 🪐
🎯TP13: $ 85 🌞
🎯TP10: $ 98 ⭐️
🎯TP11: $ 110 💫
⛔️ SL: $ 5.10 ⛔️ by closing W1 Below
--Stay rich--

UFO Bullish outlookI have charted all the noticeable Bullish factors on the chart. Flagging above 200D MA , big volume shelf formed recently. 1st target Would be 11% Fib above. Let me know what you guys think!

ENJ Monthly / HTF ViewWe could be infact repeating the exact thing in 2020-2021 bull run.
We need to get above the 0.69~ area to be really bullish.
#ENJ #Gaming #NFTs

Karrat looks ready to make a moveKarrat has just has a green signal (cross up) on the macd/rsi super
typically, this leads to at least a few days of grinding upwards for $Karrat. I'd expect to see a 5-10% move within the next 12-48 hours followed by possibly a 20-30% over all move for this next 1-2 weeks.
Keep in mind Karrat has been in this ranging since it launched a few months back and there will most likely be a lot of profit taking as usual in the marked areas and most likely the current peak target short term is in the $0.70-$0.80 range.
However, in the bigger picture I'm expecting Karrat to go much, much higher by the end of this cycle so depending on how frequent you like to be with your trading etc. you might want to only reduce 25% in that target area and then another 25% in the $1-$1.25 range and then ride the rest out until it does something spectacular later in the cycle.
Karrat has been making all the right moves during this cycle and now has their own blockchain as well as they are a TOP TIER NFT play. These things only add to the fact that they have a AAA rated working game.
Many are not even catching the fact that they may end up also being an RWA play before you know it.
Oh and did i mention this is ALSO a quality A.I. play, lol.
The ENDLESS opportunities with this coin make it seem Super CHEAP IMO at these levels and even at $1.25
I expect this to see a min. of $3.50-$5 this cycle and would not be at all surprised if it totally eclipsed these targets all together and pulls off being the $axie of this cycle.

SANDUSD heading towards the double bottom neckline/channel toptl It appears the gaming/metaverse cryptos have been awakened as they all appear to be getting a nice pump today while the rest of the market appears to be consolidating. Sand has a channel (in dark bluish purple) and a double bottom currently in play. The breakout targets for both are roughly in the same price zone. *not financial advice*

Gala 50-150 SMA cross impendingGala is currently experiencing a 50-150 simple moving average on the daily time frame. This is a bullish signal for the gamefi token that has already been rallying for the last recent week. RSI is about to leave nuetral territory at time of publishing. Targets are horizontal lines above taken from fib extensions of the previous high swing low.
Not financial advice. Do your own DD.
Thanks for viewing the idea.

DAR bullish ideaMines of Dalarnia (DAR) is currently exhibiting a bullish head and shoulders pattern on its charts.
This pattern is often considered a reliable indicator of a potential trend reversal from a downtrend to an uptrend
Investors and traders should keep a close eye on DAR as it approaches the completion of this pattern, as it may present a lucrative opportunity for those looking to enter or add to their positions.
NFA, GL HF

Bullish Divergence on 30min for NYANUSDTA bullish divergence has formed on the 30min chart of Nyan, take it for what you will but with the recent promotion pump, this looks like it will have legs. Bullish.
The individual who promoted the token on Sept 28, has not sold much (if any) yet as the are smarter than your average bear. They will wait to sell into strength, likely into a new ATH, but for at least how much it's worth to them to put out a video on a high profile YT channel.
Stay tight

ILV (Illuvium) – Rectangle Bottom for Long-Term Swing TradeSEED_DONKEYDAN_MARKET_CAP:ILV is showing a classic rectangle bottom pattern, signaling a potential long-term buying opportunity. The price is consolidating at what could be the most likely bottom, presenting a favorable risk-to-reward ratio for swing traders.
Top of the range: $140-$150
A range break could propel ILV towards the next major resistance zones around $400-$500, offering substantial upside.
Keep an eye on the price action at the top of this range—if we get a confirmed breakout, this asset could be set for a major move!
🔍 Watchlist it for potential entries at support or a breakout above resistance. 🚀
#ILV #Illuvium #Crypto #SwingTrade #TechnicalAnalysis #RectangleBottom #Altcoins

Bearish scenario McadeAlthough Metacade has delivered some fundamental improvements like partnerships and a serious gaming platform, the price of the token holds support and is ranging.
If we loose the upper blue range, we could see prices in the lower support area.

Golden Ratio Zone | Long BiasOn Week Chart
GALA has been downing to Golden Ratio Zone and touch lower trend line of Fibo Channel
Wait it creates bottom and have some signals for reversal
Time will tell

GALA bullish or bearish?Looking for a break out of this triangle i’ve drawn up. Resistance and support seem to be around 0.051 and 0.035. I’m feeling over all more bullish since a lot of weekly stoch rsi have reset now in the broader crypto market. That’s just one of many indications though. Anything could happen. If we don’t pop soon. Then more side ways is unfortunately underway. Also looking for quick wick down before possible rocket reverse. We still need more new crypto buyers and less negative media to get a party going.
Also… The 12 hr for GALA looks like an inverse bart simpson pattern. Since it’s formed a solid bottom with inefficiency in the opposite direction. Time will tell for how strong GALA is though. I’m long around here 0.044 looks convincing. I’d be pretty concerned if we loose the big support around 0.036 though.
Let’s see how this plays out this week.

Possible Bear flag patternI'm not a financial advisor, and investing in cryptocurrencies involves risks.
The Bear flag pattern on a chart might indicate a potential downward move, but it's essential to consider various factors.
If the market condition continues to be bullish we might break to the upside.
The bearish target is around 2$
The bullish target is around 8.5$ but might go up high to 12.5$.
I have a spot bag with a good entry here but will open the hedge short once the Bear flag starts to break.
BINANCE:AIUSDT AI/USDT looks similar and I'm in

AXIE INFINITY can rally 500% The rewards are higher
getting before the right shoulder is completed
versus waiting for a neckline to be broken
Some say the risk should be higher as well ?
Actually not in my opinion
Cheaper prices are insurance as the higher these coins go the more risk they carry
especially as we enter the Alt season.
Smash the like if you think this pattern looks good.
#InverseHead&Shoulders

OASYS GAMING New Targets laid out for you Inv. Head & ShouldersWe have had some good winners already
And the best is yet to come as we enter silly season
Fully expect Oasys to fully deliver this log target.
(We can assess how quick it gets there , what other targets higher it may give)
May not seem like much
but thats a 7X from when I first shared this with you guys.
Massive names on this blockchain.
SEGA, Rakuten etc
And you can delegate your coins to make yield!

Aiming at 10 - GALA set up for successNot only has this coins company been building out a major foundation , the trading has been hot for weeks now on coingecko and coin market cap. Even amongst all the meme coin insanity.
Now for the chart, I've got alerts set at my 7c mark. This is a hefty level ass a ton of volume was traded there. If we hold above 7c with some daily canlde closures, we are going to see a solid test at 9/10c.
See you all on the other side of 10!
