Buckle Up ButtercupI have been following GME forever. I have even gone to that little movie that was created to show my dedication. I have GameStop merchandise and clothing. I love this company.
Lately things have been feeling different than usual, I still expect time to do its duty, as well as catalysts to potentially increase our duration at these levels as well.
Soon however, GME will be more than a stock.
Soon I expect large green bars.
Soon.
Buy. Hold. DRS.
Want a choccy milky from the gas station to fill ur tum tum with num nums?! NO!!!!
Because save $$ -> BUY -> HOLD -> DRS
I LOVE YOU ALL
GOODNIGHT
(NFA)
Gamma

Market Positioning on Q's and SPY$SPY
Gamma Environment: Positive (289mn)
Key Gamma Levels:
5th
465 - R3 resistance
460 - R2 resistance
458 - R1 resistance
452 - S1 (First Support)
450 - S2 (Second Support)
447 - S3 (Third Support)
Views:
Vix no longer remains bid maintains a clear path below 18, given the current stats and the 100% spike the past would suggest we don’t see another spike till mid-2023. That being said, the key catalysts for vix that remain include an unexpected fed hike intra meeting. Major escalations from Russia on the Ukraine side.
VIX levels based volatility range of +1.2%/-1.2%, Negative gamma environment volatility is likely to continue to be more muted given the VIX’s current levels and as hedges begin to wind down.
SPY pushed into negative gamma territory (short term) and long term (now at $-1.4Bn, down from $1.03bn yesterday looking two months forward). We now look ahead with a cautious view on direction as we reach a tilt on direction. There still remains opportunity for bulls to take this up as the negative gamma environment skew provides short term charm flows in favour of bulls should we stagnate.
Call volumes -16% and put volumes -2% with puts now up to 2.2x the volume of calls. Following this drawdown there provides room as mentioned above to give a move higher should call buyers begin to step in. Note though that this volume is isolated to SPX and so in this case the underlying seems to have been the main driver in indices action. As a result we place an eye on TSLA/AAPL/MSFT contracts to see if volume continues to push in as there is likely to be some more put unwind in these names. As calls are likely to have unwound for the most part since last week already.
10 Delta Put premiums (465C) vs call IV (at the 10 delta, 445P) across duration remain at 1.1x on an IV basis (at parity), the skew here suggests puts are now much more favourable than before (explaining the increase in negative positioning) vs calls and even more so in the short term, so we expect some resistance going lower than 450 due to negative positioning at 452.
-2% on calls -16% on puts
OrderFlow
For order flow perspective levels please see the levels provided in the chart. See these lines as “barriers” to overcome and if done then price can be “accepted” into areas where previous buyers (Navajo white = up volume) and sellers (purple = down volume) wanted to engage up until points where there are much greater levels of volume. These are areas that you can consider as greater points of resistance.
Calls/Puts Volume
Bull Scenario
Above 4600 (with continuous bid at 4580) ($ES) additional call buying to increase up the chain at further expiries and up the chain would be needed to continue this drive up. Note the skew toward call buying has lightened dramatically but a portion of short date puts are still set to unwind (see screenshot). The majority of flow is likely to be driven by TAAN. (TSLA/AAPL/AMD/NVDA) given they attributed for ~3million contracts. Continuous exhaustion @ 4600 (we are at 4581 as of writing - having found brief support at 4520) in the first 30 mins defines whether there is a clear aggressive direction and a move above could set us up for a hold above 4600 should positioning continue to drive higher. VIX crush below 18 will also help produce the environment we expect.
Bear Scenario
If we maintain below 4550 in particular we’re interested in further sell off as this level provides a key level down. That being said this will be a difficult area to break. A break below this could generate sell down to 4500 as Vanna flows above drive us lower and with put gamma at 4500 and under increases exponentially. This begins to act as a magnet to price with selling intensifying from above and below. We would need to see call buying decline in AAPL/TSLA as well as semi weakness. VIX climbing over 20 and hold above 22 then signs that VIX is being bid and presence of further downward trend are present are increasingly there. We would also need to see some weakness in big tech particularly and strength in gold miners and other precious metal cos (NEM, GLD,SLV etc)
$QQQ
Gamma Environment: Positive (-74m)
Key Gamma Levels
5th
375 - R3 (NQ -15371.0)
370 - R2 (NQ - 15166.0)
369 - R1 (NQ - 15125.0)
368 - S1 (NQ - 15084.0)
365- S2 (NQ - 14962.0)
360 - S3 (NQ - 14757.0)
Views:
Q’s positioning moved out of negative territory with AAPL buyback news leading the charge higher the move of which was a result of negative deltas that had to be bought back. Concentration at 375 is an area that could provide more pull higher should we break higher.
Put IV to call IV is even (Puts 1.1 vs Calls ) the 10+/10- Delta (379 vs 359). Despite the drawdown puts are reasonably priced vs calls and as a result we may expect more drawdown should puts continue to increase down the chain. We continue to review VIX and look for this to hold above 20 to determine an increase in puts.
(Key themes below still stand)
A key eye remains on energy names as we look to see for continued flow out of equities, though this doesn’t seem to be the case. This is important for more drawdown, without strength in commodities we are unlikely to see much lower. We also noted weakness in steel, copper etc though a downtrend is yet to be confirmed.
(Unchanged)
Bonds: HYG to maintain weakness as will help indicate much lower which seems to be the case thus far. Weakness/Strength in Gold & Oil should help with this continued upside. Note that the flow into energy stocks whilst initially seemed to be increasing still seems muted so this hesitance may be off the back of worry heading into the next business cycle where demand destruction is expected. Another indicator being china home growth.
FANG (Big Tech) had 124% increase in net positioning $490mn net gamma from $218mn, this positioning is an outlier in comparison to prior levels and is now reaching zones similar to February where we achieved a major rally. With breadth improving too this provides an extra boost and likely move higher to the Qs, though the window remains short for this week.
A continuous bid at 370 (15166.0) is key to demonstrate lack of bearish bias and unwind of any put flows bought. Maintain a view of AAPL, TSLA, GLD, NEM, HYG, CRWD, DOCN, PANW, ARK, XOM, XOP, SLV with the commentary above in mind.
OrderFlow
For order flow perspective levels please see the levels provided in the chart. See these lines as “barriers” to overcome and if done then price can be “accepted” into areas where previous buyers and sellers wanted to engage up until points where there are much greater levels of volume. These are areas that you can consider as greater points of resistance.
Bull Scenario
If we can hold above 370 (15166.0) with a move higher into (ideally above) 375 (15371.0) into the close, additional gamma levels would need to increase further( particularly at the 370 mark) up the chain and as a result positive deltas would need to bought higher. The negative gamma in short duration below should also continue its last legs and decay with this effect resulting in pops in the final market hours. We would also want to see the VIX continue to drawdown and maintain below 18.
Bear Scenario
Maintaining below 368 (15084.0) should result in the decline down to 365 (14962.0) and 360 (14757.0) potentially on the cards should VIX remained elevated with a gradual increase. Strength in commodities and weakness in AAPL/TSLA in particular especially at 177.5 will demonstrate a lack of bias to the upside. As mentioned above we would want to see SLV, XAUUSD and CL (Oil) get a bid (noted in call vs put volumes as of late).
Any questions,
Hit me up on twitter @Vexxly.
Appendix:
Key Terms:
Key Gamma Levels:
Areas to identify for key support and resistance i.e. a call wall can act as a resistance zone as call buyers sell as we reach closer to the money and so MMs will re-hedge accordingly
Negative Gamma = Increased volatility
Why? Because MMs are enhancing volatility and flows are supportive of direction
Positive Gamma = Reduced volatility
Why? Because MMs are suppressing volatility and flows are against of direction
Gamma Environment (Negative/ Positive)
Vol Trigger (Where gamma flips through a key negative level and reinforces flow, as MMs re-hedge)
R1/R2 resistance - resistance level one etc
S1/S2 support - support level one/two etc
Note:
This information was never intended nor will ever be considered a place to give or receive investment advice. This information was created for the sole purpose for education and fun. Anything said by anyone on this commentary should never be taken as investment advice. Do your own due diligence before making any decisions to invest your money and seek investment advice from a registered advisor should you choose to do so.

Fall potential on Gold #options #ai #mlOption data and AI algorithm from analysis data from this market show the possibility of retreat from growth and switch to Bears taking control over. We have a powerful resistance (supply zone) around 2060, and Virgin VPOCs can be found only below the current price level (for a moment of writing analysis). Current option support is 1881 and this is a key level when it comes to potential closure of the downward movement. To Gamma Flip (whose exceeding will increase the volatility on the market) still far (1786), but it is worth observing what will happen on subsequent sessions. Falls will be negated after exceeding 1975.
I take into account all Expiration from the gold option, which are then treated by the Machine Learning script. AI in this case shows the main key levels on the market and conclusions from data analysis. They are exported to the Quandl base and then imported to TradingView. Data is also published every day a week, on my website. Remember - knowledge and data are power, in this case, increasing significantly a chance for profitable trading :)

S&P500 idea based on current Options & DarkPool dataShortly and succinctly, but on the subject - how I see it from Swing Trading approach when it comes to option data and S&P 500. After the last OpEx, I expect a temporary advantage of Bulls with a short break around 4500. The move will end in the supply zone 4548-4567, where Virgin VPOC from 10.02 should be retested. Then a few subsequent sessions will bring drop in price, retesting Virgins on 4357 and 4220.
Options data is available for free - inquisitive and curious traders I invite you to my profile and via DM. This data will allow you to get a market advantage now, by indicating sentiment and key levels where a billion dollars from Smart Money has been placed - as they use options for hedging their risk.

This will likely happen in my opinionRead how I feel about this in my other posts. I’d say we’ve got about 1-2 years left of the fight, if not longer. Don’t gamble on weeklies, however I am not saying don’t buy contracts. Huge misconception, calls can gamma ramp, but also drop the stock heavy when they expire worthless.
We need another gamma ramp for the next huge moon, that’s my full opinion after everything I know. I seriously don’t think the next “squeeze” will even happen unless we have a gamma ramp. We’ve gotta ramp into the squeeze on this.
Everyone keep thinking it’ll come out of no where. No tf it wont? Did the first one ever “come out of no where” no.. no it absolutely did not. Leading up to the first squeeze we were having green weeks for months. Then for DAYSSSS GameStop get getting squeezy in after hours and premarket trading.
Again.. this isn’t financial advice for anyone. This is what I’m observing and the decisions I would personally game.
CantStop. WontStop. GameStop

2.2 Billion Reasons to be short this market in march.I'm going to breakdown JPM big 20 billion dollar Put Spread Collar Hedge trade early this quarter.
The trade usually gets a lot of attention when they do the roll/reset on the day it expires each quarter.
For the uninitiated, this trade occurs every quarter by JPM as a premium neutral hedge (market crash protection) for a 20B fund.
Furus try to explain the delta of it on the day of the trade, but that is not where this trade interests me.
If you follow Gamma and Vanna Exposure of the options world, you would likely know on any given day if the market is currently positive or negative gamma exposure.
You may follow Cem Karsan on twitter like I do and know about Gary and his Bananas or more recently Vanna.
This trade is often a focus on Cems threads when it approaches expiry and I think I finally figured out how to measure its effects on the market.
Here is a graph of the a 21 day moving average of Gamma Exposure.
pretty neat how something as random as the stock market can provide such a recurring pattern.
This idea is just a primer for 21DMA GEX, I'll be following it up in the next few weeks with numbers behind it and how I plan to trade this very cyclic pattern.
Trade Safe. Not financial Advice, just Mad Magazine Data Science.

180$ for barrel?! What will happen with Oil Price during WarOnly peace will save us - as one proverb says. But is it really the case with the oil price? The war in Ukraine and the turmoil over Russian oil are shaking the markets, so we have to look at the situation from several perspectives.
the nearest option resistance is at USD 120
we have a lot of Virgin VPOCs below the current price, which theoretically should act as a ballast inhibiting further increases
in the background the risk of the imposition of further sanctions banning the import of Russian oil in individual countries
ignorance of OPEC at the last meeting - political and supply turmoil around oil and the session ... lasts a record 13 minutes without mentioning the oil supply limitation by one of the key OPEC producers!
The situation becomes even more interesting if we see where the funds are located on the Options from the Expiry Date in mid-April 2022 - the resistance (i.e. investors place money on CALL options) with a record high turnover is ... the level of USD 180 per barrel! At the time of writing the analysis, we have as many as 4241 options there. Even at the next expiration of options in mid-March (little time until Expiry), we can see the capital shifting towards $ 140, where levels of $ 100-110 were staked at the beginning of the war in Ukraine.
The options market often brings information well in advance. Get an edge in trading today with access to daily analyzed levels and option data from multiple instruments. The inquisitive will find a link to the page where the results of trading with the use of tools and option data are presented, as well as information about the mechanics of the market available for free.
And what are your expectations for the coming weeks ad. oil prices? I'd love to hear from you!

BTC from Options perspective - current situationI do not intend to predict the future or make the hypothesis "now only to the moon" so let me briefly present the facts based on information obtained from the Machine Learning (AI) algorithm analyzing the options:
- we have exceeded the Gamma Flip, which will result in reduced volatility per Bitcoin
- the nearest option support is at the level of 40k, while the much more solid capital is located at the level of 35k
- the closest resistance is at 50k, but much stronger capital located at 60k
- we only have one Virgin VPOC below the current price (around 35k - coincidence?) and a few Virgin VPOCs located every few thousand on average above the current price level
I hope the conclusions come by themselves. I update the option data every day and are available for you (insightful and inquisitive ones will surely find it on my profile).

Setup for a return to bear countryI have not been able to trade/chart much lately but I wanted to make note of where we closed yesterday vs open today.
CPI running hot. almost a perfect setup for a bearish reversal leading into opex next week.
SPX just closed above the ZeroG (gamma flip) in relation to Naive Gamma.
Means dealers should be selling us lower into next week.
Get free Naive Gamma exposure levels (delayed quotes) for SPX at spyvsgme.com
I adjusted the algo to notional value of 1% move in SPX.
If you have been monitoring gamma levels you could see a shift back into calls over the past week as we approached zeroG.
There are only a couple more weeks until JPMs JHEQX quarterly collar.
I'm going breakdown the trade a few weeks ahead this time and try to predict if dealers need to sell or buy as the final weeks approach.

Where is BTC going?Let's take a look at Bitcoin from a broader perspective. Today we retested the Virgin VPOC from January 5th. The bearish sentiment has been overcome and we have a fully confirmed change to Bullish (green background of the sentiment indicator + blue bars - I explained the indicator in one of the separate entries that I add to Related Ideas). After breaking 46105, we will have an open road to retest the next Virgin VPOC at 48035 on December 31st. Both the psychological barrier and the key level from the perspective of Option Traders is the 50k level (at the time of writing the analysis). This is a strong resistance, and a tough/fierce battle between Bulls and Bears can take place there.
In general, BTC presents itself in the long term Bullish from the perspective of Virgin VPOCs which the market will seek to retest. However, two things worry me:
50k level as resistance and psychological barrier
two Virgin VPOCs that are located below the current price (at the time of writing the analysis) at 36560 and 36065 - although they are quite "young" Virgin VPOC and it is worth having them at the back of your head, but not necessarily fixing on them
It will be useful to use on an ongoing basis when assessing the BTC market with VSA Scanner (described in Related Ideas) which will show where we have the current Demand and Supply in real time on BTC. Analyzes of Intraday BTC and other instruments are also available to those who know where look for them ;) Good luck on the markets - especially in these uncertain times!

Bear Flag vs Bull TrapLast 2 weeks have been bearish through APPL and TSLA earnings. Attention now turns to Amazon earnings (feb2) as they teeter on oversold RSI and below 2yr support. Not regaining this support from bad earnings will likely see this S&P bearish flag breakout to the downside.
Canadians wielding pitchforks and torches, Russia and nato saber rattling and China facing off with covid olympics, I’m not feeling too bullish this week.
There were some positive flows in futures Friday morning that ended with a strong rally to end the week in a better position for a gap up Monday to lower negative gamma range above 4475 and a floor of 4400.
Gamma Exposure (GEX) from SPX options tool I created on my website. Head over to www.spyvsgme.com for delayed quotes (15-min delay from CBOE). I’ll be adding more information as I create more options indicators going forward.
I’m going to be cautious and enter a short below 4300 on heavy selling, otherwise I think the market waits for AMZN earnings for guidance in the 4475-4400 range.
Not a very high likelihood of this bearish flag playing out, but with all the damage done to markets the last 2 weeks I’m staying mostly liquid and riding the waves up and down.
>>Not Financial Advice.<<
I have never solved the rubik’s cube.

GAMMA GAMMA GAMMA GAMMELEONBoy George this week has been nuts.
I haven't had as much time to work on the GEX tool as I had hoped but I did get some work done on testing it.
Check it out at www.spyvsgme.com
A lot of gamma exposure rolled off this week and brought the gamma zero strike from 140 down to 125 and a 2.3M GEX.
Price target of 125 this week seems reasonable as total GEX has rolled positive.
Could see some relief rallies next week in the indexes as a metric ton of negative gamma exposure rolled off indexes and big names like Tesla.
Gamma Zero targets for next week look this
GME 104 -> 125
TSLA 936 -> 1045
AAPL 161 -> 165
SPY 437 -> 465
FOMC next week, if JPow remains hawkish we could see even deeper sell offs on indexes.
In that case I would be looking for lower targets. SPX still has nearly -1B GEX
GME 104 -> 100
TSLA 936 -> 900
AAPL 161 -> 160
SPY 437 -> 425
Not financial Advice. Just GEX

Scary but also beautiful BTCScary but also beautiful! How is it possible? We see clear downtrend and now it’s confirmed also by Options Sentiment indicator at the bottom (both signals aligned - more volume in Put Options than Calls (orange vertical bars) & red background showing sentiment of Options indicator. Both are Bearish now.
But when BTC will reverse (and it will happen somewhen in future) we have so many untested Virgin VPOCs to fill in! And believe me - Virgins are always retested 😉 Last but not least - check blue Volume Zone from VSA Scanner, where we’re close to its’ top edge. Reversal point? I am NOT entering Long (yet), but I keep closely observing BTC.
Options combined with VSA are complete trading suite if properly used. I've created tools available for everyone which are universal (works on multiple types of instruments). Start getting your edge in trading today!

Whispers from Options - BTCWe observe weakness/Bears dominating BTC market recently. Options Sentiment Indicator is giving mixed signals (overall we see bullish sentiment from Options traders but more volume is within PUT options still).
4 Virgin VPOCs are awaiting retest and are located above current price in comparison to 1 VPOC below current price - Bullish pressure
area of 46000 is major/key level, worth observing
from Options OrderBook of contracts expiring in 26 days (28th January 2022) - there are no strong resistance levels (!!) - Bullish pressure. However major support levels (a lot of CALL orders awaiting) are relatively low - 35,36 k
on H4 we see multiple Demand Signals coming from VSA Scanner software near 46 000 level

Pinned to 4800Not very much happening in terms of a continuation to the Santa Rally.
We did see BTC recover from its recent decline and the 3am BTD brought the futures positive.
VIX has been tame.
Not much up. Not much going down.
Slow grind to 4800 until DEC31.
Consolidation. Theta Grind.
It's a waiting game.

Cautious Optimism Into the New YearCautious Optimism best describes my feelings about how this santa rally will end.
Santa Musk continues to mess with shorts as he unwinds his options Tranches.
Is he done yet? who knows, but it's fun to watch.
As for futures, a fairly balanced day yesterday.
After the bull run we had, one should expect a cooling off period.
If RSI on the 4hr bounces off 64.5 like it did in OCTs rally
I would expect the sleigh ride to keep running through the new year.
Overnight both Bitcoin and Futures were flat.
Going into Dec 31, I was expecting weakness as a result of JPM trade
But over at SpotGamma youtube he explains a different impact.
twitter.com
TLDW: Dealers will need to cover shorts on futures. Futures go Up...
My expectations is flat today, then short squeezes and volatility into the new year.
Maybe a few more all time highs
My Observations. Not Financial Advice.
Happy New Years traders. trade smart.

Total Market ProfileVolatility Contraction Pattern Trade Closed
I closed my Volatility Contraction Pattern trade yesterday before closing. 1 reason was that bitcoin started selling off at 12pm, and I’ll get to the reason later.
SANTA RALLY
Dec27 to Jan 3rd
The Santa rally that started early (DEC20), continued into the overnight as the 3 am Buy the Dip crew continued raising the all time high bar that may continue as high as 4825 - 4865
Gamma
Spotgamma is a great source for +/- gamma information.
According to spotgammas latest tweet, all the indexes have shifted to positive gamma flows bringing even more contraction of volatility.
Note that a lot of gamma expires in SPX and other indexes DEC31 and may trigger an early end to the santa rally.
Bitcoin Correlation
I added the bitcoin difference script to this market profile chart and started adding a dot plot on the monthly low of bitcoin. You will notice bitcoin bottom shares S&P bottom for the month within 12 hours DEC3-4
Compare days like DEC 13-15 and you can see the similarities.
With that in mind, bitcoin broke trend with SPX at 12pm yesterday and began a 6.6% selloff.
Market Profile Dot Plot
I added a new dot plot to bottom of my market profile chart. The time dot plot shows the outcome of overnight 3am Buy the Dip and regular trading hours.
The 2nd line is bitcoin.
I will be adding some more dots for indicators like volatility, greed, skewness, put/call ratios, yield curve, distribution ranges and more.
The general idea will be to create a total market profile that is easy to read and provides insight for the trading days ahead.
My plan is to create a script that will automate the plots in realtime.
Disclaimer
Posts are my ideas and observations and do not constitute financial advice.

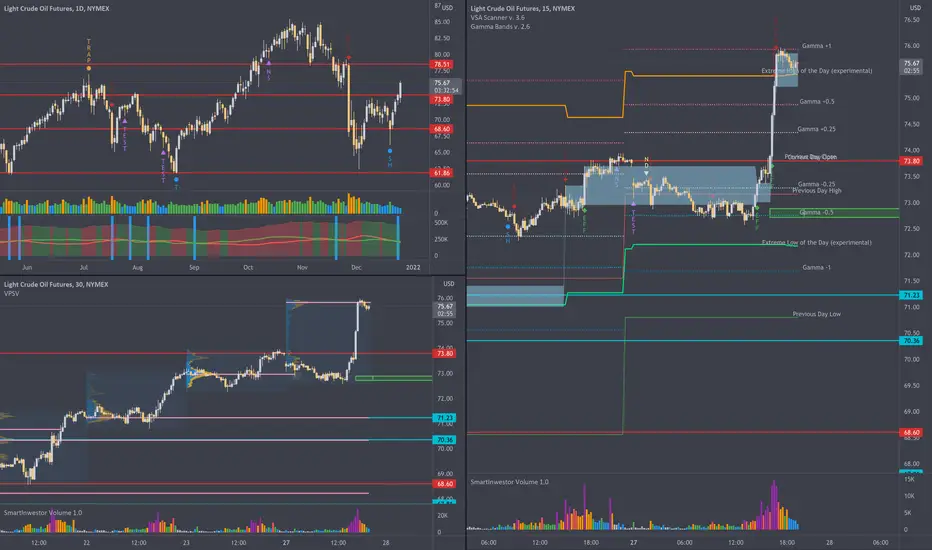
Strategy & Analysis with Options Tool suite kitToday I would like to introduce you all to process of analysis step by step instruments with usage of Options Toolkit Suite. I wrote in my earlier posts what edge can give us data obtained from Options Market. So now let's jump into details and have step-by-step detailed guide. Firstly we need chart layout split to 3, as on three different timeframes we will perform analysis and monitoring for potential trade opportunities.
Process follows:
All starts on D1 timeframe looking for key levels - where we can check Eagle-eye view perspective. Here most important is Options Flow Sentiment indicator (at the bottom) where we look for blue background - it means equal Volume on CALL and PUT options aka Balance on market is set. From those moments in time we take close of the candle/bar - and this is our significant S/R Level. If there is level too close to another one, I skip drawing it just not to make chart too noisy.
Continue on D1 timeframe checking Options flow Sentiment - also looking into sentiment indicator, I check firstly for green/red background. This is self-explanatory showing advantage of Bears or Bulls camps respectively. Then I am looking where is more money on Options flow put - if green line is above red line, it means volume of CALL Options is respectively bigger than PUT ones (aka Options traders put more money on Bullish move). In reverse works the situation for Bears, where red line is above green one.
Check for Virgin VPOCs on M30 - I am looking for untested next day VPOC levels. Those levels are always retested by market = working like a magnet. The only question is when it will happen. It's convenient to know if multiple levels are below/above current price level in order to know the balance/pressure on the market. Also for Intraday Trading, if price passes one of Gamma Levels near VPOC, we can try to trade a move with target on Virgin VPOC.
Mark Demand/Supply Zone on M30 - When we see multiple Bullish/Bearish candles in row so in other words strong impulse on market, I am looking where this move began. When I identify it, first reverse candle before this impulse sets range of Zone. Ok so jumping to example: in case of strong Bullish impulse, in the place where it started I am searching for last Bearish candle before start of this impulse. This candle's High and Low are marking range of the zone. After setting up zone, I am waiting for First Retest of this Zone . In case of Demand Zone (bullish impulse) I play in case of retest Long, in case of Supply Zone (bearish impulse), I play in case of retest Short. Very often we also can observe confluence, where within Zone or in close neighbourhood we will also have present one of Gamma levels. In case of Zone fail during 1st retest, this is also major signal but in direction of breakthrough zone.
Intraday Setups on M15 - Gamma Levels are marking key levels for observation. In general breaking through Gamma level is a signal for potential trade with target on next Gamma Level. Very rarely are passed levels Extreme Low and Extreme High of the Day which are setting typical maximum expected range of the day. Breakthrough Gamma -1/+1 is a signal of anomaly and typical for Trend Day. So if this level won't hold, then I play in direction of breakthrough. Another setup is bounce from Gamma -/+ 0.5 which is often very strong Intraday Level. In case of observed bounce back, target of the trade is Pivot (mid between Gamma -0.25 and +0.25).
Additional confluence factors - I am looking not for quantity, but for quality in case of trades - that's why I take opportunities which are having in common more factors aligned in direction of trade that I plan to take. Therefore when Gamma Level is passed and I have relatively close Virgin VPOC is one additional example. Another one would be Gamma level within or in close neighbourhood of Demand/Supply Zone. Last but not least - VSA Scanner Signals. When I see before Gamma level Demand (signals below candle/bar) or Supply (signals above candle/bar), it can add me additional confluence factor or sometimes push me to avoid taking this particular trade - when I expect Bullish move but I see instead Supply signals.
Options Medium-term Week Review Let's jump to analyse the data from Options market and scan main markets from D1 timeframe perspective:
DAX - opposite signals from Options flow, as in general we have recently present Bullish sentiment for last 3 sessions, but Option Volume flow still points to Bearish signal (as PUT Volume aka red line is higher/above CALL Volume aka green line). Virgin VPOCs are present on both sides - so above and below current price level. On last session DAX broke significant S/R Level (identified by balance point where PUT and CALL Volume were equal - my indicator is pointing such moments in time). As long as we're above 15616, price should go in direction of Virgins on 15907 and 16165. However careful observation is required further on German Index.
S&P500 - Bullish sentiment from Options flow appeared recently and CALL Volume is increasing in comparison to PUT Volume - when green line moves above red line it will confirm fully Bullish sentiment. On the other hand we have multiple Virgin VPOCs levels below current price, what add odds to Bears Camp. Major Support Area is 4477.75-4507 zone.
Gold - from quite a long time we see Bullish sentiment from Options Flow and PUT Volume should be soon lower than CALL Volume what adds confluence to Bullish move. Major Support zone is now 1783.5-1795.3 while still we have multiple Virgin VPOCs to retest above current price Level. Gold should climb up in the area of last major top on D1, around 1875.
Oil - Bullish sentiment from Options flow and recently PUT Volume reached balance vs CALL Volume. It opens road for up move. Currently we're on major resistance (73.79) so small correction could appear, but overall Oil prices should continue climb up. Next major resistance is on 78.45
Just for reference, blue lines are Virgin VPOCs and red lines are major S/R Levels marked in moment of time where PUT Volume was equal to CALL Volume from Options flow.
Options are giving us a big edge, when only we can properly analyse the data coming out of this market. My tools are analysing it and display end-results in fully objective way for newbie traders as well as for experienced ones. Please bear in mind, I am not predicting future but write assumptions only that can happen but doesn't need to. Trader need to be prepared for different scenarios.

What is going on with SPYBefore i start posting my trade ideas and charts , wanted to post this quick as its pretty current. I trade Options and the underlying. Before I make any decisions on what to trade and how to trade it, first i need to understand what is going on in the Meta indicies and how Options are positioned. This well help me understand the type of Vol to expect and what type of strategies i should be using. Heres a quick birds eye view on how SPY has been playing out

Bitcoin situation based on Options flowBitcoin is trading recently in clearly visible Trading Range, keeping investors nervous and asking question - is it Distribution or Accumulation? From Daily Timeframe we see in general Positive/Bullish sentiment from Options Traders, but it's not fully confirmed by the market yet. Going into more detailed M30, we see recent signals of incoming demand to the market identified by VSA Scanner in form of Selling Climax and Climactic Shakeout. Also Volume Area (blue rectangle on the chart identified also by Scanner) is retested from the top (top edge on 45945) what adds fuel for Bulls.
From Daily Chart we could observe also equal ratio of Put and Call options what happened several times on level 46105. This is currently our major support which needs to be kept if Bullish tendence should continue be present on BTC. From Related Idea about BTC, you can remember that level 50000 is strong Put Wall. Billions of dollars are loaded into Options with Strike Price above 50k. Around area of 50k also we have present Supply Zone (red rectangle), therefore we can expect Bullish run up to that level, then correction most likely to happen. And here will come decisive moment for both camps - Bulls and Bears. We also have present Virgin VPOC on 54890 from beginning of December, what is another confluence factor for Long.
And what only worries me, is Virgin VPOC from 30th September on 43100, which is the level below the current price (for the moment of writing analysis). Let's make some popcorn and see what happens next ;) Here comes handly VSA Scanner script, which will at earliest possibility warn us before potential Supply signals and Bears entering the market.

TSLA into Dec OPEX with 38% of gamma expiring FridayTesla $TSLA has 38.25% of gamma expiring this Friday
Breach of 908/900 would fill gap lower to 895. Previous upside nine from Jan 885 could act as support. 875 is a previous upside nine on the daily from Oct 18, bottom of that range is 850/843 and lower Fib support is near 815. MACD / RSI currently over sold with ATR expanding after selling volume came in after recent ath print. It is worth noting that major players, institutions and commercial traders are avoiding the over head risk of Elon Musk selling shares. We would want to see bulls hold these support levels and then we could focus on upside resistance as key levels to break.
Depending on repositioning in the market post Dec OPEX we could see the stock reverse or continue the price downgrade cycle. With interest rates expected to hike + EV names being generally expensive in the market, anything can happen. It is best to size light and play Tesla with profits, always expect 0 if trading weeklies and try to enter at key levels. Best of luck trading!
When the stock doesn't hold the level containing the largest OI (1000 strike) You see dealers start to offload shares as the otm calls become less risk to them.

Options Data forecasting turning points and key levelsOptions are major weapon (if properly used) in toolset of Trader. Billions of dollars each day are floating on market and speculation here is an art. Art performed by Big Guys (aka Smart Money), where funds are often significantly higher in comparison to Futures Market. With help of Machine Learning algorithms, I load Options Flow data, parse and analyse it and extract to Quandl Dataset. From there, I load it via API to Tradingview and display results in indicators. And I trade with edge instruments from Futures Market.
This data doesn't need to be always used on Intraday timeframes. We can't forget about Big Picture aka Context. From D1 timeframe alongside with properly parsed Options Data, we're able to identify real key levels (not by using Price Action but by using Balance Points, where Volume of CALL options is equal to Volume of PUT options) - marked on DAX chart with red horizontal lines. Those are close prices of candles, on which indicator identified Balance Points (blue background on indicator). Demand always is trying to reach balance with Supply - therefore that's why it's even more important to observe such levels. I personally love to play retests of those levels and breakouts - especially when they happen after at least few days since initial Balance Point.
We can't forget about Pressure. Who is dominating at the market? This is the question that traders are asking themselves each session. Based on multiple factors, like: Put/Call Ratio, Strike Prices and Expirations of Options, Volume put on Options, Type of Options (ATM, ITM or OTM) - Machine Learning is allocating weigh ratio to those factors and return result identified on indicator by green/red area. Bigger Area show stronger Imbalance on market (aka one side dominates the market).
We have so many data around us, sorry - tons of data! We are unable to parse it and get insights manually. Here Machine Learning comes handy. I encourage you to deep dive into Options Market and combine it with picture, that Market draws you via chart. Market is based on emotions, so play what you see from moves of Big Players - which in majority believe me - are present on Options market.
