#WLD/USDT Approaching Breakout After Long-Term Downtrend !#WLD
The price is moving within an ascending channel on the 1-hour frame, adhering well to it, and is on its way to breaking strongly upwards and retesting it.
We have support from the lower boundary of the ascending channel, at 1.00.
We have a downtrend on the RSI indicator that is about to break and retest, supporting the upside.
There is a major support area in green at 1.02, which represents a strong basis for the upside.
Don't forget a simple thing: ease and capital.
When you reach the first target, save some money and then change your stop-loss order to an entry order.
For inquiries, please leave a comment.
We have a trend to hold above the 100 Moving Average.
Entry price: 1.08.
First target: 1.12.
Second target: 1.157.
Third target: 1.20.
Don't forget a simple thing: ease and capital.
When you reach your first target, save some money and then change your stop-loss order to an entry order.
For inquiries, please leave a comment.
Thank you.
Gann

EURNZD Short Day Trade OANDA:EURNZD Short Day Trade - Low Risk, with my back testing of this strategy, it hits multiple possible take profits, manage your position accordingly.
Note: Manage your risk yourself, its risky trade, see how much your can risk yourself on this trade.
Use proper risk management
Looks like good trade.
Lets monitor.
Use proper risk management.
Disclaimer: only idea, not advice

NZDCHF Long Trade OANDA:NZDCHF Long Day Trade - Low Risk, with my back testing of this strategy, it hits multiple possible take profits, manage your position accordingly.
Note: Manage your risk yourself, its risky trade, see how much your can risk yourself on this trade.
Use proper risk management
Looks like good trade.
Lets monitor.
Use proper risk management.
Disclaimer: only idea, not advice

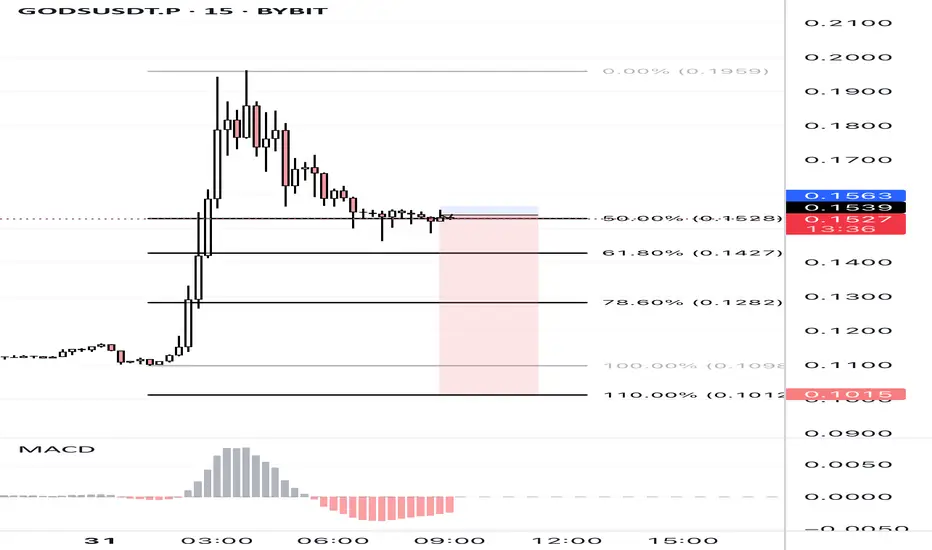
Title: GODSUSDT.P | Fibonacci Breakdown After Pump – Bearish RetGODSUSDT.P experienced a sharp upward pump followed by a strong rejection near the 0.1960 level (0.00% Fib). After failing to sustain the high, the price retraced and is currently consolidating near the 50% Fibonacci level (0.1528) on the 15m chart.
🔻 Bearish Bias Confirmed:
• MACD Histogram shows increasing bearish momentum.
• Price is struggling to reclaim 0.1563 resistance zone.
• If 0.1528 breaks, look for continuation to Fib targets:
• 61.8% (0.1427)
• 78.6% (0.1282)
• Final support near 100% - 110% zone (0.109 – 0.1015).
📊 Trade Plan:
Short entries below 0.1528 with SL above 0.1563. Targeting key Fib zones for profit booking.
⚠️ Not financial advice. Always do your own research and manage your risk accordingly.
EURUSD market structure analysis on M15, H1 timeframesH1 Timeframe – Main Trend: BULLISH
🟢 Current Situation:
The H1 structure is showing a clear sequence of Higher Highs (HH) and Higher Lows (HL) ⇒ indicating an uptrend.
The market is currently in a retracement phase following the last bullish impulse.
Price is approaching a demand zone from a previous structure, where buy orders may be stacked.
📉 M15 Timeframe – Main Trend: BEARISH (within H1 pullback)
🔍 Current Observations:
While H1 is in a retracement, M15 shows a clear bearish market structure (Lower Lows – Lower Highs).
However:
Price has tapped into the H1 demand zone.
A liquidity grab (sweep of highs/lows) just occurred on M15.
This was followed by a Break of Structure (BOS) to the upside ⇒ signaling potential absorption of sell-side liquidity and a reversal in alignment with the higher timeframe (H1).

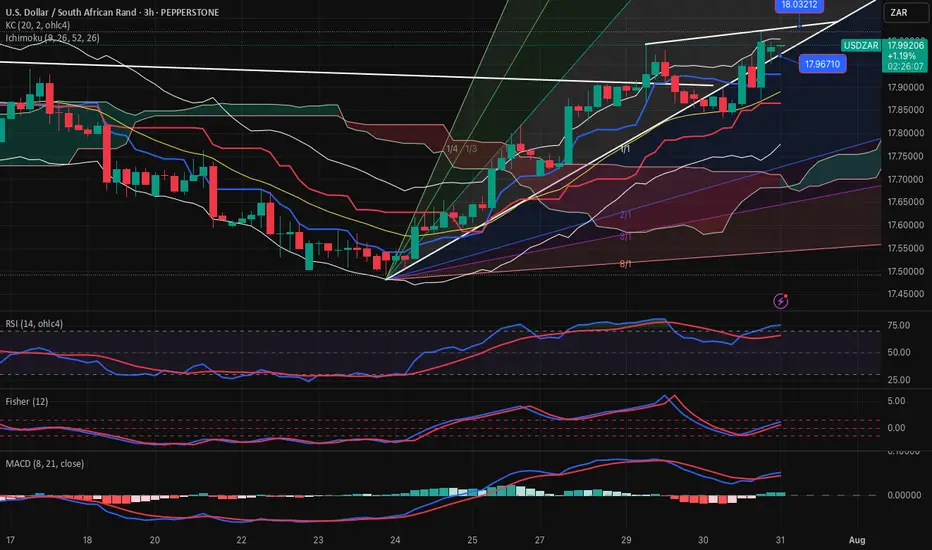
USDZAR-SELL strategy 3 hourly chart GANNThe pair has upward pressure and I suspect we will see little higher. Perhaps we may touch near 18.0500-18.0975 area, before selling pressure may set in. Since we have established 17.8500 area, it is wise to wait for the SELL. We are approaching overbought levels.
Strategy SELL @ 18.0650-18.1150 and take profit near 17.8875.
USDJPY (daily + Monthly analysis)hi everyone happy trading as always hope this video finds you some value.

Sugar Long Trade PEPPERSTONE:SUGAR Long Trade, with my back testing of this strategy, it hits multiple possible take profits, manage your position accordingly.
Note: Manage your risk yourself, its risky trade, see how much your can risk yourself on this trade.
Use proper risk management
Looks like good trade.
Lets monitor.
Use proper risk management.
Disclaimer: only idea, not advice

Gold long from 3242LOOKING FOR LONGS AT AROUND THAT REGION.
gold looks good .
Lets wait for this to unfold.

SHIB Bullish DivergenceBINANCE:SHIBUSDT
Trade Setup:
Target 1: 0.00001335 (0.786 Fibonnaci Golden Zone).
Target 2: 0.00001391 (0.618 Fibonnaci Golden Zone).
Target 3: 0.00001430 (0.5 Fibonnaci Golden Zone).
Target 4: 0.00001597 (0 Fibonnaci).
Stop Loss: 0.00001172 (1.272 Fibonnaci).
RSI Analysis: The RSI is showing a bullish divergence, suggesting potential bullish momentum. The current RSI is around 24.02, approaching oversold territory, so caution is advised.

Crypto Trade: PEPEUSDT Long Swing Trade BINANCE:PEPEUSDT Long Swing Trade, with my back testing of this strategy, it hits multiple possible take profits, manage your position accordingly.
This is good trade, don't overload your risk like greedy, be disciplined trader.
I manage trade on daily basis.
this is good trade, lets see, don't be greedy, risk what you can afford.
Use proper risk management
Looks like good trade.
Lets monitor.
Use proper risk management.
Disclaimer: only idea, not advice

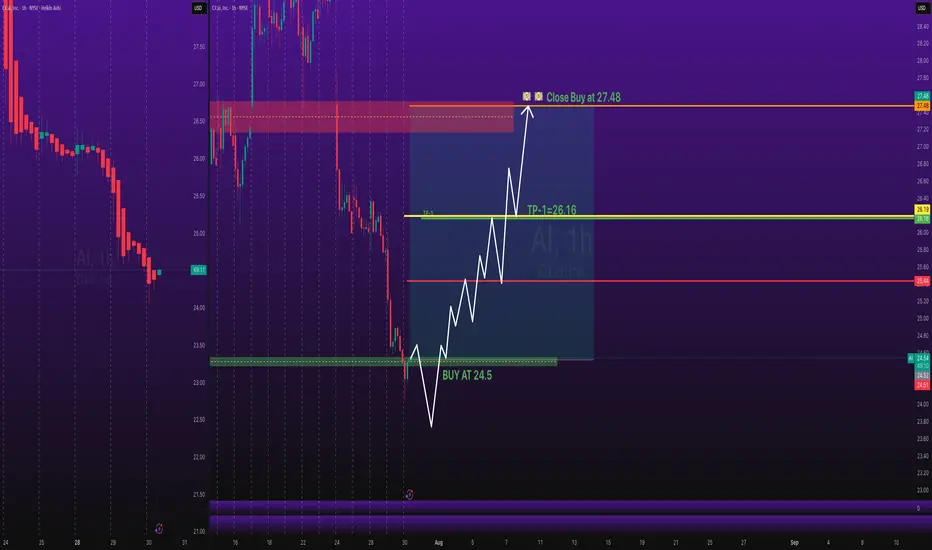
Stocks SPOT ACCOUNT: AI stocks BUT ENTRY with TAKE PROFITStocks SPOT ACCOUNT: NYSE:AI $c3.AI
stocks my buy trade with take profit.
This is my SPOT Accounts for Stocks Portfolio.
Trade shows my Buying and Take Profit Level.
Spot account doesn't need SL because its stocks buying account.
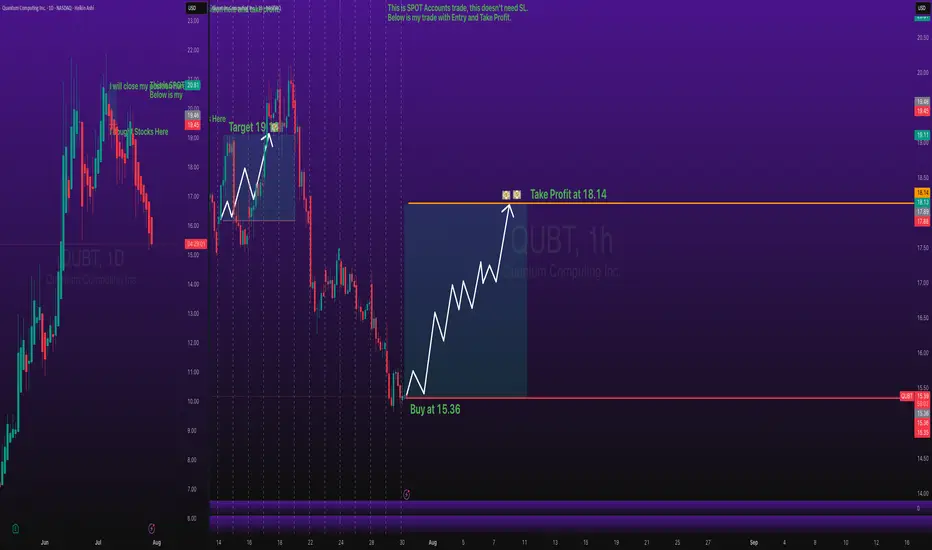
QUBT Stocks BUY Entry with Take Profit Level - Key ZonesStocks SPOT ACCOUNT: NASDAQ:QUBT stocks my buy trade with take profit.
This is my SPOT Accounts for Stocks Portfolio.
Trade shows my Buying and Take Profit Level.
Spot account doesn't need SL because its stocks buying account.
GOLD Long After Lower Dip - Catching PullbackOANDA:XAUUSD / TVC:GOLD Long Trade, with my back testing of this strategy, it hits multiple tp, here price will pullback up.
Price will bounce in this zone.
I kept SL slight big to be safe because TP levels are good so I don't want to get pushed out because of tight SL.
Note: Manage your risk yourself, its risky trade, see how much your can risk yourself on this trade.
Use proper risk management
Looks like good trade.
Lets monitor.
Use proper risk management.
Disclaimer: only idea, not advice

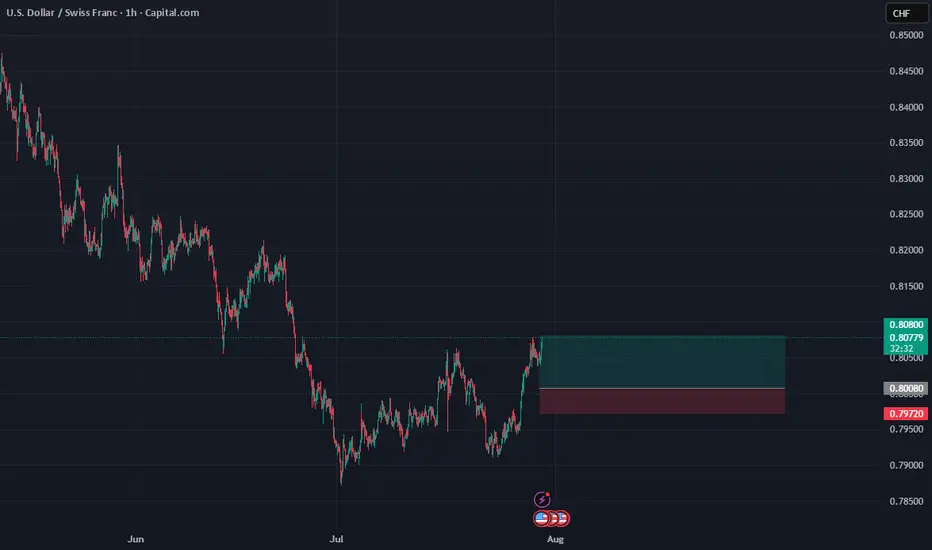
USD/CHFUSD/CHF Overview:
After a downward correction in recent weeks, the USD/CHF pair appears to be finding some support around the 0.80000 - 0.79800 levels. We are observing signs of price consolidation, which could indicate a potential bullish bounce.
Trade Details (Pending Order):
Order Type: Buy Limit
Entry Point: 0.80080
This point was chosen based on a previous support area and the price's attempt to consolidate above it.
Stop Loss (SL): 0.79720
The stop loss is located below a clear local low and below the psychological support level of 0.80000 to provide adequate protection.
Take Profit (TP): 0.80800
This level targets a retest of a previous resistance area, or as a conservative target for the first bullish bounce.
Risk Management:
Distance to Stop Loss: 36 pips (0.80080 - 0.79720)
Distance to Take Profit: 72 pips (0.80800 - 0.80080)
Risk-to-Reward Ratio (R:R): 1:2
This ratio is considered excellent and provides a good opportunity for profit compared to the potential risk.
Additional Considerations:
Traders are monitoring upcoming economic data from the United States and Switzerland.
A decisive break above 0.79720 could invalidate this idea, while a break above 0.80800 could open the door to further upside.
Disclaimer:
This is merely an analytical trading idea and is not intended as investment advice. Please manage your risk consciously and conduct your own research before making any trading decisions.
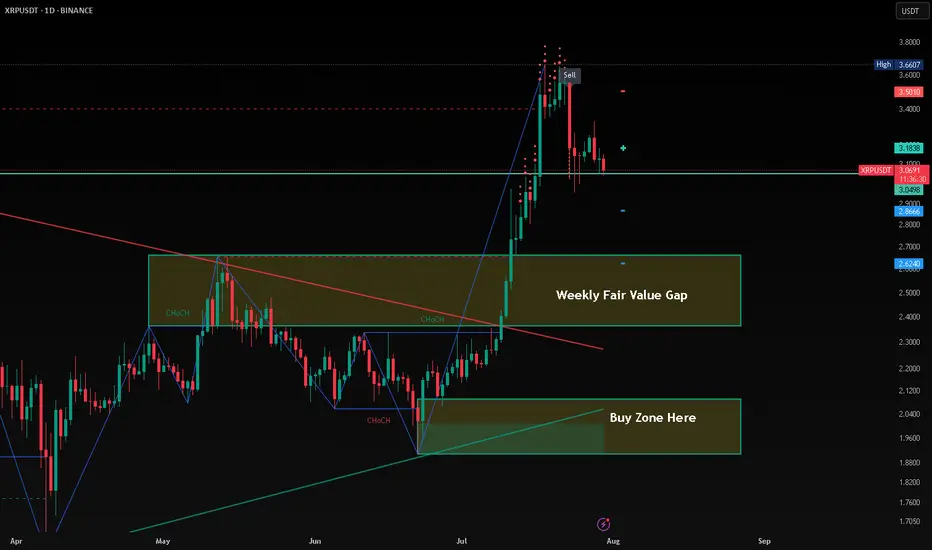
XRP Potential BuyXRP will make a huge correction before taking up. This bearish pattern will last up to October of 2025. My possible prediction Price of XRP by 2026 is $12 -$15 mark up.
GBPUSD – DAILY FORECAST Q3 | W31 | D30 | Y25📊 GBPUSD – DAILY FORECAST
Q3 | W31 | D30 | Y25
Daily Forecast 🔍📅
Here’s a short diagnosis of the current chart setup 🧠📈
Higher time frame order blocks have been identified — these are our patient points of interest 🎯🧭.
It’s crucial to wait for a confirmed break of structure 🧱✅ before forming a directional bias.
This keeps us disciplined and aligned with what price action is truly telling us.
📈 Risk Management Protocols
🔑 Core principles:
Max 1% risk per trade
Only execute at pre-identified levels
Use alerts, not emotion
Stick to your RR plan — minimum 1:2
🧠 You’re not paid for how many trades you take, you’re paid for how well you manage risk.
🧠 Weekly FRGNT Insight
"Trade what the market gives, not what your ego wants."
Stay mechanical. Stay focused. Let the probabilities work.
FX:GBPUSD

AUDUSD – DAILY FORECAST Q3 | W31 | D30 | Y25📊 AUDUSD – DAILY FORECAST
Q3 | W31 | D30 | Y25
Daily Forecast 🔍📅
Here’s a short diagnosis of the current chart setup 🧠📈
Higher time frame order blocks have been identified — these are our patient points of interest 🎯🧭.
It’s crucial to wait for a confirmed break of structure 🧱✅ before forming a directional bias.
This keeps us disciplined and aligned with what price action is truly telling us.
📈 Risk Management Protocols
🔑 Core principles:
Max 1% risk per trade
Only execute at pre-identified levels
Use alerts, not emotion
Stick to your RR plan — minimum 1:2
🧠 You’re not paid for how many trades you take, you’re paid for how well you manage risk.
🧠 Weekly FRGNT Insight
"Trade what the market gives, not what your ego wants."
Stay mechanical. Stay focused. Let the probabilities work.
FX:AUDUSD

XAUUSD: July 30th Market Analysis and StrategyGold Technical Analysis:
Daily Chart Resistance: 3351, Support: 3300
4-Hour Chart Resistance: 3340, Support: 3310
1-Hour Chart Resistance: 3334, Support: 3315.
Trading risk will increase today. We will focus on the Federal Reserve's interest rate decision and the ADP employment data, which are expected to increase market liquidity. If trading, please avoid news releases.
On the daily chart: Bollinger Bands are moving horizontally, with gold prices trading above the lower band. The MACD indicator has formed a downward death cross, indicating a release of bearish momentum. The RSI indicator has fallen back into the overbought range of 50-40, indicating a clear bottoming out and rebound in gold prices.
On the 4-Hour Chart: Bollinger Bands are narrowing, with gold prices trading near the middle band. The MACD indicator is beginning to turn upward, and the RSI is showing an oversold rebound. Gold prices are poised for an upward rebound! The NY market is focusing on the $3351 resistance level above and the $3308 support level below.
SELL: 3351near
BUY: 3315near

DXY: Bulls Are Winning! Long!
My dear friends,
Today we will analyse DXY together☺️
The in-trend continuation seems likely as the current long-term trend appears to be strong, and price is holding above a key level of 98.471 So a bullish continuation seems plausible, targeting the next high. We should enter on confirmation, and place a stop-loss beyond the recent swing level.
❤️Sending you lots of Love and Hugs❤️

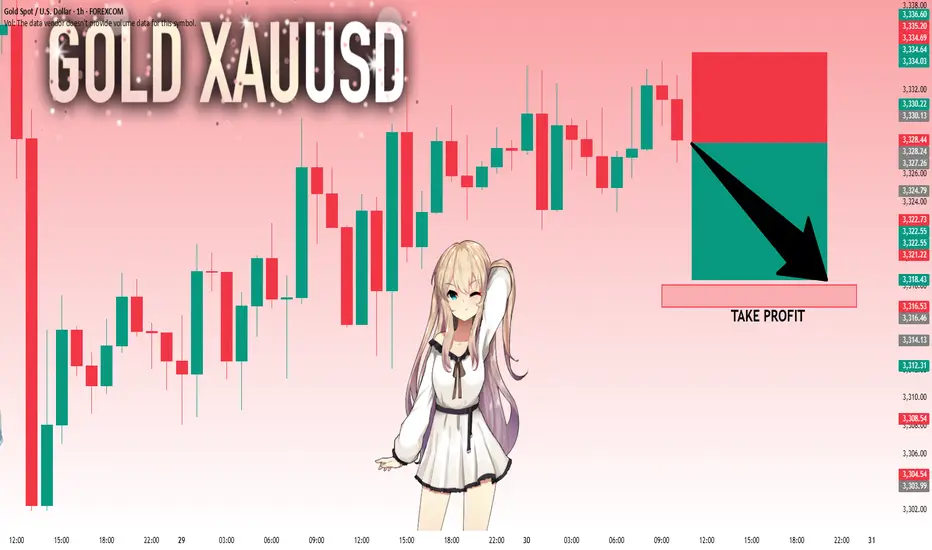
GOLD: Next Move Is Down! Short!
My dear friends,
Today we will analyse GOLD together☺️
The market is at an inflection zone and price has now reached an area around 3,328.24 where previous reversals or breakouts have occurred.And a price reaction that we are seeing on multiple timeframes here could signal the next move down so we can enter on confirmation, and target the next key level of 3,318.05..Stop-loss is recommended beyond the inflection zone.
❤️Sending you lots of Love and Hugs❤️
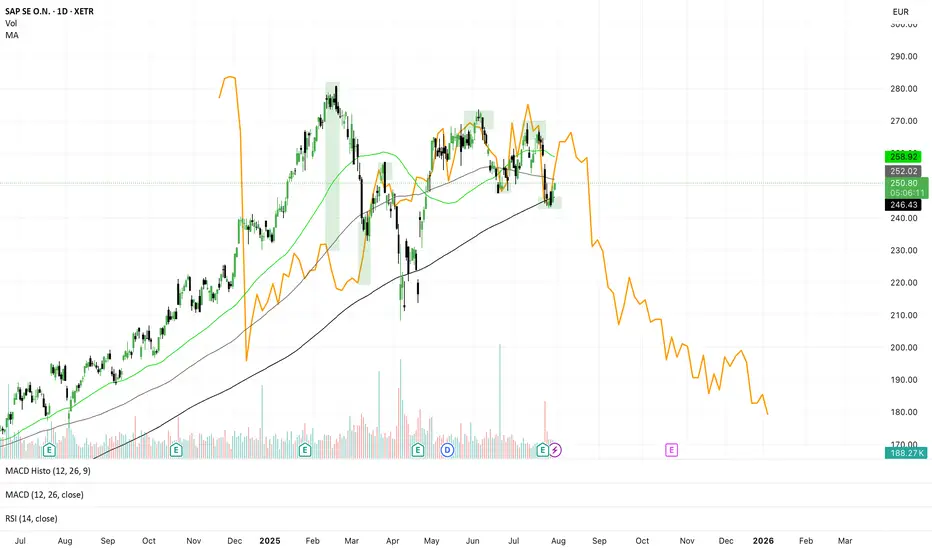
SAP Gann-Method... down potential📈 SAP SE – Gann Projection Signals Major Downside Risk
📅 July 30, 2025 | TF: Daily | Ticker: SAP.XETR
🧠 Concept
Using a historical correction (orange line) from SAP’s past — projected into the future using Gann symmetry — we might be witnessing a repeating time-price pattern. This method suggests the current market is rhyme-repeating a prior bearish phase.
🔍 Technical Highlights
🟢 Current Price: €250.60
📉 Bearish Projection (orange): suggests steep decline into Q4 2025, possibly toward €180
📊 Price reacting near MA200 (~€258) and MA50 (~€246) → tight squeeze zone
📉 MACD bearish, RSI neutral/slightly weak (~44)
📐 Gann Interpretation
The orange fractal projects an accelerated downtrend starting from this level — mirroring the structure of a previous correction in SAP.
Gann symmetry often aligns time and price harmonics, and right now:
📅 Time match: We're at a comparable point in the cycle
💶 Price zone match: Similar resistance/consolidation structure
🧭 Trade Setup
🟥 Short Bias if Breakdown Confirmed
Entry: Below €246
Targets:
▸ €225
▸ €210
▸ €185 (end of fractal projection)
Stop: above €258 (or trendline resistance)
🟩 Invalidation / Bullish Breakout
Close above €258 with strong volume
Watch for Gann failure → possible breakout to €268–€280
🧊 Risk Note
This is a fractal-based idea — not guaranteed, but supported by price structure and momentum. Confirmation from volume, RSI breakdowns, or macro catalysts is key.
EURUSD: Target Is Down! Short!
My dear friends,
Today we will analyse EURUSD together☺️
The price is near a wide key level
and the pair is approaching a significant decision level of 1.15428 Therefore, a strong bearish reaction here could determine the next move down.We will watch for a confirmation candle, and then target the next key level of 115186..Recommend Stop-loss is beyond the current level.
❤️Sending you lots of Love and Hugs❤️
