USDJPY – DAILY FORECAST Q3 | W31 | D30 | Y25📊 USDJPY – DAILY FORECAST
Q3 | W31 | D30 | Y25
Daily Forecast 🔍📅
Here’s a short diagnosis of the current chart setup 🧠📈
Higher time frame order blocks have been identified — these are our patient points of interest 🎯🧭.
It’s crucial to wait for a confirmed break of structure 🧱✅ before forming a directional bias.
This keeps us disciplined and aligned with what price action is truly telling us.
📈 Risk Management Protocols
🔑 Core principles:
Max 1% risk per trade
Only execute at pre-identified levels
Use alerts, not emotion
Stick to your RR plan — minimum 1:2
🧠 You’re not paid for how many trades you take, you’re paid for how well you manage risk.
🧠 Weekly FRGNT Insight
"Trade what the market gives, not what your ego wants."
Stay mechanical. Stay focused. Let the probabilities work.
FX:USDJPY
Gann

EURUSD – DAILY FORECAST Q3 | W31 | D30 | Y25📊 EURUSD – DAILY FORECAST
Q3 | W31 | D30 | Y25
Daily Forecast 🔍📅
Here’s a short diagnosis of the current chart setup 🧠📈
Higher time frame order blocks have been identified — these are our patient points of interest 🎯🧭.
It’s crucial to wait for a confirmed break of structure 🧱✅ before forming a directional bias.
This keeps us disciplined and aligned with what price action is truly telling us.
📈 Risk Management Protocols
🔑 Core principles:
Max 1% risk per trade
Only execute at pre-identified levels
Use alerts, not emotion
Stick to your RR plan — minimum 1:2
🧠 You’re not paid for how many trades you take, you’re paid for how well you manage risk.
🧠 Weekly FRGNT Insight
"Trade what the market gives, not what your ego wants."
Stay mechanical. Stay focused. Let the probabilities work.
FX:EURUSD

AUDCAD – DAILY FORECAST Q3 | W31 | D30 | Y25
📊 AUDCAD – DAILY FORECAST
Q3 | W31 | D30 | Y25
Daily Forecast 🔍📅
Here’s a short diagnosis of the current chart setup 🧠📈
Higher time frame order blocks have been identified — these are our patient points of interest 🎯🧭.
It’s crucial to wait for a confirmed break of structure 🧱✅ before forming a directional bias.
This keeps us disciplined and aligned with what price action is truly telling us.
📈 Risk Management Protocols
🔑 Core principles:
Max 1% risk per trade
Only execute at pre-identified levels
Use alerts, not emotion
Stick to your RR plan — minimum 1:2
🧠 You’re not paid for how many trades you take, you’re paid for how well you manage risk.
🧠 Weekly FRGNT Insight
"Trade what the market gives, not what your ego wants."
Stay mechanical. Stay focused. Let the probabilities work.
FX:AUDCAD

AUDJPY – DAILY FORECAST Q3 | W31 | D30 | Y25
📊 AUDJPY – DAILY FORECAST
Q3 | W31 | D30 | Y25
Daily Forecast 🔍📅
Here’s a short diagnosis of the current chart setup 🧠📈
Higher time frame order blocks have been identified — these are our patient points of interest 🎯🧭.
It’s crucial to wait for a confirmed break of structure 🧱✅ before forming a directional bias.
This keeps us disciplined and aligned with what price action is truly telling us.
📈 Risk Management Protocols
🔑 Core principles:
Max 1% risk per trade
Only execute at pre-identified levels
Use alerts, not emotion
Stick to your RR plan — minimum 1:2
🧠 You’re not paid for how many trades you take, you’re paid for how well you manage risk.
🧠 Weekly FRGNT Insight
"Trade what the market gives, not what your ego wants."
Stay mechanical. Stay focused. Let the probabilities work.
FX:AUDJPY

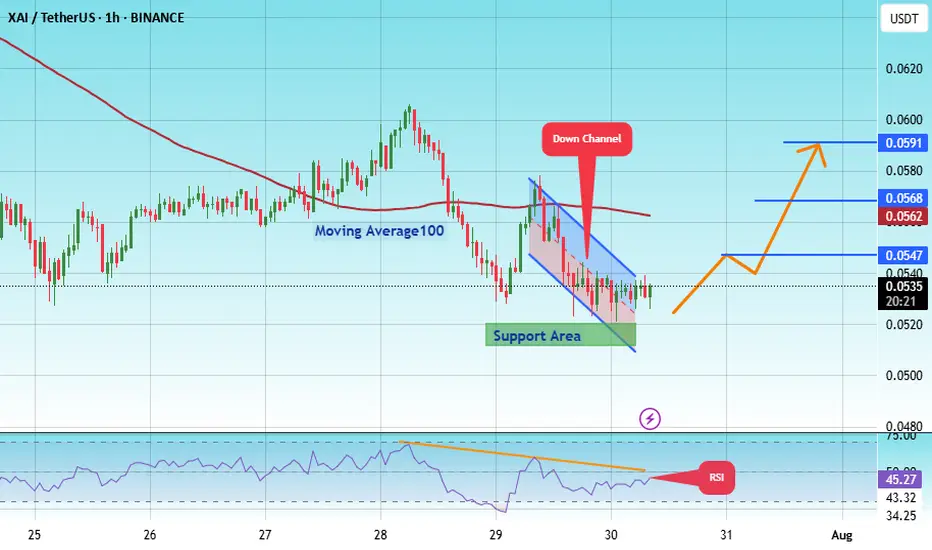
#XAI/USDT breakout Buy breakout,#XAI
The price is moving within an ascending channel on the 1-hour frame, adhering well to it, and is on its way to breaking strongly upwards and retesting it.
We have support from the lower boundary of the ascending channel, at 0.0511.
We have a downtrend on the RSI indicator that is about to break and retest, supporting the upside.
There is a major support area in green at 0.0513, which represents a strong basis for the upside.
Don't forget a simple thing: ease and capital.
When you reach the first target, save some money and then change your stop-loss order to an entry order.
For inquiries, please leave a comment.
We have a trend to hold above the 100 Moving Average.
Entry price: 0.0591.
First target: 0.0547.
Second target: 0.0568.
Third target: 0.0591.
Don't forget a simple thing: ease and capital.
When you reach your first target, save some money and then change your stop-loss order to an entry order.
For inquiries, please leave a comment.
Thank you.
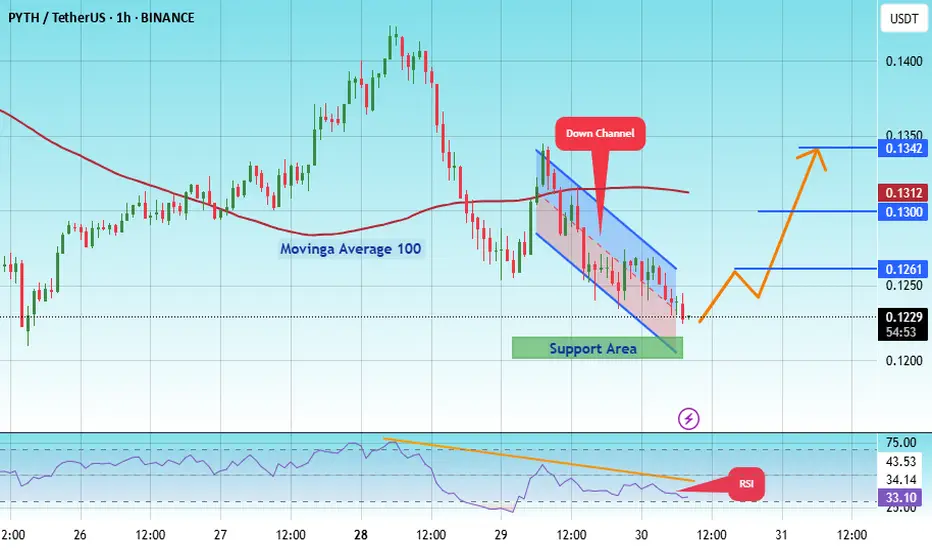
#PYTH/USDT#PYTH
The price is moving within an ascending channel on the 1-hour frame, adhering well to it, and is on track to break it strongly upwards and retest it.
We have support from the lower boundary of the ascending channel, at 1215.
We have a downtrend on the RSI indicator that is about to break and retest, supporting the upside.
There is a major support area in green at 0.1200, which represents a strong basis for the upside.
Don't forget a simple thing: ease and capital.
When you reach the first target, save some money and then change your stop-loss order to an entry order.
For inquiries, please leave a comment.
We have a trend to hold above the 100 Moving Average.
Entry price: 0.1230
First target: 0.1261
Second target: 0.1300
Third target: 0.1342
Don't forget a simple thing: ease and capital.
When you reach your first target, save some money and then change your stop-loss order to an entry order.
For inquiries, please leave a comment.
Thank you.
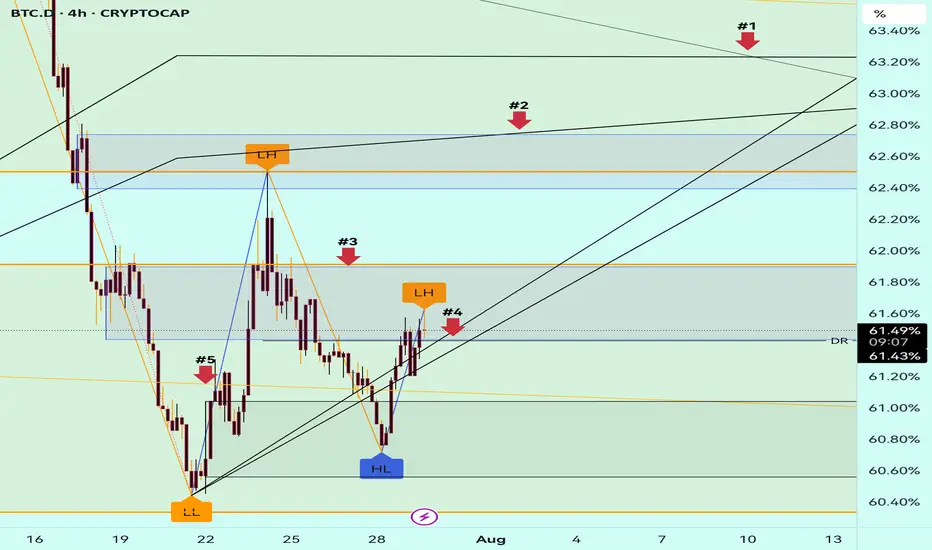
#BTC.D Update 29.07.2025BTC Dominance is trying to break above the black resistance lines, but honestly, I don't see enough strength yet to confirm a full reversal. On the daily timeframe, it’s still holding a strong downtrend structure. 🟥
🔍 If price manages to break above Arrow #4, we still have a key resistance at Arrow #3, which won’t be easy to pass.
On the lower timeframes, there are already a few bearish signs forming — but nothing solid enough yet for confirmation.
⚠️ That’s why I prefer to wait for today's daily candle to close before making any new decisions. There's also a chance BTC.D may retest Arrow #3 before reversing again.
💡 What does this mean for us?
It’s not time to jump in just yet — but the moment is getting closer, Insha Allah. If this dominance starts to turn down again, we could soon see ALTCOINS shine once more! 🌟
📈 Be ready. Stay focused. Patience pays in this game. 🚀
Altseason might just be warming up!
ACTB I Weekly CLS High In play I Clean Break OutFresh Crypto Analysis— if you’ve been riding with me, you already know:
🎯My system is 100% mechanical. No emotions. No trend lines. No subjective guessing. Working all timeframes. Just precision, structure, and sniper entries.
🧠 What’s CLS?
It’s the real smart money. The invisible hand behind $7T/day — banks, algos, central players.
📍Model 1:
HTF bias based on the daily and weekly candles closes,
Wait for CLS candle to be created and manipulated. Switch to correct LTF and spot CIOD. Enter and target 50% of the CLS candle.
For high probability include Dealing Ranges, Weekly Profiles and CLS Timing.
Analysis done on the
“Adapt what is useful. Reject whats useless and add whats is specifically yours.”
David Perk aka Dave FX Hunter
💬 Comment any Coin I ll give you my quick view

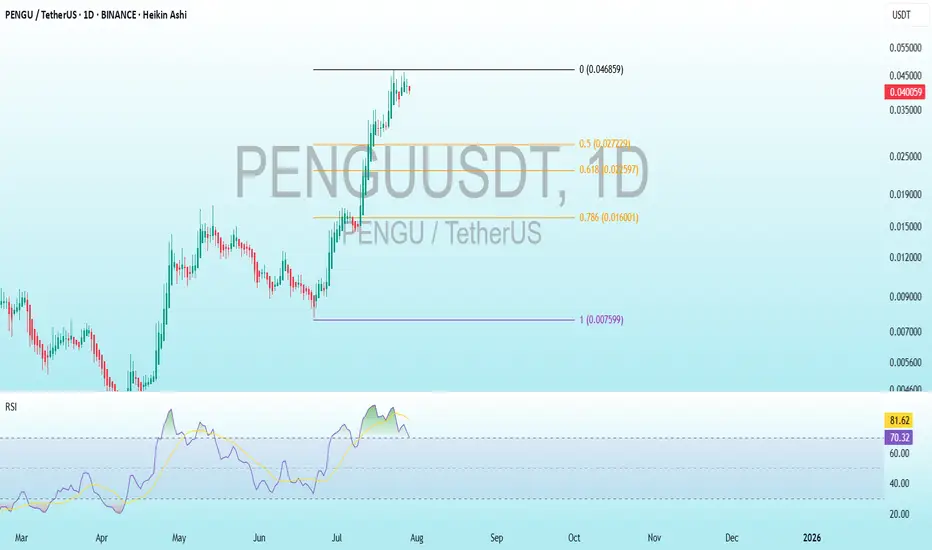
PENGU Bearish DivergenceBINANCE:PENGUUSDT
Support Levels: 0.027229 (recent low, first target for a drop).
0.007599 (deeper support, longer-term target).
Resistance: 0.046859 (recent high, potential stop loss level).
Trade Setup:
Target 1: 0.027229 (short-term, ~25% drop).
Target 2: 0.022597 (mid-term, ~50% drop if bearish trend strengthens).
Target 3: 0.016001 (long-term, ~25% drop).
Stop Loss: 0.007599 (above recent high, ~25% above current price).
RSI Analysis: The RSI shows a bullish divergence (price making lower lows while RSI makes higher lows), suggesting potential upward momentum. Current RSI is around 70.30, nearing overbought territory (>70), so caution is advised.
XAUUSDDaily still on a uptrend.
Major player are on vacations ...
H4 its on a consolidation
Advice: Wait

DAX: Local Bearish Bias! Short!
My dear friends,
Today we will analyse DAX together☺️
The in-trend continuation seems likely as the current long-term trend appears to be strong, and price is holding below a key level of 24,252.78 So a bearish continuation seems plausible, targeting the next low. We should enter on confirmation, and place a stop-loss beyond the recent swing level.
❤️Sending you lots of Love and Hugs❤️

GOLD: Strong Growth Ahead! Long!
My dear friends,
Today we will analyse GOLD together☺️
The market is at an inflection zone and price has now reached an area around 3,321.22 where previous reversals or breakouts have occurred.And a price reaction that we are seeing on multiple timeframes here could signal the next move up so we can enter on confirmation, and target the next key level of 3,329.97.Stop-loss is recommended beyond the inflection zone.
❤️Sending you lots of Love and Hugs❤️
EURUSD: Will Go Up! Long!
My dear friends,
Today we will analyse EURUSD together☺️
The price is near a wide key level
and the pair is approaching a significant decision level of 1.15675 Therefore, a strong bullish reaction here could determine the next move up.We will watch for a confirmation candle, and then target the next key level of 1.16318.Recommend Stop-loss is beyond the current level.
❤️Sending you lots of Love and Hugs❤️

SILVER: The Market Is Looking Down! Short!
My dear friends,
Today we will analyse SILVER together☺️
The recent price action suggests a shift in mid-term momentum. A break below the current local range around 38.167 will confirm the new direction downwards with the target being the next key level of 37.976 .and a reconvened placement of a stop-loss beyond the range.
❤️Sending you lots of Love and Hugs❤️

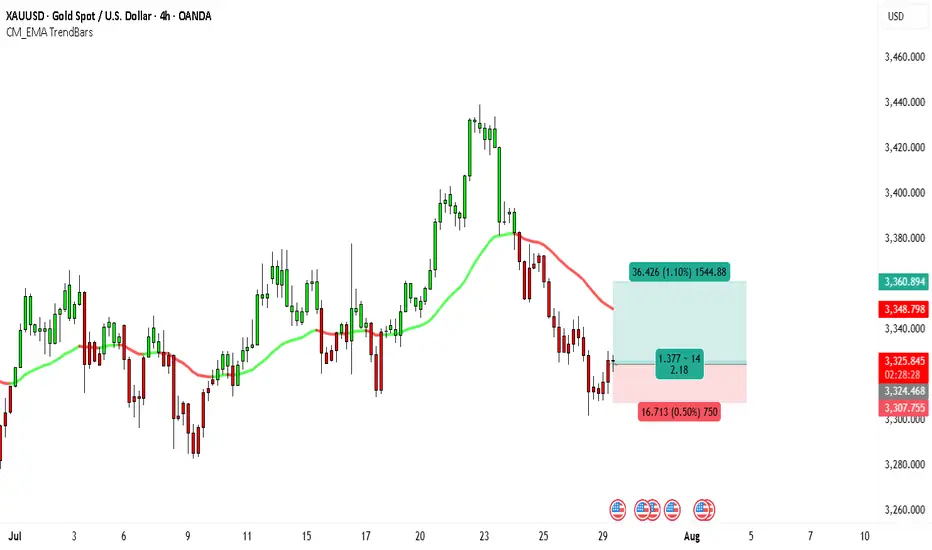
Gold Eyes $3,360 — Is This the Next Breakout?Looking at the 4H chart of XAUUSD, the price appears to be stabilizing after a period of decline, with selling pressure showing signs of exhaustion. The recent candles have smaller bodies, reflecting indecision from sellers and potential accumulation from buyers. Price is holding above the key horizontal support zone around 3,307–3,324, an area that has acted as a strong demand zone in the past. Each time the market dipped into this region, buyers stepped in, which gives the current structure a bullish undertone.
The EMA from your CM EMA TrendBars indicator has flattened out after a downward slope, suggesting that bearish momentum is losing strength. Price is also attempting to retest above this EMA, which, if achieved and maintained, could trigger further buying interest. This aligns with a possible short-term double-bottom pattern forming around 3,307, a common reversal setup if confirmed by a break above nearby resistance levels.
On the broader scale, gold has been in an overall macro uptrend for months. This recent weakness on the 4H chart could simply be a corrective pullback before another leg higher, rather than the start of a prolonged downtrend. If bulls can reclaim the EMA and hold above 3,348, the upside potential opens toward the 3,360 area and potentially higher.
Trading Setup
• Entry: Around 3,324.90
• Target: 3,360.89 (+1.10% / +36.4 USD)
• Stop Loss: 3,307.75 (-0.50% / -16.7 USD)
• Risk-to-Reward Ratio: ≈ 2.18
This setup offers more than double the potential reward compared to the risk, which fits well with a bullish bias. A decisive close above the EMA would serve as further confirmation for the trade.
SOLUSD Good Buying Price - Target Weekly ZoneBINANCE:SOLUSDT pullback to weekly level, buying price is good and cheap
Note: Manage your risk yourself, its good trade, see how much your can risk yourself on this trade.
Don't be greedy.
Use proper risk management
Looks like good trade.
Lets monitor.
Use proper risk management.
Disclaimer: only idea, not advice

XAUUSD: Market Analysis and Strategy for July 29Gold Technical Analysis:
Daily chart resistance: 3345, support: 3285
4-hour chart resistance: 3340, support: 3300
1-hour chart resistance: 3330, support: 3308.
After last week's sharp decline, gold continued its decline yesterday, breaking below its opening low and continuing its downward trend, reaching a low near 3300. In the short term, selling pressure is strong, but the rebound is weak, with a rebound high of 3330.
In terms of intraday trading, yesterday's low of 3301 was followed by a rebound. Focus on the resistance range of 3330-3338. Selling is recommended if the price is trading sideways between 3330-3338, with a defense of 3340. If it falls below 3300, the next target will be 3285.
Sell: 3338
Buy: 3302
Sell: 3300

XRPUSDT Buy Pullback to Weekly LevelBINANCE:XRPUSDT pullback to weekly level.
Note: Manage your risk yourself, its good trade, see how much your can risk yourself on this trade.
Don't be greedy.
Use proper risk management
Looks like good trade.
Lets monitor.
Use proper risk management.
Disclaimer: only idea, not advice

EURAUD Long - Pullback from Monthly Support - Easy MoneyOANDA:EURAUD Long Trade.
EURUSD is Bouncing Back from Monthly Support.
Note: Manage your risk yourself, its risky trade, see how much your can risk yourself on this trade.
Don't be greedy.
Use proper risk management
Looks like good trade.
Lets monitor.
Use proper risk management.
Disclaimer: only idea, not advice

AUDUSD – DAILY FORECAST Q3 | W31 | D29 | Y25📊 AUDUSD – DAILY FORECAST
Q3 | W31 | D29 | Y25
Daily Forecast 🔍📅
Here’s a short diagnosis of the current chart setup 🧠📈
Higher time frame order blocks have been identified — these are our patient points of interest 🎯🧭.
It’s crucial to wait for a confirmed break of structure 🧱✅ before forming a directional bias.
This keeps us disciplined and aligned with what price action is truly telling us.
📈 Risk Management Protocols
🔑 Core principles:
Max 1% risk per trade
Only execute at pre-identified levels
Use alerts, not emotion
Stick to your RR plan — minimum 1:2
🧠 You’re not paid for how many trades you take, you’re paid for how well you manage risk.
🧠 Weekly FRGNT Insight
"Trade what the market gives, not what your ego wants."
Stay mechanical. Stay focused. Let the probabilities work.
FX:AUDUSD

NZDUSD Short SwingOANDA:NZDUSD Short Swing Trade, with my back testing of this strategy, it hits multiple possible take profits, manage your position accordingly.
This is good trade, don't overload your risk like greedy, be disciplined trader.
I manage trade on daily basis.
this is good trade, lets see, don't be greedy, risk what you can afford.
Use proper risk management
Looks like good trade.
Lets monitor.
Use proper risk management.
Disclaimer: only idea, not advice

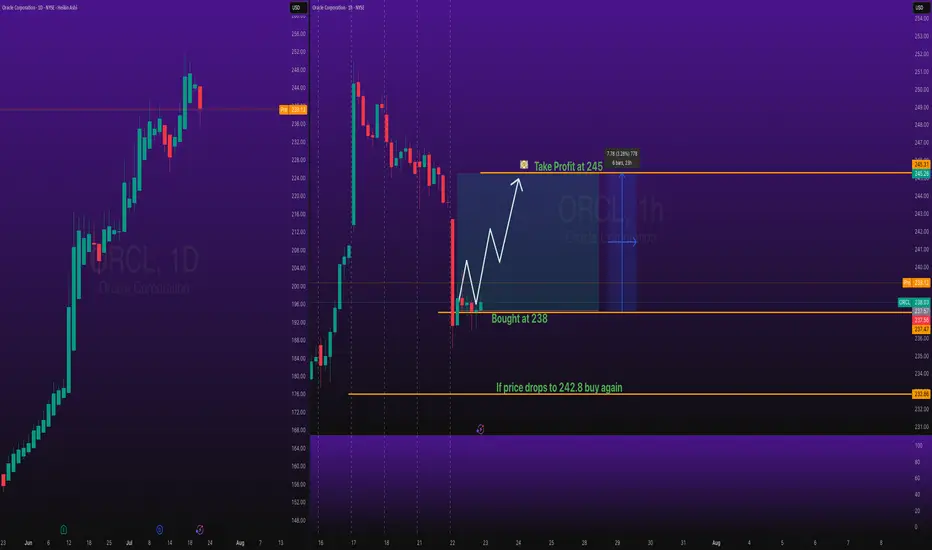
Oracle Buy Trade with Take Profit Stocks SPOT ACCOUNT:
NYSE:ORCL stocks my buy trade with take profit.
This is my SPOT Accounts for Stocks Portfolio.
Trade shows my Buying and Take Profit Level.
Spot account doesn't need SL because its stocks buying account