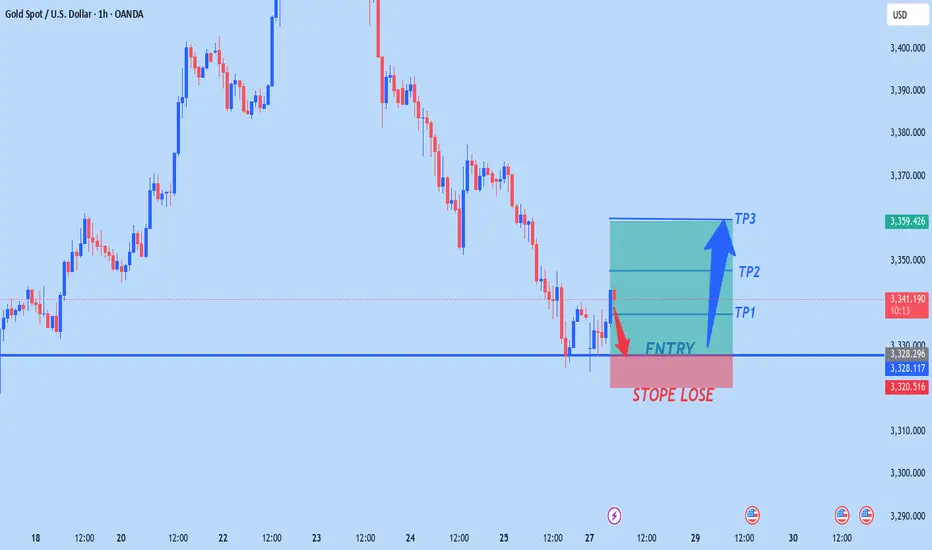
XAUUSD NEW OUTLOOKXauusd buy from 3328
Tp1 3338
Tp2 3348
Tp3 3360
Stope lose 3320
TRADE AT YOUR OWN RISK
Gann
EUR/USD – Testing Premium Zone, ECB & USD Macro Drive Next MoveEUR/USD – Testing Premium Zone, ECB & USD Macro Drive Next Move
EUR/USD is consolidating near 1.1770–1.1780, right inside the premium liquidity zone (0.786–0.886 Fib) and just below the Weak High at 1.1830. This level is critical for the next directional move.
Macro Landscape
ECB paused at 2.0% after eight consecutive cuts but may ease again in late 2025 as inflation trends toward 1.4% (ECB, 2025).
USD remains under pressure on expectations of Fed cuts, high fiscal deficits, and tariff concerns, creating a medium-term bias toward EUR strength (Reuters, 2025).
EU–U.S. trade deal at 15% tariff base reduces downside risks but does not fully remove growth headwinds (OECD, 2025).
Technical Outlook
Key Resistance: 1.1780–1.1830 (premium zone).
Upside Targets: 1.1905 (N) and 1.2085 (V) on breakout.
Support: 1.1680–1.1630 (Cloud/Kijun) and 1.1500 pivot for mean reversion.
VolanX DSS Signal:
Score: 58/100 (Neutral-to-Bullish)
Trend remains constructive but premium levels suggest a possible pullback unless the pair clears 1.1835 with momentum.
Plan:
Watch for a fade setup at 1.178–1.183 with stops >1.184.
A confirmed breakout above 1.1835 opens a run toward 1.19–1.21.
#EURUSD #Forex #MacroStrategy #ECB #CurrencyMarkets #TradingView
For educational purposes only. Not financial advice.

MEBL - PSX - Technical AnalysisMEBL is in sideways for almost seven months now. It is very much likely to continue in that fashion as interest rates cut is expected further.
Therefore, buy on parallel channel's bottom and sell on its top is recommended.
GANN support & Resistance fanes and Fib retracement tools have been used. Price has honoured both GANN and Fibonacci for this SCRIPT. Therefore, one can draw confluence while taking trades in this SCRIPT.
RSI is at a mid-range emphasizing on continuation of small uptrend and then fall down. KVO is also a bit bullish (above Zero), but KVO indicator line has crossed its trigger line as well which may hint at price going up.
Trade Values
Scenario ONE:
Buy-1 (Mkt): 246.64
TP: 271.75
Scenario TWO:
Buy-2: 284 (If price breaks the resistance)
TP-2: 327
Stop Loss: 207

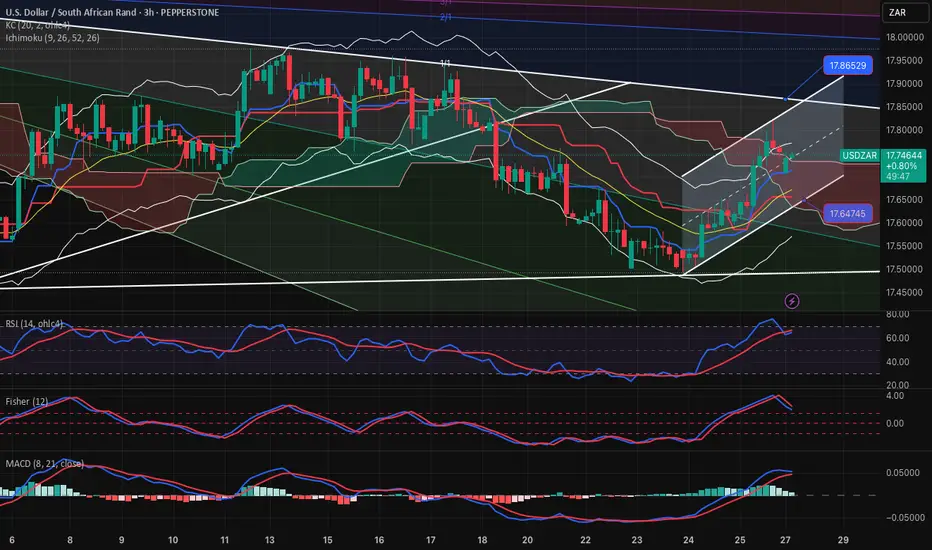
USD-ZAR-NEUTRAL RANGE 3 hourly chartThe pair is locked in between the large range 17.60-17.90 and we are consolidating within this range.
For now I prefer to play from range side, and will buy or sell near the bottom or top of it.
NYA chart Posted The signal for the Top is hours away .7/24/7/26The chart posted is my work based on the golden ratio and SPIRAL calendar work .We will be hit by one of if not the highest ever solar storms from 7/24 to 7/26 I will be re shorting into this date And will look for the markets worldwide to see a massive event .I have been talking a massive earthquake and the markets to begin a drop into OCT 10 to the 20th . best of trades .Wavetimer

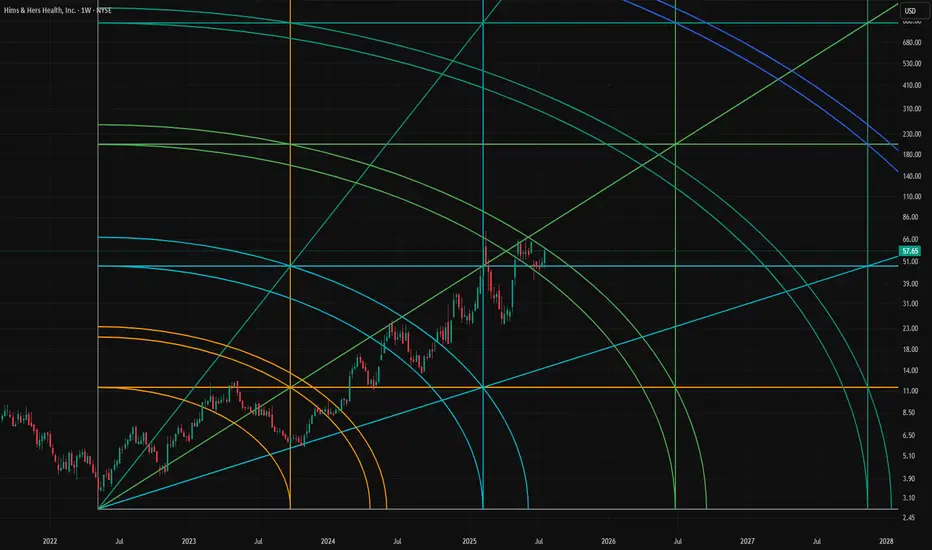
$HIMS gann arc if the arc breaks we gravitate up to the next one. This combined with a cup and handle!
ETHUSD: Strong Bullish Sentiment! Long!
My dear friends,
Today we will analyse ETHUSD together☺️
The recent price action suggests a shift in mid-term momentum. A break above the current local range around 3,826.1 will confirm the new direction upwards with the target being the next key level of 3,883.6 and a reconvened placement of a stop-loss beyond the range.
❤️Sending you lots of Love and Hugs❤️

BTCUSD: Bears Are Winning! Short!
My dear friends,
Today we will analyse BTCUSD together☺️
The in-trend continuation seems likely as the current long-term trend appears to be strong, and price is holding below a key level of 118,973 So a bearish continuation seems plausible, targeting the next low. We should enter on confirmation, and place a stop-loss beyond the recent swing level.
❤️Sending you lots of Love and Hugs❤️

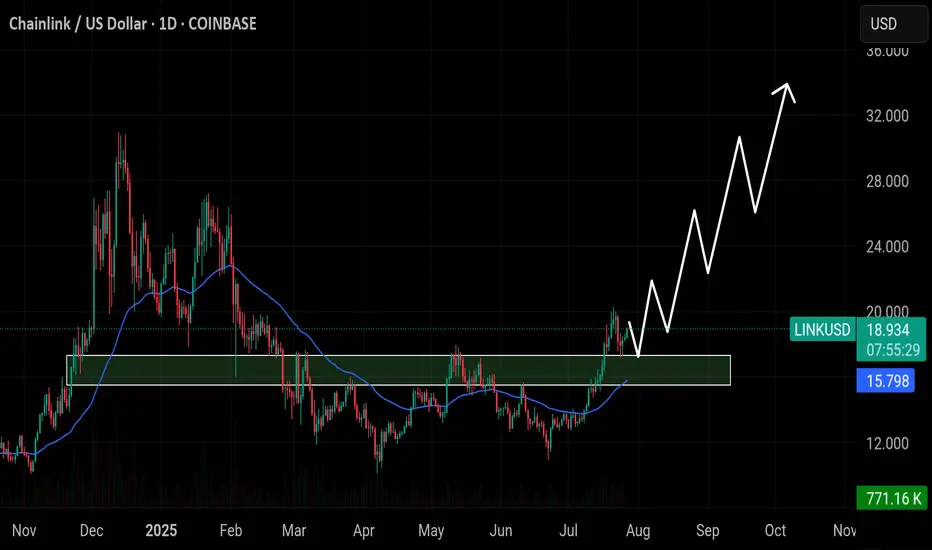
Chainlink ($LINK) has flipped the $15.80 zone into strong supporChainlink ( CRYPTOCAP:LINK ) has flipped the $15.80 zone into strong support — as long as it holds, bullish momentum could push toward $24, $28, and possibly $32 in the coming weeks.
EURJPY – WEEKLY FORECAST Q3 | W31 | Y25📊 EURJPY – WEEKLY FORECAST
Q3 | W31 | Y25
Weekly Forecast 🔍📅
Here’s a short diagnosis of the current chart setup 🧠📈
Higher time frame order blocks have been identified — these are our patient points of interest 🎯🧭.
It’s crucial to wait for a confirmed break of structure 🧱✅ before forming a directional bias.
This keeps us disciplined and aligned with what price action is truly telling us.
📈 Risk Management Protocols
🔑 Core principles:
Max 1% risk per trade
Only execute at pre-identified levels
Use alerts, not emotion
Stick to your RR plan — minimum 1:2
🧠 You’re not paid for how many trades you take, you’re paid for how well you manage risk.
🧠 Weekly FRGNT Insight
"Trade what the market gives, not what your ego wants."
Stay mechanical. Stay focused. Let the probabilities work.
OANDA:EURJPY

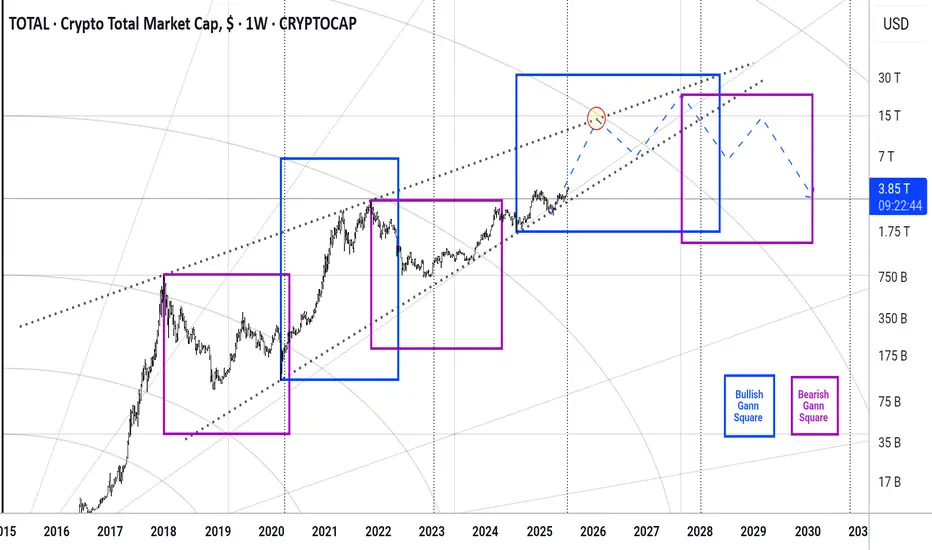
Total #002 ( Look at the Future !!! )Hello dear traders.
Good days.
First of all thanks for your comment and support.
---------------------------------------------------
In beautiful rising wedge of total market cap , the total market in this month broken 0.5 monthly Gann Square price level which means will be ready for test and retest 0.618 for final round befor market collapse.
With refer to the daily Bullish Gann Square ( Blue Square ) and Bearish Gann Square it is expected to within a year market will grow fast .
Safe trades and good luck.
AUDCAD – WEEKLY FORECAST Q3 | W31 | Y25📊 AUDCAD – WEEKLY FORECAST
Q3 | W30 | Y25
Weekly Forecast 🔍📅
Here’s a short diagnosis of the current chart setup 🧠📈
Higher time frame order blocks have been identified — these are our patient points of interest 🎯🧭.
It’s crucial to wait for a confirmed break of structure 🧱✅ before forming a directional bias.
This keeps us disciplined and aligned with what price action is truly telling us.
📈 Risk Management Protocols
🔑 Core principles:
Max 1% risk per trade
Only execute at pre-identified levels
Use alerts, not emotion
Stick to your RR plan — minimum 1:2
🧠 You’re not paid for how many trades you take, you’re paid for how well you manage risk.
🧠 Weekly FRGNT Insight
"Trade what the market gives, not what your ego wants."
Stay mechanical. Stay focused. Let the probabilities work.
FX:AUDCAD

BTC SELL?A nice short opportunity for sell on Btc/Usd.
Intraday trade.
If it get continuation BTC could drop to lower levels.
Aiming for at least 3R
Let’s see how it plays out.

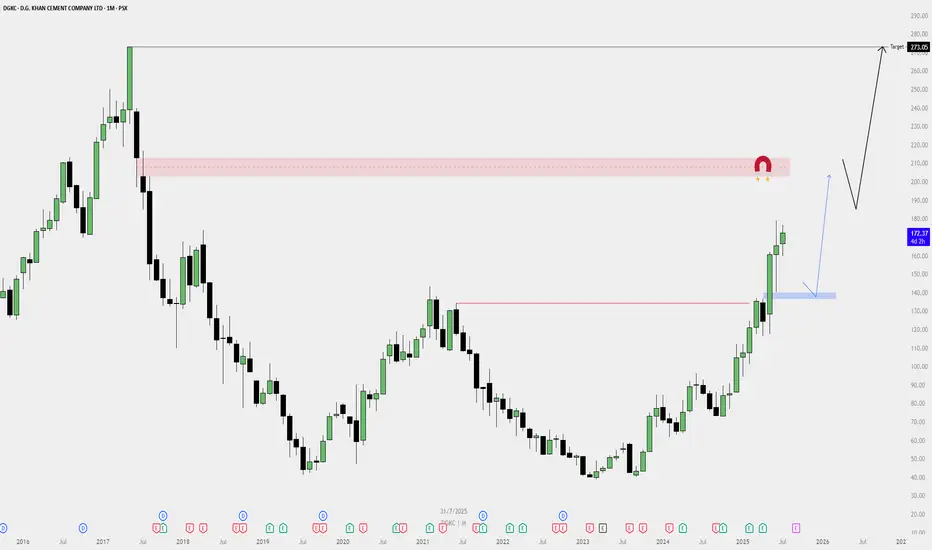
DGKC Monthly Buy Plan — Bullish Outlook📈 DGKC Monthly Buy Plan — Bullish Outlook
✅ Bias: Strongly Bullish
Price has broken major resistance levels with high momentum, forming a big bull trend on the monthly timeframe.
🔍 Key Observations:
Break of Structure:
Price broke past a major resistance zone (previous high).
Strong monthly green candles show institutional interest.
Demand Zone (Blue Box):
A fresh demand zone is formed — a possible area for pullback re-entry.
If price retests this zone, it may offer a high-probability long setup.
Liquidity Magnet Zone (Red Box):
A clear monthly imbalance / supply zone around the 210–220 range.
Could act as a temporary resistance before continuation.
Final Target:
Monthly inefficiency / liquidity target at 273.05, likely the final destination of the move.
Market structure suggests this level can be reached before any major reversal.
🔄 Plan Execution:
🔵 Scenario 1 (Pullback Entry):
Wait for a pullback to the blue demand zone.
Look for lower timeframe confirmation to enter long.
🔵 Scenario 2 (Momentum Continuation):
If price continues without deep pullback, consider smaller timeframes for continuation setups.
Do not chase price; wait for valid structure.
EURUSD 1HConsidering that the one-hour timeframe trend for the EURUSD symbol has turned bullish and liquidity has been collected at the last low, after a price correction in lower timeframes and observing a suitable candlestick setup, one can enter a buy trade and follow the price at least up to 1.18310.

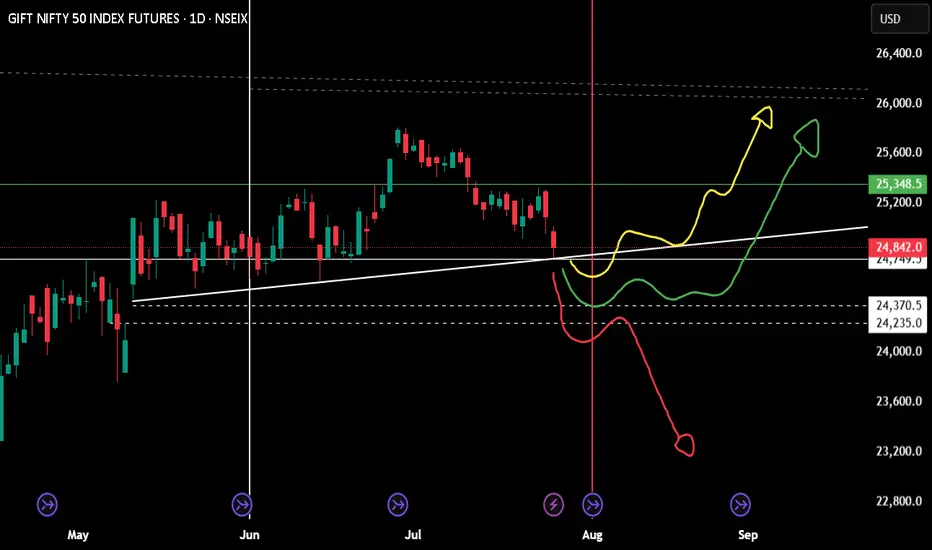
Monthly position for niftyExpecting a reversal, yes geo political and 1st August announcement will play a major role.
just wait for one day candle closing on your area.
If you wish to be on buying side (buy nifty future) a positive candle on top of the trend line.
Selling future for the month is only wise if 24k is crossed. Technically a bounce is expected and hopefully a green candle for August month.
$FARTCOIN/USDT – 4H(Not Financial Advice)
🔍 Key Technical Insights:
BOS (Break of Structure)
A clear BOS is marked near the 1.46 level, confirming a bearish market structure.
Price broke below the higher low, suggesting lower highs and lower lows in progress.
Supply Zone (Entry Region)
1.5189 – 1.5729 USDT is the defined supply zone where price is expected to react.
Current price is below this zone, indicating potential pullback entry for shorts.
Entry Strategy
Ideal short entry is upon rejection within supply, targeting previous demand zones.
Entry would be around 1.56 – 1.57 (red box top), stop just above 1.5729.
Targets
TP Zone (Demand): 1.3151
Mid-level TP: 1.4616 (prior support turned resistance)
Full TP: At the lower purple box between 1.21 – 1.31
Risk-to-Reward (RRR):
Visually, the trade setup shows an RRR > 2:1, making it favorable if rejection occurs.
🔧 Confluence & Bias
✅ BOS confirms trend shift
✅ Price rejected from premium zone
✅ Bearish candles confirming weakness
❌ No bullish market structure yet
❗ Watch for fakeouts in thin liquidity weekend

XAUUSDHigh Reisk Trade Short Planned
SL
TP
EP
Risk managment defined (risk free trade means move SL To ENtry)

Bullish case forming but is it sustainableFollowing the Vumanchu Cipher B Divergence at the bottom of my chart: every golden dot has been followed by a pump to where the last drop happened. From there on we saw a drop to form a lower low and work our way through to the previous top.
This could likely be the move that brings us to that famous 3 400 level a lot of have been wanting to at least close to continue towards a downward trend and for bulls to form a stronger support around 3 333- 3 310.
The fan fib resistance 0 towards the bearish case has been put on the 2nd lower high on that 45 minutes timeframe to create a middle balance for shorter term analysis/scalping. Same thing for the fan fib showing rebound levels for the bulls has been targeted at the 2nd high of the same time frame.
The elliot waves showed on the chart are for potential price action speculations plays only please take it with a grain of salt. You may grab the chart and delete those if you wish.
I personally will be scaling my way in for a long position and will be expecting a drop from 3 385 ish and will be waiting for PA to re-analyze my bias.
Best of luck to all

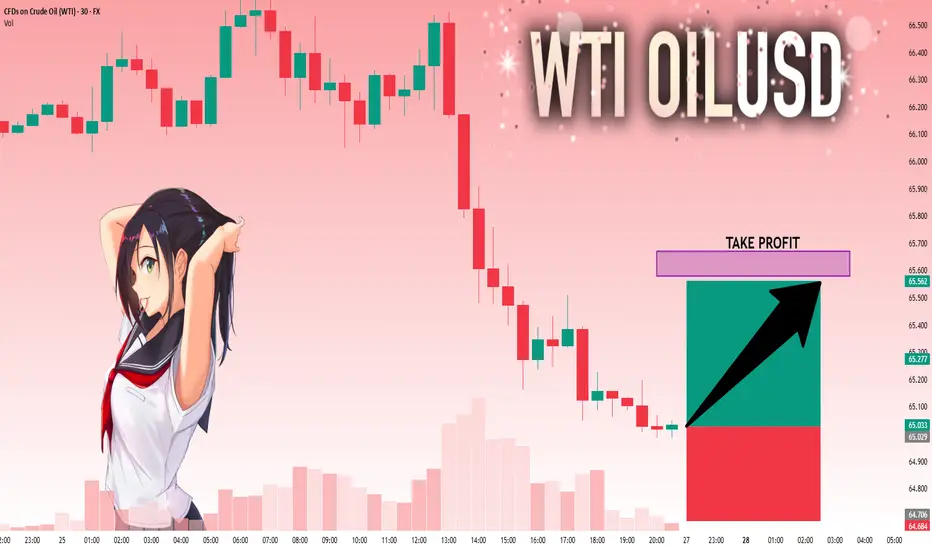
USOIL: Next Move Is Up! Long!
My dear friends,
Today we will analyse USOIL together☺️
The market is at an inflection zone and price has now reached an area around 65.029 where previous reversals or breakouts have occurred.And a price reaction that we are seeing on multiple timeframes here could signal the next move up so we can enter on confirmation, and target the next key level of 65.579.Stop-loss is recommended beyond the inflection zone.
❤️Sending you lots of Love and Hugs❤️
TOTAL 2 # 002 ( GOOD for Altcoins )Hello dear traders .
Good days .
First of all thanks for your comment and support.
----------------------------------------------------------------------
Total 2 is growing in rising wedge .
With refer to the last Daily Bullish Gann Square ( Blue Square) and Bearish Gann Square and with considering bitcoin dominance which start its correction, expected to ALTCOIN season started and it can rise up to 8-9 T dollars which is looks good opportunity for investment together great benefits within a year .
Safe trades and good luck

NG1!: Target Is Up! Long!
My dear friends,
Today we will analyse NG1! together☺️
The price is near a wide key level
and the pair is approaching a significant decision level of 3.087 Therefore, a strong bullish reaction here could determine the next move up.We will watch for a confirmation candle, and then target the next key level of 3.107.Recommend Stop-loss is beyond the current level.
❤️Sending you lots of Love and Hugs❤️

NI225: Move Down Expected! Short!
My dear friends,
Today we will analyse NI225 together☺️
The recent price action suggests a shift in mid-term momentum. A break below the current local range around 41,456.23 will confirm the new direction downwards with the target being the next key level of 40,954.70 and a reconvened placement of a stop-loss beyond the range.
❤️Sending you lots of Love and Hugs❤️
