#TRU/USDT Low Risk vs High Rewards#TRU
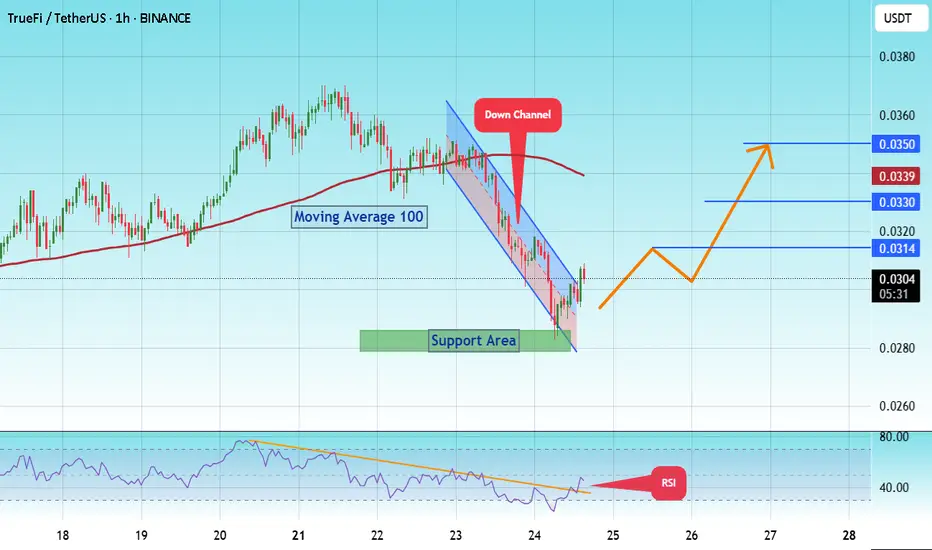
The price is moving within a descending channel on the 1-hour frame and is expected to break and continue upward.
We have a trend to stabilize above the 100 moving average once again.
We have a downtrend on the RSI indicator that supports the upward break.
We have a support area at the lower limit of the channel at 0.0285, acting as strong support from which the price can rebound.
We have a major support area in green that pushed the price upward at 0.0280.
Entry price: 0.0300
First target: 0.0314
Second target: 0.0328
Third target: 0.0350
To manage risk, don't forget stop loss and capital management.
When you reach the first target, save some profits and then change the stop order to an entry order.
For inquiries, please comment.
Thank you.
Gann
Infineon wave 3 to 62€ Gann-Methode🧠 Infineon (IFX.DE) - Massive Wave 3 in Progress 🚀 | Long-Term Elliott Wave Setup
Ticker: XETR:IFX
Exchange: XETRA 🇩🇪
Chart: Weekly (W1)
Technical Framework: Elliott Wave + Fibonacci + MA + RSI + MACD
🧩 Context:
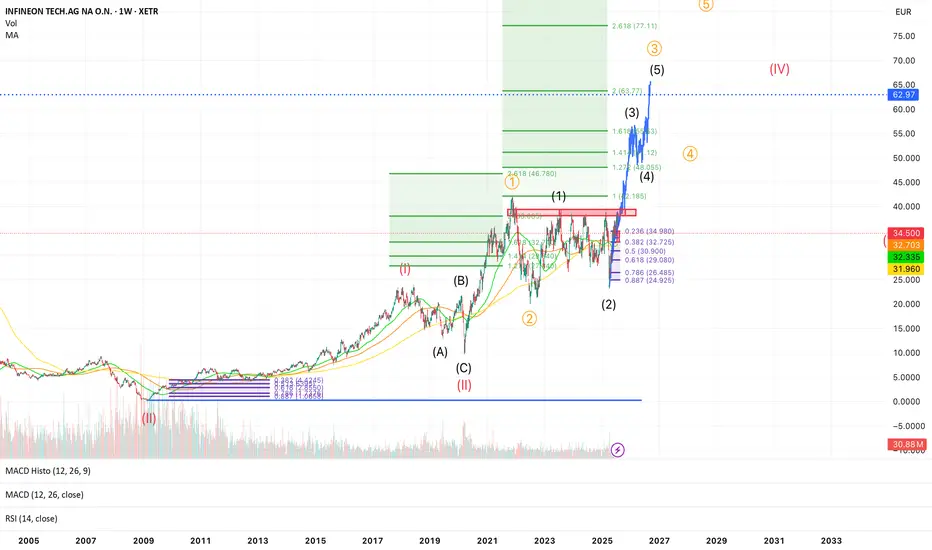
Infineon has completed a massive corrective wave II (labelled in red) and is now in the early stages of a multi-year impulsive wave III. The price recently rejected at the 0.236 retracement (~35€) and is currently back-testing key moving averages. This zone could represent a wave (2) low of the internal (1)-(2)-(3)-(4)-(5) structure of orange wave ③.
🔎 Structure Breakdown:
✅ Wave (II) (in red) ended as a WXY-Flat-Correction, possibly in 2020
✅ Wave 1 and 2 of wave (III) are complete
✅ Current projection: we are in blue wave (3) of orange wave ③
📈 Fibonacci extensions suggest:
1.618x of wave (1) = ~53.83 €
2.0x = ~63.77 €
2.618x = ~77.11 € – ultimate long-term target for wave ③
🟦 Major resistance: 35–36 €, now acting as support
🟢 Key Moving Averages:
MA (32.7), MA (32.3), MA (31.96) are clustered — strong support zone
📊 Indicators:
MACD: Turning bullish, histogram just crossed above 0
RSI: Neutral (51), still lots of upside potential
Volume: Recent spike suggests accumulation during pullback
🔔 Key Levels:
Level Description
32.7 € Strong support (Fib 0.382 + MA)
39 € Fib 0.5 retracement
46.78 € 2.618x extension of orange wave ①
53.83 € Target: 1.618x of current wave (1)
63.77 € Major resistance / Wave (3) top?
77.11 € 2.618x extension of wave ③
🧠 Thesis:
If the recent low was wave (2), Infineon could be entering a parabolic wave (3) move with +50–100% upside potential over the next 12–18 months. The setup is supported by Elliott Wave structure, MA support, and volume confirmation.
⚠️ Risks:
Breakdown below ~30 € (0.5 Fib) would challenge this count
Macro events (e.g., chip cycle, geopolitics) may affect the timing
✅ Strategy:
I’m watching for confirmation of the local low around 32 €, and then adding during retracements. Targets are scaled into at 46 €, 54 €, and 63 €. Final wave (5) of ③ may push up to 77 €.
Tron Sets Nasdaq Debut After SRM Merger as TRX Overtakes ADATron Inc., the company behind the Tron blockchain and its native TRX token, is preparing for a landmark public listing on the Nasdaq, following its surprise merger with decentralized finance protocol Serum (SRM). The announcement sent shockwaves through the market, immediately catapulting TRX ahead of ADA to become the ninth-largest cryptocurrency by market capitalization.
The newly combined entity, operating under the name Tron Integrated Technologies, has filed its Form S-1 with the SEC, and aims to go public in Q4 2025—marking one of the first blockchain-native firms to emerge from a DeFi merger and enter public markets.
A Strategic DeFi Alliance
The deal with Serum is not just symbolic. It gives Tron deep liquidity infrastructure and decentralized exchange capabilities via Serum’s smart order routing and Solana-based engine. While the Solana connection raised eyebrows, Tron confirmed that a multi-chain expansion plan is in motion, with bridges being built across Ethereum, Solana, and BNB Chain.
“The merger with SRM accelerates our roadmap by three years,” said Tron CEO Marcus Lee. “This IPO isn’t just about capital—it's about positioning TRX as the digital fuel of a multi-chain financial internet.”
TRX Surges Amid Strategic Narrative
Following the merger news, TRX surged 22% over a five-day period, pushing its market cap to over $15.6 billion, surpassing Cardano (ADA) for the first time in over 18 months. Trading volume on centralized and decentralized exchanges spiked by over 60%, fueled by both retail speculation and whale accumulation.
According to data from Glassnode, over 84% of TRX supply is now held in long-term wallets, indicating a strong conviction among holders that the Nasdaq debut could further institutionalize the token.
Regulatory Spotlight and Market Implications
Tron’s Nasdaq listing is likely to put the project under closer regulatory scrutiny, especially given its ties to Asia-based user flows and complex tokenomics. However, sources within the SEC noted that the hybrid model—combining open-source protocol governance with a publicly traded corporate entity—could set a new precedent.
“This may be the template for the next generation of compliant crypto firms,” said Leah Thomason, regulatory analyst at Beacon Partners. “It’s essentially DeFi meets Wall Street.”
Conclusion
With the Nasdaq listing on the horizon, an ecosystem-level merger with SRM, and a strategic push toward interoperability, Tron is rewriting the playbook for token-backed companies. TRX’s leap into the top 10 is more than just a chart movement—it signals that capital markets may finally be ready for integrated blockchain operators.

Buy Trade Strategy for PENGU: Betting on Meme Power and CommunitDescription:
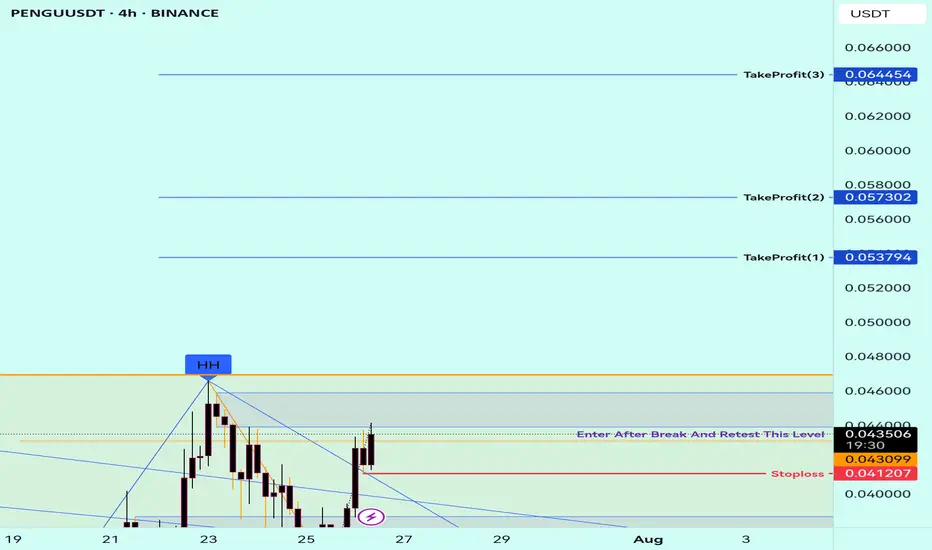
This trading idea highlights PENGU, an emerging meme-based cryptocurrency that has gained popularity through its strong community support and viral potential. Inspired by internet culture, PENGU represents more than just humor — it taps into the growing trend of community-driven tokens that generate momentum through engagement, social media buzz, and grassroots marketing. With a limited supply and increasing visibility across platforms, PENGU positions itself within a niche market where speculation, culture, and community collide.
While meme coins like PENGU can offer explosive short-term potential, they also carry high levels of risk due to their dependence on community sentiment and lack of traditional utility or fundamentals. Market dynamics can shift rapidly, and what gains popularity quickly may also fade just as fast. Therefore, any investment in PENGU should be approached with caution.
Disclaimer:
This trading idea is for educational purposes only and does not constitute financial advice. Investing in cryptocurrencies, especially meme tokens like PENGU, involves significant risk, including the potential loss of all invested capital. Always conduct thorough research, understand the speculative nature of such assets, and consult a financial advisor before making any trading decisions. Past performance is not indicative of future results.
Weekly Range for nifty (applicable till the expiry)This are mathematical calculation not based on important level of fib or support level that are derived by most of the Technical trader.
just trade the level with few point stop loss. for grabbing greater points.
please do check out sensex where few greater points are explained.

NYA Hourly 5th of the 5th If the Bull market is to advance we can NOT drop below .382 of the rally from 4/7 2025 Were I said 4835 was wave 4 in Super cycle .it is this simple Which is the 200 day avg BTW !!!!!!!best of trades WAVETIMER

WEEKLY NYA turns and E Wave see 12/8 2024 forecast The chart of the NYA I have not changed or relabeled anything since 12/8 2024 best trades WAVETIMER

USDJPY (weekly Analysis) 26/07Hi everyone the weekly analysis is now up. hope everyone has a great weekend and as always happy trading.

SPX 0DTE TRADE IDEA – JULY 25, 2025
⚠️ SPX 0DTE TRADE IDEA – JULY 25, 2025 ⚠️
🔻 Bearish Bias with Weak Volume – Max Pain Looming at 6325
⸻
📊 Quick Market Snapshot:
• 💥 Price below VWAP
• 🧊 Weak Volume
• 📉 Max Pain @ 6325 = downside pressure
• ⚖️ Mixed Options Flow = no clear bullish conviction
⸻
🤖 Model Breakdown:
• Grok/xAI: ❌ No trade – weak momentum
• Claude/Anthropic: ✅ Bearish lean, favors PUTS near highs
• Gemini: 🟡 Slightly bullish bias, BUT agrees on caution
• Llama: ⚪ Neutral → No action
• DeepSeek: ❌ Bearish → No trade
⸻
📌 TRADE IDEA:
🎯 SPX 6365 PUT (0DTE)
💵 Entry Price: $0.90
🎯 Profit Target: $1.80 (💥 2x return)
🛑 Stop Loss: $0.45
📆 Expires: Today
🕒 Exit by: 3:45 PM
📈 Confidence: 65%
⏰ Entry Timing: OPEN
⸻
⚠️ Risk Flags:
• Low volume = fragile conviction
• Possible reversal if SPX breaks above session highs
• Max pain magnet at 6325 could limit gains or induce a bounce
⸻
🧠 Strategy:
Scalp it quick. Get in early. Exit before the gamma games explode into close.
📈 Like this setup? Drop a 🔽 if you’re playing puts today!
#SPX #0DTE #PutOptions #OptionsTrading #MaxPain #SPY #MarketGamma #TradingSetup

XAUUSD: Market Analysis and Strategy for July 25Gold technical analysis:
Daily chart resistance 3400, support 3300
4-hour chart resistance 3375, support 3342
1-hour chart resistance 3350, support 3333.
Gold, starting from 3438 this Wednesday, has fallen by nearly $100. It rebounded quickly after falling to 3351 yesterday. After sideways fluctuations in the Asian session, the current price is around 3343, and the key support below is around 3333. From a spatial point of view, this wave of adjustment is nearing its end. After waiting for the adjustment to be completed, the market will most likely return to an upward trend.
The short-term top and bottom resistance at the 1-hour level is around 3351. For intraday short-term operations, the current gold price is around 3343. Pay attention to the bearish trend near 3351. If it does not break near 3333, it will be bullish again!
SELL: 3350near
BUY: 3333near

XAUUSDLongterm gold os going to 5K
Midterm 3,500
Shorterm, we going to the bottom of the consolidation.

US30: Local Bearish Bias! Short!
My dear friends,
Today we will analyse US30 together☺️
The in-trend continuation seems likely as the current long-term trend appears to be strong, and price is holding below a key level of 44,774.9 So a bearish continuation seems plausible, targeting the next low. We should enter on confirmation, and place a stop-loss beyond the recent swing level.
❤️Sending you lots of Love and Hugs❤️

GOLD: Strong Growth Ahead! Long!
My dear friends,
Today we will analyse GOLD together☺️
The market is at an inflection zone and price has now reached an area around 3,338.79 where previous reversals or breakouts have occurred.And a price reaction that we are seeing on multiple timeframes here could signal the next move up so we can enter on confirmation, and target the next key level of 3,351.09.Stop-loss is recommended beyond the inflection zone.
❤️Sending you lots of Love and Hugs❤️

EURUSD: Will Go Up! Long!
My dear friends,
Today we will analyse EURUSD together☺️
The price is near a wide key level
and the pair is approaching a significant decision level of 1.17201 Therefore, a strong bullish reaction here could determine the next move up.We will watch for a confirmation candle, and then target the next key level of 1.17348.Recommend Stop-loss is beyond the current level.
❤️Sending you lots of Love and Hugs❤️

SILVER: The Market Is Looking Down! Short!
My dear friends,
Today we will analyse SILVER together☺️
The recent price action suggests a shift in mid-term momentum. A break below the current local range around 38.780 will confirm the new direction downwards with the target being the next key level of 38.635.and a reconvened placement of a stop-loss beyond the range.
❤️Sending you lots of Love and Hugs❤️

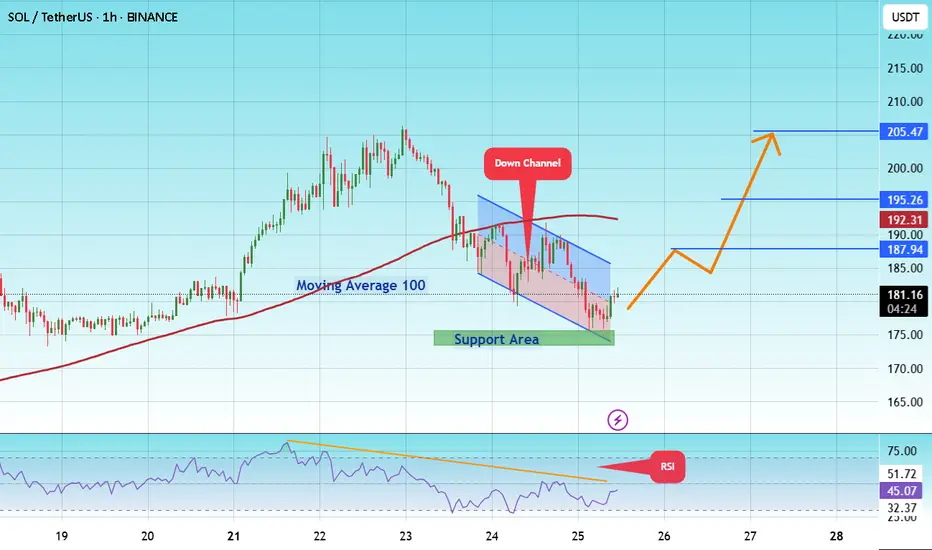
#SOL/USDT coin market structure analysis#SOL
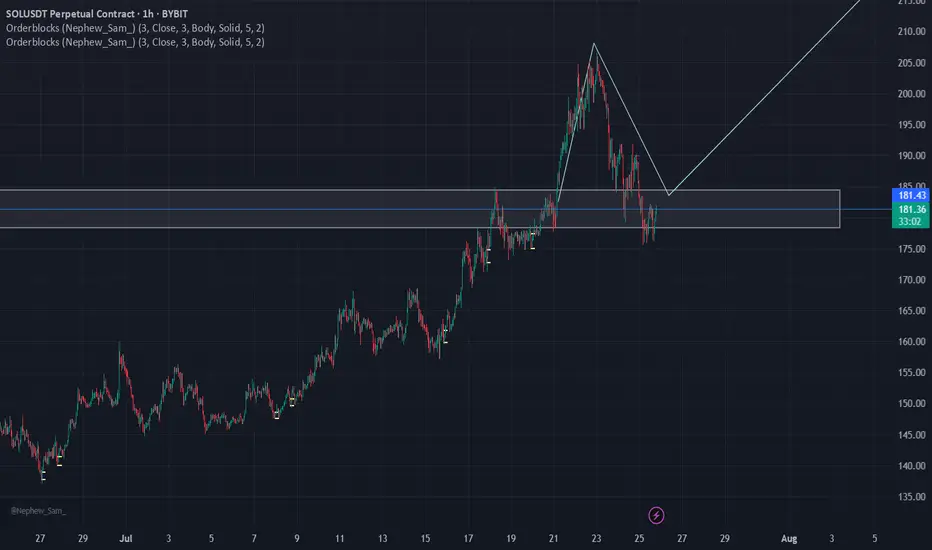
The price is moving within a descending channel on the 1-hour frame and is expected to break and continue upward.
We have a trend to stabilize above the 100 moving average again.
We have a downtrend on the RSI indicator that supports the upward move with a breakout.
We have a support area at the lower boundary of the channel at 175, acting as strong support from which the price can rebound.
We have a major support area in green that pushed the price upward at 174.
Entry price: 181.
First target: 187.
Second target: 195.
Third target: 205.
To manage risk, don't forget stop loss and capital management.
When you reach the first target, save some profits and then change the stop order to an entry order.
For inquiries, please comment.
Thank you.
gbpusdwe have active order block on gbpusd and we will wait for confirmation entry dont open position until i active it manually
OANDA:GBPUSD

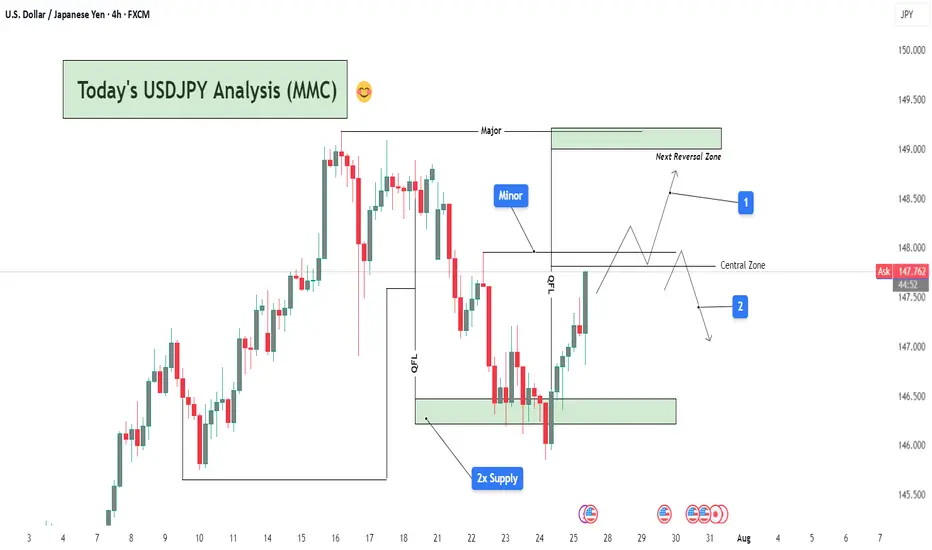
USDJPY Analysis : Smart Money Setup & MMC Concept + Target📌 Chart Overview:
This 4H USDJPY chart presents a multi-phase market structure analysis rooted in MMC (Major-Minor-Central) framework, Smart Money Concepts (SMC), and liquidity mapping. The price is currently trading around 147.39, and the chart outlines two possible scenarios labeled 1 (bullish continuation) and 2 (bearish rejection).
🔍 Key Zones & Technical Elements Explained:
🔹 1. 2x Supply Zone (Support Reaction)
Price rebounded sharply from the double-tested demand zone marked around 146.00–146.50.
This zone has historical significance and has acted as a base for previous bullish momentum.
The sharp V-shaped recovery suggests strong buying interest at institutional levels, hinting at a potential bullish continuation.
🔹 2. QFL (Quick Flip Liquidity) Zone
A notable zone where previous bullish structure broke down. It’s now being retested from below.
The QFL structure acts as a hidden supply zone or potential liquidity trap.
Watch for price rejection here, especially if it aligns with liquidity sweep patterns.
🔹 3. Minor & Major Structural Levels
Minor zone: A smaller consolidation and reaction zone—used to observe minor trend shifts or scaling entries.
Major zone: Sitting around 148.50–149.00, this is your Next Reversal Zone. It overlaps with a historical resistance area and could lead to a significant reaction.
📈 Projected Scenarios:
✅ Scenario 1: Bullish Continuation
Price breaks above the Central Zone and holds.
After breaching the minor resistance, it climbs towards the Major Reversal Zone (148.50–149.00).
There, we look for:
Either a reversal trade setup (liquidity grab + bearish confirmation).
Or continuation beyond 149.00, especially if supported by USD strength/fundamentals.
🚫 Scenario 2: Bearish Rejection
Price fails to hold above the Central Zone.
Rejection at QFL or Minor levels sends the pair back into the mid-147s and potentially down to retest the 2x Supply Zone again.
Breakdown from there could lead to a move towards 145.50–146.00, forming a potential double bottom or deeper retracement.
🧩 Technical Insights Summary:
Trend Context: Short-term bullish recovery from demand, but macro trend still uncertain.
Key Confluence:
2x Supply → Strong demand.
QFL + Central → Key breakout/rejection zones.
Major Zone → High-probability reversal area.
Bias: Neutral to Bullish, favoring Scenario 1 if price sustains above 147.50.
Watch for:
Candlestick rejections in Major Zone.
Break-and-retest behavior in Central Zone.
USD-related news near July 30–31 (highlighted below chart).
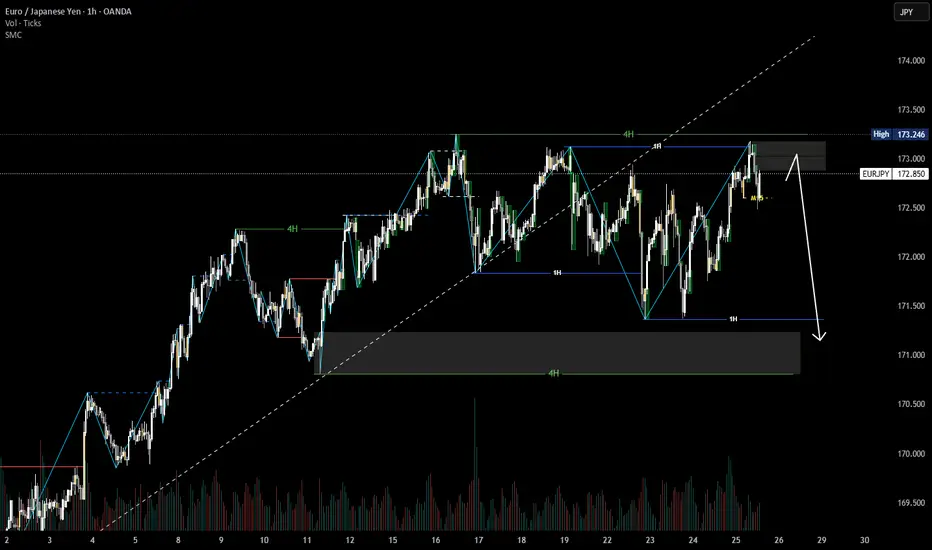
EURJPY Market Structure Analysis on 1H, 4H Timeframe4H timeframe is bullish.
1H timeframe is bearish
Price is currently clearing the top of 1H timeframe so there is a high chance that price will continue to fall to the Demand zone of 4H timeframe.
Cutting-edge Tech, Outperforming Traditional Tools Until now my AI has been defying market odds
The forecasts work on all timeframes, short, medium or long range
My AI is outperforming traditional tools, in real time, thats right...with real time validation
The question is, will the crown remain intact or be dethroned??

EURJPY Q3 | D25 | W30 | Y25📊 EURJPY Q3 | D25 | W30 | Y25
Daily Forecast🔍📅
Here’s a short diagnosis of the current chart setup 🧠📈
Higher time frame order blocks have been identified — these are our patient points of interest 🎯🧭.
It’s crucial to wait for a confirmed break of structure 🧱✅ before forming a directional bias.
This keeps us disciplined and aligned with what price action is truly telling us.
📈 Risk Management Protocols
🔑 Core principles:
Max 1% risk per trade
Only execute at pre-identified levels
Use alerts, not emotion
Stick to your RR plan — minimum 1:2
🧠 You’re not paid for how many trades you take, you’re paid for how well you manage risk.
🧠 Weekly FRGNT Insight
"Trade what the market gives, not what your ego wants."
Stay mechanical. Stay focused. Let the probabilities work.
FRGNT
OANDA:EURJPY

GBPUSD Q3 | D25 | W30 | Y25 FUN COUPON FRIDAYGBPUSD Q3 | D25 | W30 | Y25
Daily Forecast🔍📅
Here’s a short diagnosis of the current chart setup 🧠📈
Higher time frame order blocks have been identified — these are our patient points of interest 🎯🧭.
It’s crucial to wait for a confirmed break of structure 🧱✅ before forming a directional bias.
This keeps us disciplined and aligned with what price action is truly telling us.
📈 Risk Management Protocols
🔑 Core principles:
Max 1% risk per trade
Only execute at pre-identified levels
Use alerts, not emotion
Stick to your RR plan — minimum 1:2
🧠 You’re not paid for how many trades you take, you’re paid for how well you manage risk.
🧠 Weekly FRGNT Insight
"Trade what the market gives, not what your ego wants."
Stay mechanical. Stay focused. Let the probabilities work.
FRGNT
FX:GBPUSD
