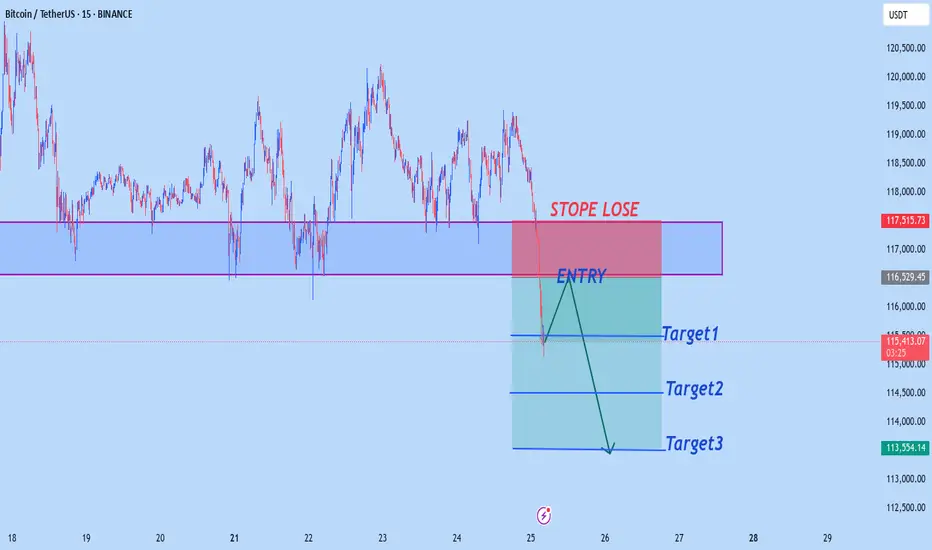
BTCUSD M15 OUTLOOKBtcusd sell from 116,500
target1 115,500
target2 114,500
target3 113,500
Stope Lose 117,500
Trade at your own risk
Gann
XAUUSD NEW OUTLOOKXauusd buy from 3360
Tp1 3370
Tp2 3380
Tp3 3390
Stope Lose 3350
TRADE AT YOUR OWN RISK

Crude oil trading reminder: triple positive support
💡Message Strategy
After three consecutive days of sluggishness, both U.S. and Brent crude oil remained above the 100-day moving average on Thursday (July 24). U.S. crude oil is currently up 0.4%, trading around 65.46; Brent crude oil is currently up 0.1%, trading around US$68.67 per barrel. The three engines of trade negotiations, unexpected decline in inventories, and geopolitical games are ignited at the same time. Oil prices showed signs of stabilizing, allowing bulls to "smell" the long-awaited rebound opportunity.
1. The trade war breaks the ice: the US, Japan and Europe have reached a series of agreements to ignite market hopes.
2. Inventories plummeted by 3.2 million barrels! The balance of supply and demand suddenly tilted.
3. Geopolitical black swan: The war between Russia and Ukraine burns the energy supply chain
📊Technical aspects
The short-term (4H) trend of crude oil fluctuated upward slightly. The moving average system gradually formed a bullish arrangement, and the short-term objective trend direction was upward. In terms of momentum, the MACD indicator opened upward above the zero axis, and the bullish momentum was sufficient.
In terms of form, the oil price broke through the neckline, and the head and shoulders bottom reversal pattern was established. It is expected that after the intraday crude oil trend retests the neckline position, the probability of forming another upward rhythm is high.
💰Strategy Package
Long Position:65.50-66.50,SL:64.00,Target:67.75-68.00

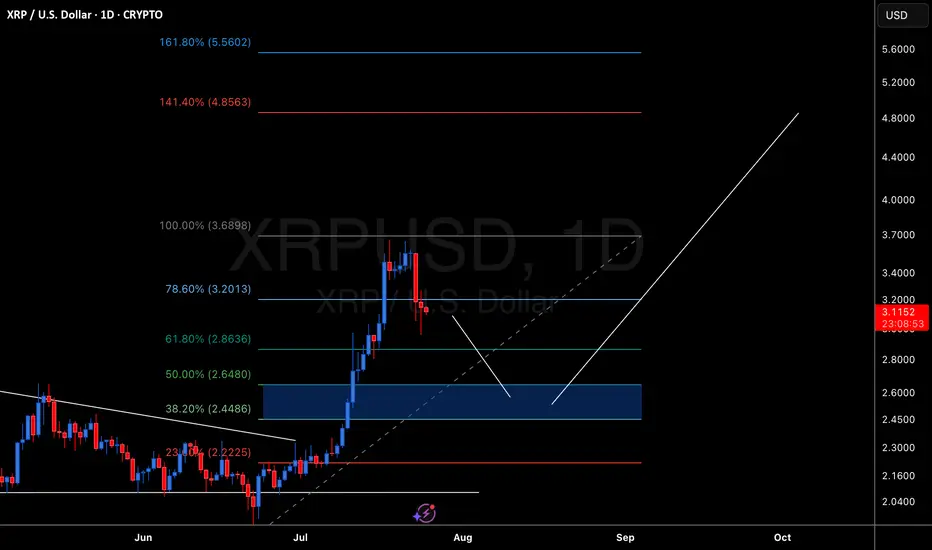
XRP Temporary Pull Back Followed Bu Move Up To $4.00XRP Created a new high. Looking for a pull back to the 50% retracement level. Followed by a move up to the 141 fib level of around $4.00
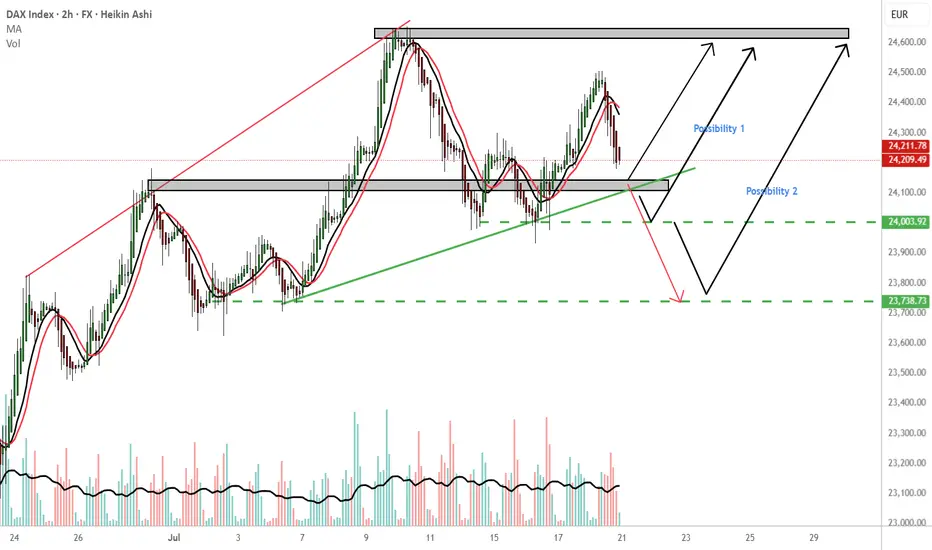
GER 30 endless possibilitiesMy most immediate outcome is reversal 24,140 price area. TP:24,600
Possibility 1: If Ger 30 holds the 24,000 price area i would consider a buy to 24,600.
Possibility 2: If Ger30 holds the 23,730 price area that would be another possibility for a buy. TP 24,600.
WCS: Worst case scenario, continuation downwards from the 24140 PL. Consider the red arrow. The 24,140 is a important price area please wait for confirmation
Please follow your trading plan.
THOUGHTS????

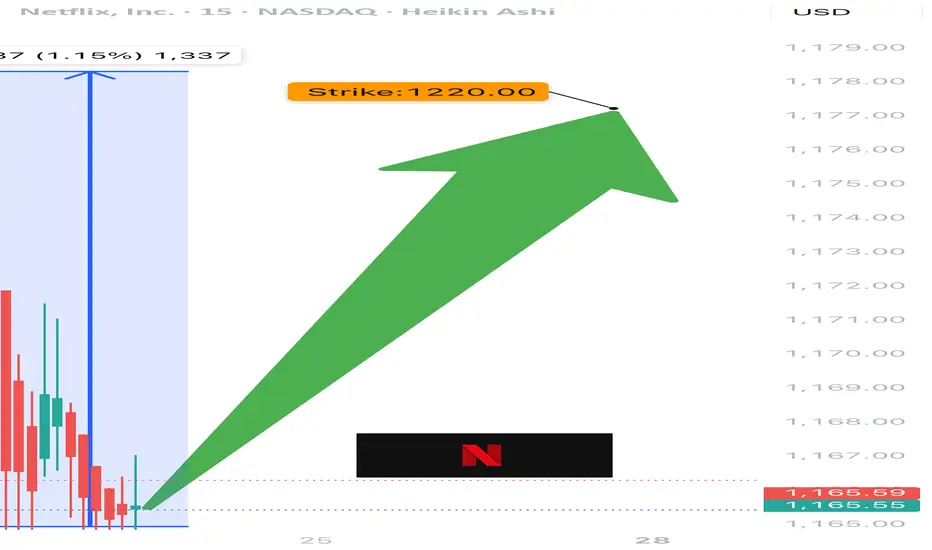
NFLX TRADE IDEA (07/24)
🚨 NFLX TRADE IDEA (07/24) 🚨
⚔️ Bulls vs. Bears… but calls are winning 🐂📈
🧠 Quick Breakdown:
• Call/Put Ratio: 1.27 → bullish edge
• RSI < 45 = 🔻oversold territory
• VIX favorable = room to run
• High gamma = big moves incoming ⚡️
• Expiry: TOMORROW = 🔥 time decay risk
💥 TRADE SETUP
🟢 Buy NFLX $1220 Call exp 7/25
💰 Entry: $0.50
🎯 Target: $0.90
🛑 Stop: $0.30
📈 Confidence: 65%
⚠️ Watch volatility closely. Fast exit = smart exit.
#NFLX #OptionsFlow #OptionsAlert #BullishPlay #DayTradeSetup #NetflixStock #TechOptions #UnusualOptionsActivity #TradingView #GammaSqueeze
#GTC/USDT Long Trade Plan#GTC
The price is moving within a descending channel on the 1-hour frame and is expected to break and continue upward.
We have a trend to stabilize above the 100 moving average once again.
We have a downtrend on the RSI indicator that supports the upward break.
We have a support area at the lower boundary of the channel at 0.282, acting as strong support from which the price can rebound.
We have a major support area in green that pushed the price upward at 0.275.
Entry price: 0.293
First target: 0.303
Second target: 0.317
Third target: 0.332
To manage risk, don't forget stop loss and capital management.
When you reach the first target, save some profits and then change the stop order to an entry order.
For inquiries, please comment.
Thank you.

The combination of the Leo New Moon and the Gann Square support Astrologically, we have two important events, the first is the new moon in Leo, which will cause a new movement in the market and give new life to the market. The second is the opposition of the Sun and Pluto, which caused a power struggle between buyers and sellers and at some point there were several stop hunts, but now it seems that the price above 118 thousand is stabilizing and could start a new rally upwards.

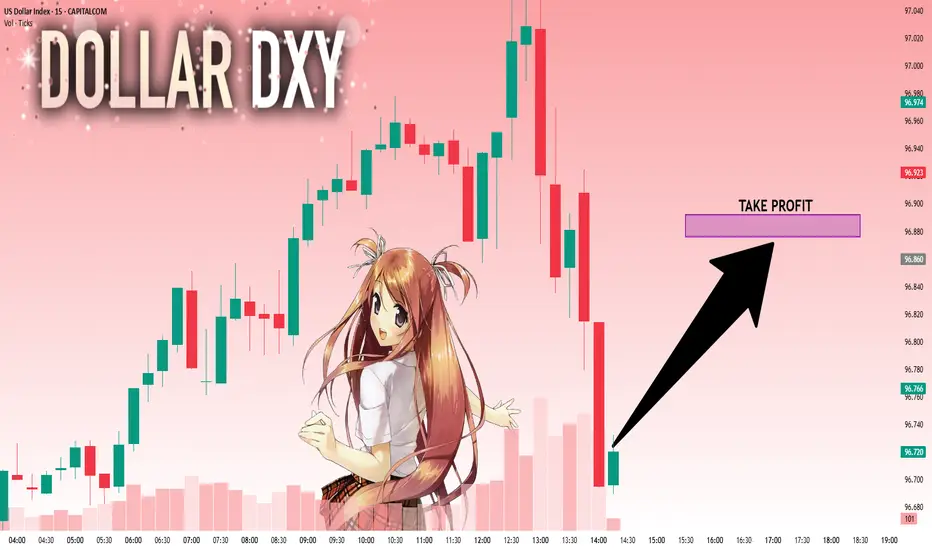
DXY: Strong Bullish Sentiment! Long!
My dear friends,
Today we will analyse DXY together☺️
The in-trend continuation seems likely as the current long-term trend appears to be strong, and price is holding above a key level of 96.722 So a bullish continuation seems plausible, targeting the next high. We should enter on confirmation, and place a stop-loss beyond the recent swing level.
❤️Sending you lots of Love and Hugs❤️
SILVER: Bulls Are Winning! Long!
My dear friends,
Today we will analyse SILVER together☺️
The market is at an inflection zone and price has now reached an area around 39.025 where previous reversals or breakouts have occurred.And a price reaction that we are seeing on multiple timeframes here could signal the next move up so we can enter on confirmation, and target the next key level of 39.148.Stop-loss is recommended beyond the inflection zone.
❤️Sending you lots of Love and Hugs❤️

Wealtris: Why Ethereum & Altcoins Are Down — And How We ProfitCrypto markets have corrected sharply in recent days, with Ethereum and altcoins posting significant losses. The sell-off was triggered by a combination of macroeconomic concerns and overheated altcoin valuations—but for Wealtris, such moves represent strategic opportunities, not threats.
The core driver of the downturn was the U.S. Federal Reserve’s renewed hawkish tone, suggesting interest rates may remain elevated longer than expected. This spooked global markets and hit risk assets hardest, including crypto. Ethereum dipped below $2,000, prompting further technical selling across DeFi, Layer 2s, and NFT-related tokens.
While panic selling defined the broader market, Wealtris responded with active capital rotation, reallocating into oversold yet fundamentally strong assets. We hedge market risk using ETH derivatives, enter stable-yield protocols to preserve capital, and deploy liquidity into strategic assets during price discounts.
Importantly, Ethereum’s long-term value proposition remains intact. The network still holds over $60B in DeFi TVL, staking participation continues to grow, and Ethereum’s development roadmap—especially in zero-knowledge rollups and Layer 2 scaling—is advancing rapidly. Temporary volatility does not change the structural thesis.
For Wealtris clients, this means we remain active during downturns. While others retreat, we leverage volatility for strategic entries and generate returns even in sideways or bearish conditions.
Our approach combines real-time data, fundamental conviction, and professional execution. Through personalized portfolios and macro-responsive strategies, we help clients avoid emotional decisions—and turn fear into financial advantage.
Today’s correction is tomorrow’s opportunity. With Wealtris by your side, your capital is positioned not only to weather the storm—but to grow from it.
Wealtris: Ethereum Demand Surges 32x — Price Set to Explode?According to a recent market analysis by Bitwise, Ethereum’s demand now exceeds supply by 32 times—a rare market condition that could lead to a major price breakout. Institutional interest, combined with Ethereum’s deflationary structure, is creating a perfect storm for growth.
At Wealtris, we treat this not just as market news, but as a strategic window to help our investors profit from a fundamentally bullish setup.
The imbalance is driven by several forces: over 27 million ETH are locked in staking, taking supply out of circulation; the upcoming wave of Ethereum spot ETFs is attracting pre-approval accumulation; and Ethereum’s fee-burning mechanism continues to deflate the token’s total supply. Simultaneously, its role as the backbone of DeFi, NFT infrastructure, and Layer 2 chains keeps demand elevated.
While traders speculate, institutions prepare. Whales and funds are quietly accumulating ETH in anticipation of regulatory clarity and ETF launches. Bitwise compares this setup to Bitcoin’s trajectory before its 2020 bull run, when a similar supply crunch triggered explosive gains.
Wealtris is already positioned for this moment. Our investment strategies offer smart exposure to Ethereum via staking platforms, ETH-indexed instruments, and Layer 2 ecosystem tokens. We provide our clients with risk-managed access to the Ethereum upside—without the need to self-manage wallets or guess market timing.
In addition, we monitor on-chain data and ETF progress in real time, adjusting exposure as signals shift. Our hybrid strategy—balancing yield generation and price exposure—helps clients benefit from both sides of the Ethereum equation.
For forward-looking investors, the 32:1 demand ratio isn’t just an interesting metric—it’s a signal. Wealtris uses that signal to generate structured growth through precise capital allocation and macro-responsive rebalancing.
With regulatory developments, staking innovation, and ETF momentum building, Ethereum appears poised for an institutional era. At Wealtris, we ensure our clients are prepared—early, efficiently, and profitably.

EURUSD: Next Move Is Down! Short!
My dear friends,
Today we will analyse EURUSD together☺️
The price is near a wide key level
and the pair is approaching a significant decision level of 1.17658 Therefore, a strong bearish reaction here could determine the next move down.We will watch for a confirmation candle, and then target the next key level of 1.17506..Recommend Stop-loss is beyond the current level.
❤️Sending you lots of Love and Hugs❤️

ChatGPT Claims $ADA Is Waking Up – Could $3 Be Back on the TableWith Cardano (ADA) showing renewed momentum, speculation is resurfacing about whether it can approach its $3 all-time high. While ChatGPT-powered analysis highlights early signs of revival, measured expectations and strategic planning are essential.
ADA’s Technical Setup: Signs of Uptick
Whale accumulation: Large wallets are steadily acquiring ADA, hinting at long-term confidence.
EMA crossover: ADA’s 50-day MA recently crossed above the 200-day MA—a bullish omen.
Volume confirmation: Price increases are backed by rising trade volume, strengthening the signal.
This alignment suggests ADA may be entering a steady upward phase.
Ecosystem Growth Driving Optimism
Vasil upgrade legacy: Network throughput improvements and reduced fees remain strengths.
DeFi & NFT traction: Over 30 smart contracts launched recently, signaling healthy usage.
Strategic partnerships: Engagements in green finance and digital identity add real use-case value.
Together, these factors strengthen ADA’s fundamentals and investor sentiment.
Sizing Up the $3 Benchmark
Market cap scale: To reach $3, Cardano’s market cap needs to expand by approximately $90 billion—a significant leap.
Past performance context: ADA flirted with $3 in late 2021 but lacked supporting network activity to sustain it.
Trigger dependency: Institutional adoption, DeFi hubs, or major fiat tie-ins are likely prerequisites for a breakout.
A controlled climb toward $2 seems more realistic, with a push beyond requiring major catalysts.
Investor Considerations
Staggered entry (DCA): Consider accumulating between $1.20–$1.40.
Profit-taking strategy: Partial exits at $2 and $2.50+ help lock in gains while maintaining exposure.
News monitoring: Watch new dApp launches, development updates, and community announcements.
Portfolio balance: ADA is best held alongside BTC, ETH, and select altcoins to mitigate risk.
Final Take
On-chain momentum and ecosystem signals suggest Cardano is moving off the sidelines. However, an overnight surge to $3 is unlikely without significant developments. By combining thoughtful accumulation with active monitoring and disciplined risk management, investors can position themselves to benefit if ADA continues its upward trajectory in 2025.

GOLD: Target Is Down! Short!
My dear friends,
Today we will analyse GOLD together☺️
The recent price action suggests a shift in mid-term momentum. A break below the current local range around 3,359.59 will confirm the new direction downwards with the target being the next key level of 3,350.22.and a reconvened placement of a stop-loss beyond the range.
❤️Sending you lots of Love and Hugs❤️

MiCA A Blessing in Disguise for EU Crypto Investors and ExchangeThe European Union’s landmark crypto regulation, MiCA (Markets in Crypto-Assets), is finally coming into full effect in 2025—and while it’s been met with mixed reactions, it may just be the long-awaited catalyst the European crypto market needs. For both investors and exchanges, MiCA could become a blessing in disguise, offering clarity, legitimacy, and long-term growth.
What Is MiCA?
MiCA is the EU’s first comprehensive regulatory framework for crypto assets. It introduces standardized rules across all member states covering:
Issuance of crypto-assets (including stablecoins)
Licensing of crypto-asset service providers (CASPs)
Anti-money laundering (AML) and consumer protection protocols
Reserve and disclosure requirements for stablecoin issuers
By harmonizing rules, MiCA eliminates the regulatory fragmentation that has plagued EU crypto markets for years.
Why MiCA Matters
Clarity for Investors
Retail and institutional investors have long been wary of crypto due to legal uncertainty. MiCA introduces clear investor protections, transparency obligations, and auditing requirements for crypto firms, helping build trust and security in the market.
Legitimacy for Exchanges
Previously, exchanges operated in a gray zone or under inconsistent national rules. With MiCA, compliant exchanges gain pan-European passports, allowing them to serve customers across the EU—unlocking significant market potential.
Stablecoin Discipline
MiCA is especially tough on stablecoins, requiring issuers to maintain 1:1 reserves and meet transparency thresholds. While this may push out weaker projects, it reinforces confidence in digital assets used for payments and trading.
Short-Term Challenges, Long-Term Gains
Yes, MiCA imposes a heavier compliance burden. Many startups may struggle with licensing and reporting costs. Some DeFi protocols might find themselves excluded or forced to rearchitect. But for the ecosystem as a whole, regulation provides:
Access to institutional capital
Improved user acquisition in mainstream markets
Risk reduction for long-term participation
MiCA also enhances interoperability with traditional finance by creating standards that banks and regulators understand.
What About Non-EU Projects?
Projects from outside the EU must now comply with MiCA to access European users legally. That means either establishing a local entity or partnering with licensed providers. This opens opportunities for EU-native companies to gain a first-mover advantage in a newly formalized market.
Conclusion
MiCA might feel restrictive at first, especially for smaller players or DeFi purists. But for serious investors, institutional players, and compliant exchanges, it’s a foundation for sustainable growth. Rather than fearing regulation, the European crypto community should embrace MiCA as a framework that brings trust, structure, and scale to a market finally ready for mainstream adoption.
MEV Bot Exploit by MIT-Educated Brothers Leads to $25M CryptoIn the dynamic world of crypto trading, where cutting-edge innovation meets finance, abuses are inevitable. One of the most prominent cases of the year involves brothers Anton and James Peraire-Bueno, MIT graduates accused of exploiting Maximal Extractable Value (MEV) strategies to siphon off $25 million from the Ethereum ecosystem within seconds. The case may set a precedent for how automated behavior in decentralized systems is judged under traditional legal frameworks.
What Happened?
According to the prosecution, the brothers deployed several Ethereum validators and used specialized algorithms to reorder transactions within blocks. This allowed them to front-run other MEV bots and redirect transaction flows in their favor—a textbook mempool attack. In just 12 seconds, they allegedly drained $25 million in ETH and other digital assets.
Why Is This Case Unique?
First major MEV case involving such significant financial losses
Criminal charges despite actions operating within protocol rules
Academic background of the defendants adds to the public intrigue
This case raises a key legal question: Can actions that are technically “legal” under protocol rules still constitute fraud if they are knowingly harmful to other participants?
Implications for the Crypto Industry
The trial could redefine ethical and legal standards in the DeFi and automated trading sectors. If convicted, this could trigger a broader review of front-running bots, sandwich attacks, and other MEV strategies that, until now, have existed in a legal gray area.
As the regulatory landscape evolves, this trial may become a cornerstone in shaping how future MEV tactics are governed—and how automated trading fits into the legal definition of financial manipulation.

XAUUSD: Market analysis and strategy for July 24.Gold technical analysis:
Daily chart resistance 3440, support 3310
4-hour chart resistance 3390, support 3340
1-hour chart resistance 3375, support 3360.
Yesterday, according to news, the United States and the European Union were close to reaching a trade agreement, which led to the recent risk aversion sentiment to subside, and the bulls took profits. The gold price has fallen by nearly $80 from its peak.
From the current power comparison, the bears are temporarily dominant. Since yesterday, the candlestick chart of the 4-hour chart has completed 6 candles today (2 of which are sideways and 4 are falling sharply). It is expected that it will not rebound until today's NY market trading session.
Gold may reach 3359 or even 3340. At that time, we will observe the stabilization of the candlestick chart. Once the downward momentum is exhausted and it starts to close higher, we can buy. The upper pressure is 3380/3400.
Buy: 3359near
Buy: 3340near
Sell: 3380near
Sell: 3400near

USDJPY Q3 | D24 | W30 | Y25 VIDEO EXPLANATION 📊USDJPY Q3 | D24 | W30 | Y25
Daily Forecast🔍📅
Here’s a short diagnosis of the current chart setup 🧠📈
Higher time frame order blocks have been identified — these are our patient points of interest 🎯🧭.
It’s crucial to wait for a confirmed break of structure 🧱✅ before forming a directional bias.
This keeps us disciplined and aligned with what price action is truly telling us.
📈 Risk Management Protocols
🔑 Core principles:
Max 1% risk per trade
Only execute at pre-identified levels
Use alerts, not emotion
Stick to your RR plan — minimum 1:2
🧠 You’re not paid for how many trades you take, you’re paid for how well you manage risk.
🧠 Weekly FRGNT Insight
"Trade what the market gives, not what your ego wants."
Stay mechanical. Stay focused. Let the probabilities work.
FRGNT

Sell Plan – XAGUSD (15M)🟥 Sell Plan – XAGUSD (15M)
Context:
Price swept liquidity from the previous swing high near the red FVG zone.
Reacted from H1 T2 bearish FVG.
Dealing Range (DR) confirmed in the 15M timeframe.
Bearish FVG formed, followed by a break of internal structure to the downside.
🔻 Trade Narrative:
After sweeping the short-term high, price tapped into the 1H T2 bearish FVG. A bearish fair value gap formed on the 15M chart, leading to the creation of a valid dealing range. Price respected this DR and showed rejection, signaling bearish intent.
⚙️ Confluences:
HTF Bearish FVG tapped (H1 T2).
Internal structure broken after the FVG.
DR formed within HTF POI.
Entry taken below DR after rejection candle.
Liquidity magnet (🧲 icon) marked below, aligning with bearish direction.
🎯 Target:
EQL (Equal Lows) marked at 38.710 – acting as liquidity target.

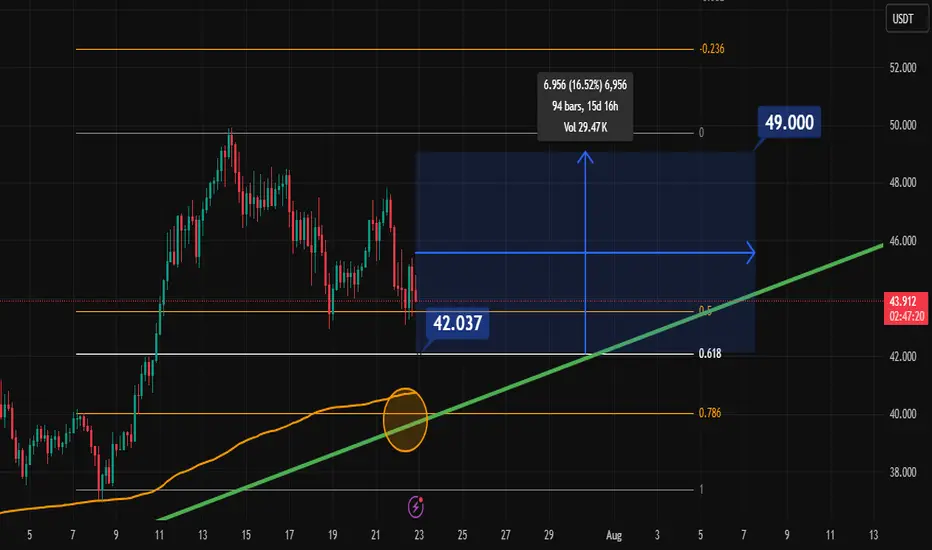
Does Hype Pump from 42 to 49 before August?Well, I have my SPOT chips on that.
I wanna hold on to that in the next 15 days. That is Untill 7th August.
AI called it, Bitcoin listened! Now, will BTC stay the course?My AI saw Bitcoin's path weeks ago, and it's playing out PERFECTLY!
Uptrend, check.
Sideways pause? Check.
This cutting-edge tool is rewriting how we trade.
But now the stage is set for suspense...will it stay the course? Can it continue to defy the odds?
Lets see
