USDJPY Q3 | D24 | W30 | Y25📊USDJPY Q3 | D24 | W30 | Y25
Daily Forecast🔍📅
Here’s a short diagnosis of the current chart setup 🧠📈
Higher time frame order blocks have been identified — these are our patient points of interest 🎯🧭.
It’s crucial to wait for a confirmed break of structure 🧱✅ before forming a directional bias.
This keeps us disciplined and aligned with what price action is truly telling us.
📈 Risk Management Protocols
🔑 Core principles:
Max 1% risk per trade
Only execute at pre-identified levels
Use alerts, not emotion
Stick to your RR plan — minimum 1:2
🧠 You’re not paid for how many trades you take, you’re paid for how well you manage risk.
🧠 Weekly FRGNT Insight
"Trade what the market gives, not what your ego wants."
Stay mechanical. Stay focused. Let the probabilities work.
FRGNT
FX:USDJPY
Gann

GBPCAD Q3 | D24 | W30 | Y25📊GBPCAD Q3 | D24 | W30 | Y25
Daily Forecast🔍📅
Here’s a short diagnosis of the current chart setup 🧠📈
Higher time frame order blocks have been identified — these are our patient points of interest 🎯🧭.
It’s crucial to wait for a confirmed break of structure 🧱✅ before forming a directional bias.
This keeps us disciplined and aligned with what price action is truly telling us.
📈 Risk Management Protocols
🔑 Core principles:
Max 1% risk per trade
Only execute at pre-identified levels
Use alerts, not emotion
Stick to your RR plan — minimum 1:2
🧠 You’re not paid for how many trades you take, you’re paid for how well you manage risk.
🧠 Weekly FRGNT Insight
"Trade what the market gives, not what your ego wants."
Stay mechanical. Stay focused. Let the probabilities work.
FRGNT


AUDUSD Q3 | D24 | W30 | Y25📊AUDUSD Q3 | D24 | W30 | Y25
Daily Forecast🔍📅
Here’s a short diagnosis of the current chart setup 🧠📈
Higher time frame order blocks have been identified — these are our patient points of interest 🎯🧭.
It’s crucial to wait for a confirmed break of structure 🧱✅ before forming a directional bias.
This keeps us disciplined and aligned with what price action is truly telling us.
📈 Risk Management Protocols
🔑 Core principles:
Max 1% risk per trade
Only execute at pre-identified levels
Use alerts, not emotion
Stick to your RR plan — minimum 1:2
🧠 You’re not paid for how many trades you take, you’re paid for how well you manage risk.
🧠 Weekly FRGNT Insight
"Trade what the market gives, not what your ego wants."
Stay mechanical. Stay focused. Let the probabilities work.
FRGNT

AUDJPY Q3 | D24 | W30 | Y25📊AUDJPY Q3 | D24 | W30 | Y25
Daily Forecast🔍📅
Here’s a short diagnosis of the current chart setup 🧠📈
Higher time frame order blocks have been identified — these are our patient points of interest 🎯🧭.
It’s crucial to wait for a confirmed break of structure 🧱✅ before forming a directional bias.
This keeps us disciplined and aligned with what price action is truly telling us.
📈 Risk Management Protocols
🔑 Core principles:
Max 1% risk per trade
Only execute at pre-identified levels
Use alerts, not emotion
Stick to your RR plan — minimum 1:2
🧠 You’re not paid for how many trades you take, you’re paid for how well you manage risk.
🧠 Weekly FRGNT Insight
"Trade what the market gives, not what your ego wants."
Stay mechanical. Stay focused. Let the probabilities work.
FRGNT

GBPUSD Q3 | D24 | W30 | Y25📊GBPUSD Q3 | D24 | W30 | Y25
Daily Forecast🔍📅
Here’s a short diagnosis of the current chart setup 🧠📈
Higher time frame order blocks have been identified — these are our patient points of interest 🎯🧭.
It’s crucial to wait for a confirmed break of structure 🧱✅ before forming a directional bias.
This keeps us disciplined and aligned with what price action is truly telling us.
📈 Risk Management Protocols
🔑 Core principles:
Max 1% risk per trade
Only execute at pre-identified levels
Use alerts, not emotion
Stick to your RR plan — minimum 1:2
🧠 You’re not paid for how many trades you take, you’re paid for how well you manage risk.
🧠 Weekly FRGNT Insight
"Trade what the market gives, not what your ego wants."
Stay mechanical. Stay focused. Let the probabilities work.
FRGNT

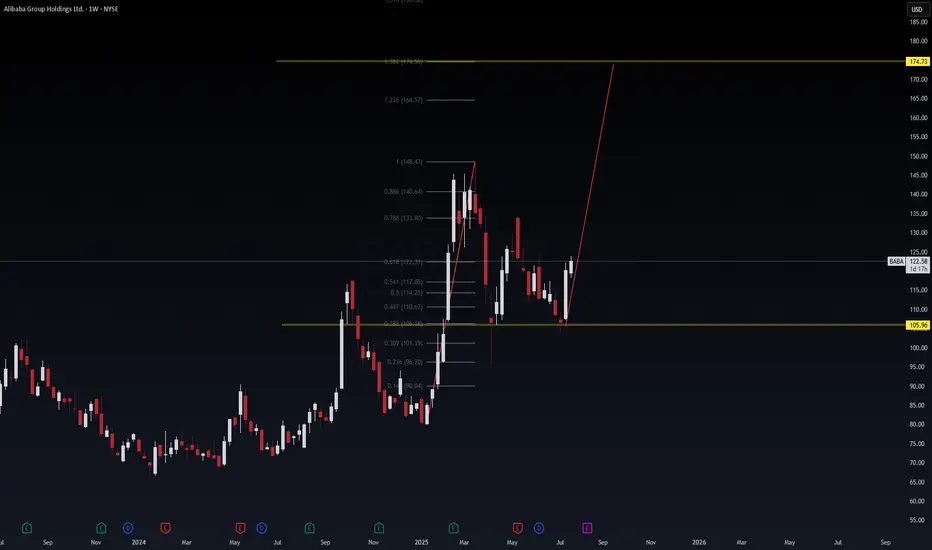
BABA | Weekly VolanX Setup📈 BABA | Weekly VolanX Setup
WaverVanir International LLC | July 24, 2025
Alibaba is bouncing off a key institutional demand zone at 105.96, reclaiming the .382 Fibonacci level with strong bullish conviction. This weekly structure sets the stage for a macro Fibonacci extension run toward 174.73 — a 1.618 projection from the March 2024 low to the March 2025 high.
🧠 VolanX Signal Context:
🔂 Structure: Double bottom + rejection wick off golden zone
🔺 Fib Targets: 133.80 → 140.64 → 164.57 → Final at 174.73
🏹 Strategy: Spot or ITM Call LEAPS (Jan/Jun 2026) or 0.50 Delta options ladder
🧭 Thesis: China tech revival, undervaluation vs U.S. peers, potential stimulus
🧨 Risk: Invalid below 105.96 weekly close. Next support 101 → 96
📡 VolanX Protocol Notes:
DSS Score: 8.6/10
Macro Tailwind: Fed dovish bias + U.S. tech overbought rotation
Position Type: Swing accumulation (8–12 week hold)
Optional Overlay: Long NYSE:BABA , short AMEX:KWEB or FXI for cleaner exposure
🛡️ Not Financial Advice. For informational and educational purposes only.
VolanX is an AI-governed trading system under WaverVanir International LLC.
#Alibaba #BABA #VolanX #MacroTrading #Fibonacci #ChinaTech #WaverVanir #DSS #InstitutionalTrading #TradingView #OptionsFlow #SMC #VolanXProtocol
Ethereum (ETH) has taken the lead in the crypto market, surpassiEthereum (ETH) has taken the lead in the crypto market, surpassing Bitcoin."

USDJPY (daily analysus) 24/07hi everyone the daily analysis video is up little early today before the daily candle close so this analysis might change is closes differently, but as is we are still bearish.
as always happy trading and have a great day

Lion one metals has their water treatment plant set up 100mSo at 10k oz per quarter production 2026, this stock is worth 0.60ct and 120 million usd

BTCUSD Long Trade BITSTAMP:BTCUSD Long Trade - this trade is basically based on Key Levels, prices are very intact as exactly shown.
This is good trade, don't overload your risk like greedy, be disciplined trader.
I manage trade on daily basis.
Use proper risk management
Looks like good trade.
Lets monitor.
Use proper risk management.
Disclaimer: only idea, not advice

JPY is gaining strength.USD/JPY is in a bearish trend, and based on my view through various fractals and market structure, a strong drop toward the marked zone is highly expected.
The stop loss is clearly defined in this scenario.
Wishing you success!

Infineon next big moveInfineon (IFX) – Potential Reversal at Trendline Support
Price has sharply corrected from the local highs around 38.7–39.0 EUR, reaching the major ascending trendline support in the 35.5–36.0 EUR demand zone.
🔹 Key points:
Strong upward trendline (blue) acting as dynamic support.
Price has reached a green demand box with confluence from previous structure.
MACD is bearish but momentum is oversold.
RSI at ~25 indicates oversold conditions with potential for a bounce.
Projected path: Possible short-term consolidation or retest of the trendline, followed by a bullish continuation towards 38.9, 39.2, and 39.5 EUR Fibonacci levels.
Targets: Fibonacci extensions at 1.272 (38.92 EUR), 1.618 (39.21 EUR), and the psychological 40 EUR zone if bullish momentum continues.
🔻 Invalidation: Clear breakdown below 34.98 EUR support (0.236 retracement) with volume confirmation could invalidate this reversal setup.

EURUSD: Strong Growth Ahead! Long!
My dear friends,
Today we will analyse EURUSD together☺️
The market is at an inflection zone and price has now reached an area around 1.17463 where previous reversals or breakouts have occurred.And a price reaction that we are seeing on multiple timeframes here could signal the next move up so we can enter on confirmation, and target the next key level of 1.17589.Stop-loss is recommended beyond the inflection zone.
❤️Sending you lots of Love and Hugs❤️

EURCAD Long TradeOANDA:EURCAD
Long trade, with my back testing of this strategy, it hits multiple possible take profits, manage your position accordingly.
TP-1: 1.59517
TP-2: 1.59726
This is good trade, don't overload your risk like greedy, be disciplined trader, this is good trade.
Use proper risk management
Looks like good trade.
Lets monitor.
Use proper risk management.
Disclaimer: only idea, not advice

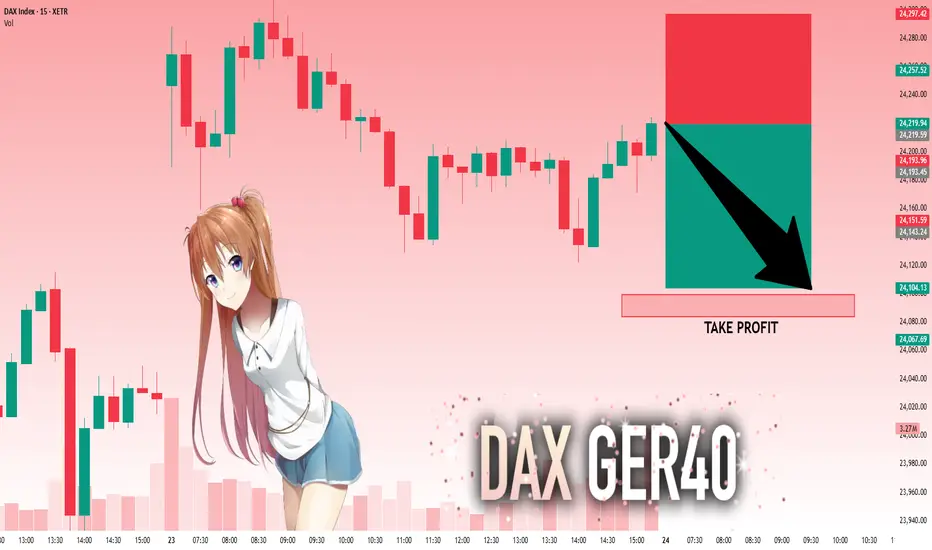
DAX: Target Is Down! Short!
My dear friends,
Today we will analyse DAX together☺️
The recent price action suggests a shift in mid-term momentum. A break below the current local range around 24,219.59 will confirm the new direction downwards with the target being the next key level of 24,099.27.and a reconvened placement of a stop-loss beyond the range.
❤️Sending you lots of Love and Hugs❤️
GOLD: Move Up Expected! Long!
My dear friends,
Today we will analyse GOLD together☺️
The in-trend continuation seems likely as the current long-term trend appears to be strong, and price is holding above a key level of 3,393.33 So a bullish continuation seems plausible, targeting the next high. We should enter on confirmation, and place a stop-loss beyond the recent swing level.
❤️Sending you lots of Love and Hugs❤️

EURUSD: Strong Growth Ahead! Long!
My dear friends,
Today we will analyse GOLD together☺️
The market is at an inflection zone and price has now reached an area around 1.17463 where previous reversals or breakouts have occurred.And a price reaction that we are seeing on multiple timeframes here could signal the next move up so we can enter on confirmation, and target the next key level of 1.17589.Stop-loss is recommended beyond the inflection zone.
❤️Sending you lots of Love and Hugs❤️

SILVER: Will Go Down! Short!
My dear friends,
Today we will analyse SILVER together☺️
The price is near a wide key level
and the pair is approaching a significant decision level of 39.520 Therefore, a strong bearish reaction here could determine the next move down.We will watch for a confirmation candle, and then target the next key level of 39.416..Recommend Stop-loss is beyond the current level.
❤️Sending you lots of Love and Hugs❤️

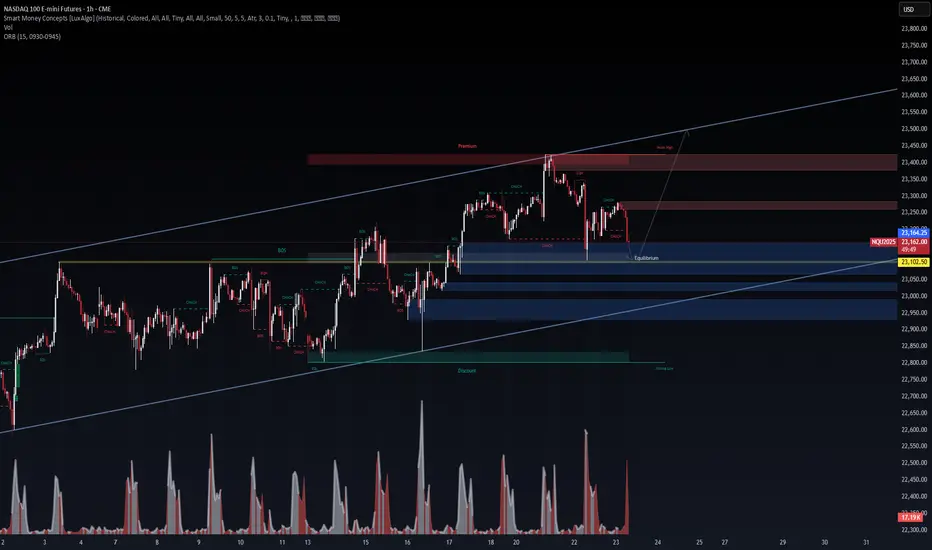
$NQ – Liquidity Sweep & Reversal Loading? NASDAQ Futures ( SEED_ALEXDRAYM_SHORTINTEREST2:NQ ) testing equilibrium support within a clean ascending channel structure. Recent price action swept local liquidity and reacted off the 1H EQ zone. Here's what we're seeing:
🔹 Key Smart Money Concepts (SMC)
Major CHoCH → BOS sequence confirms local bullish intent
Clean reaction off EQ demand zone with volume spike (13.97K)
Multiple EQHs and BOS chains → strong institutional footprint
Price holding above higher low structure, respecting channel support
🔹 Setup Bias (VolanX Protocol)
Long bias active above 23,050
Retest of EQ zone confirms order flow shift
Target zones:
🎯 PT1: 23,250
🎯 PT2: 23,440 (Premium zone)
🎯 PT3: 23,600+ upper trendline (if macro aligns)
🔹 Macro Note: Watch for bond yields + VIX + tech earnings this week. Any surprise upside catalyst could fuel a breakout to new highs.
🧠 This setup aligns with the VolanX DSS protocol. Execution window is open. Not financial advice.
#NASDAQ #NQ #Futures #SmartMoney #VolanX #TradingView #LiquiditySweep
XAUUSD: Market analysis and strategy on July 22.Gold technical analysis
Daily chart resistance level 3450, support level 3330
Four-hour chart resistance level 3420, support level 3375
One-hour chart resistance level 3402, support level 3375.
Gold rose sharply on Monday, fluctuated upward in the Asian session, and the NY market accelerated its rise, with the daily line rising sharply to 3400. The fundamentals of the bull market have not changed, and this time it is believed that the factor that triggered the unilateral rise is the expectation of the Fed's interest rate cut. Yesterday I mentioned that the 1-hour bottom structure appeared, and a new bullish opportunity appeared again!
Yesterday's idea was very clear. The Asian session stepped back to confirm the top and bottom conversion support level of 3344, and finally the NY market rose sharply, directly breaking through the key position of 3377.
Gold price stood firm at 3360, preparing to break through the key position of 3377 and then accelerate its rise. Yesterday's increase broke through the highest level in the past month. After all, the strength after the breakout after such a long period of volatility will not be small. In the previous few trading days, it returned to the previous high to complete the conversion of top and bottom. Today, pay attention to the support of the top and bottom conversion position of 3377. If it falls back during the day, you can continue to buy on dips based on the support of 3375. The bulls are accumulating momentum to break through the suppression of the 3400 mark. If it stands firm at 3400 after the breakthrough, it will be a large-scale increase.
In terms of intraday operations, buy more near 3377/75 after the retracement.
Buy: 3375 near
Buy: 3402near

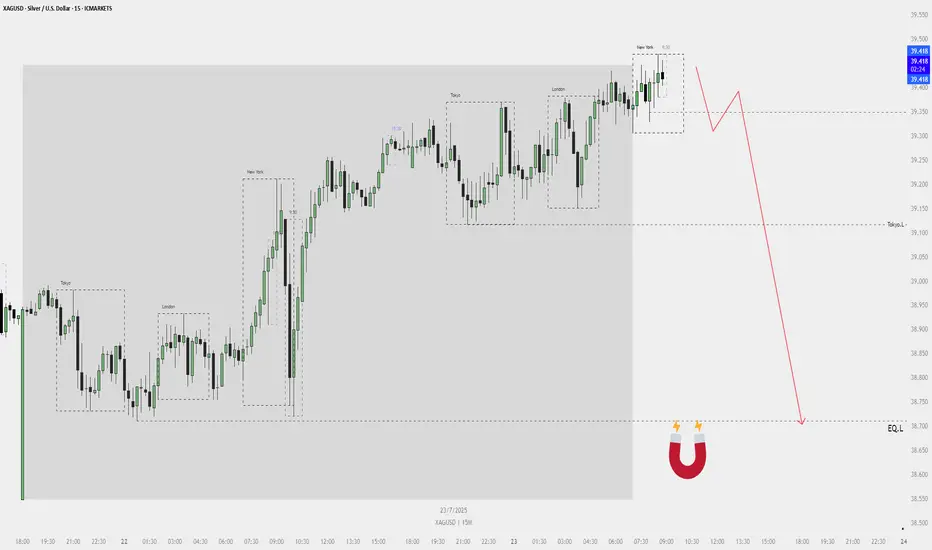
XAGUSD Sell Plan – 15M📉 XAGUSD Sell Plan – 15M
Bias: Bearish
Timeframe: 15-Minute
Date: July 23, 2025
🧠 Reasoning
Liquidity Grab: Price is sweeping short-term highs during New York open.
No More FVGs Above: Price seems to be exhausting upward momentum.
Magnet Below:
Equal lows (EQ_L) acting as a liquidity pool.
Tokyo low also lies below current price — another liquidity target.
High Probability Setup: Clean structure with a likely rejection from current premium zone.
🔴 Sell Strategy (Conceptual)
Wait for a minor liquidity grab or rejection wick to trap buyers.
Confirm a market structure shift or bearish order block.
Sell from that zone aiming for:
🎯 Target 1: Tokyo Low
🎯 Target 2: Equal Lows (Magnet zone)
⚠️ No SL/TP levels shown — trade based on structure and confirmation using your entry system (e.g., 5M DR, bearish FVG, etc.).
update : BTC/USD : WATCH TIME
Bitcoin
7 minutes ago
BTC/USD: Phase 9 In Progress – Watch Time
0
7 minutes ago
BTC has completed its impulsive and correction phases. Now it’s deep into Phase 9, the distribution phase ...
🧭 Bias: Long
📆 Daily Cycle:
Phase 3: Apr 5 – May 26 (40 bars)
Phase 6: May 26 – Jul 2 (12 bars)
Phase 9: Jul 2 → Expected until Aug 6
Now forming 3 internal sub-cycles (1H chart) = as explained on the chart by green trend info lines.
📍 Buy Zone: 118098 – 118827
🛡️ Stop Loss: 117369
🎯 Target: 120850
📅 Before Friday, July 25.
reason: this is the dip it shouldn't goback
The market doesn’t care what you “feel.”
It respects the clock.
