USD/JPY FORCAST 23-7📉 On the daily timeframe, price action confirms a potential start of a new bearish cycle.
🔄 Previous Cycle Breakdown:
Phase 3 (Impulsive Downtrend):
📅 Jan 8 → Mar 6
⏱️ ~41 daily candles
Phase 6 (Correction):
📅 Mar 6 → Mar 30
⏱️ ~20 daily candles
Phase 9 (Distribution/Exhaustion):
📅 ~16 daily candles, ending Apr 21
This marked the completion of a full cycle, triggering a shift in behavior.
🔁 What happened next?
A Reaccumulation / Manipulation phase began immediately after the cycle ended — which is normal after full cycle completion.
This reaccumulation lasted around 62 daily candles, building up pressure and liquidity.
> 80% of market movement is corrective or consolidative.
Only 20% (or less) is pure trend.
If you’re only looking for trends, you’re missing the actual map.
⚠️ Current Outlook: on the 1hr timeframe
As we now enter the final time pivot of the month — specifically beginning July 22 at 16:00 —
the market is signaling the start of a new Phase 3 (bearish impulsive wave).
usd/jpy may reach 141.453 before 1st of August.
I think this is the time to sell usd , or buy any other currencies or metal against usd
What’s your view? Are you trading with time or against it?
Gann

update : usd/jpy forcast 23th Jul📉 On the daily timeframe, price action confirms a potential start of a new bearish cycle.
🔄 Previous Cycle Breakdown:
Phase 3 (Impulsive Downtrend):
📅 Jan 8 → Mar 6
⏱️ ~41 daily candles
Phase 6 (Correction):
📅 Mar 6 → Mar 30
⏱️ ~20 daily candles
Phase 9 (Distribution/Exhaustion):
📅 ~16 daily candles, ending Apr 21
This marked the completion of a full cycle, triggering a shift in behavior.
🔁 What happened next?
A Reaccumulation / Manipulation phase began immediately after the cycle ended — which is normal after full cycle completion.
This reaccumulation lasted around 62 daily candles, building up pressure and liquidity.
> 80% of market movement is corrective or consolidative.
Only 20% (or less) is pure trend.
If you’re only looking for trends, you’re missing the actual map.
⚠️ Current Outlook: on the 1hr timeframe
As we now enter the final time pivot of the month — specifically beginning July 22 at 16:00 —
the market is signaling the start of a new Phase 3 (bearish impulsive wave).
usd/jpy may reach 141.453 before 1st of August.
I think this is the time to sell usd , or buy any other currencies or metal against usd
What’s your view? Are you trading with time or against it?

July 22 Bitcoin Bybit chart analysisHello
It's a Bitcoin Guide.
If you "follow"
You can receive real-time movement paths and comment notifications on major sections.
If my analysis was helpful,
Please click the booster button at the bottom.
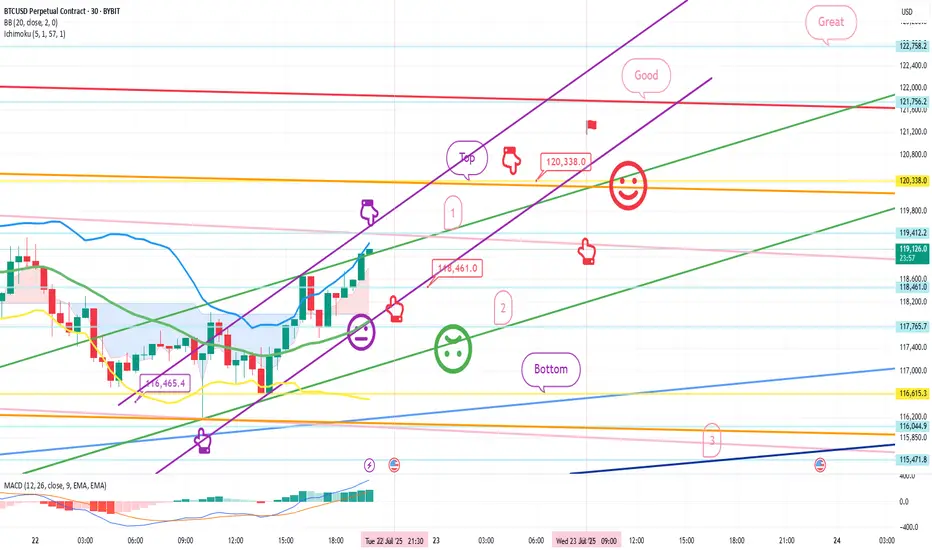
This is Bitcoin's 30-minute chart.
Nasdaq indicators will be released at 9:30 in a little while.
Although Bitcoin's mid-term pattern is broken,
it looks like a strong upward trend based on signals and candlestick positions.
In the case of Nasdaq, the 6-hour and 12-hour charts MACD dead cross is in progress,
and even if there is no plunge and only a sideways movement,
it seems likely that today's strategy will be successful.
In the bottom left, from the analysis article on the 18th,
the final long position entry point of $116,465.4 Bottom
is connected as is.
*Red finger movement path
One-way long position strategy
1. $118,461.9 long position entry section / green support line breakout, stop loss price
2. $120,338 long position 1st target -> Good, Great in order of target price
See the 1st section at the top as a touch section for an upward wave rather than a short position entry,
and if this section breaks through right away, an upward trend can be connected.
If the purple parallel line support line is maintained without breaking away,
there is a possibility of a vertical rise.
If the top section is touched,
after the first liquidation,
it would be good to use the 1st section to re-enter a long position.
The 2nd section at the bottom is important,
and if it is pushed to this section according to the movement of Nasdaq today,
it can fall strongly.
Please check the real-time support line shape.
From the breakout, Bottom -> 3 sections are open.
If you touch the 3rd section after tomorrow, the mid-term pattern will be restored.
This is the 12+ day section.
Up to this point, I ask that you simply use my analysis for reference and use only.
I hope that you will operate safely with the principle of trading and stop loss.
Thank you.
SELL PLAN – XTIUSD (15M)📉 SELL PLAN – XTIUSD (15M)
🗓️ Date: 23 July 2025
⏱️ Timeframe: 15-Minute
🔍 Context & Reasoning:
HTF Supply Zone (Red Zone)
Price entered the red HTF zone (noted as “4H T2,3,4”) and showed rejection.
This zone aligns with potential 4H Fair Value Gaps / Supply.
Sweep & Rejection
Liquidity sweep above previous highs followed by immediate bearish reaction.
Entry Confirmation
Bearish engulfing candle formed inside the HTF zone.
Price closed below 15M EMA (blue line) showing bearish momentum.
Dealing Range Valid
DR formed after rejection of the HTF zone.
Short-term bullish FVG created and violated.
Bearish FVG confirms continuation.
🎯 Entry Details:
Entry Price: ~66.12
Stop Loss: ~66.58 (Above HTF rejection zone)
Take Profit: ~65.12 (Near Weekly TP level)
🧠 Confluences:
Rejection from 4H Supply
Price closed below EMA
Clear swing failure / liquidity grab
DR confirmation on 15M
Multiple FVGs and breaker structure supporting the move
📌 Risk Management:
Risk-to-Reward: 1:2+
Risk per trade: Max 1%
If in drawdown: Use 0.5%

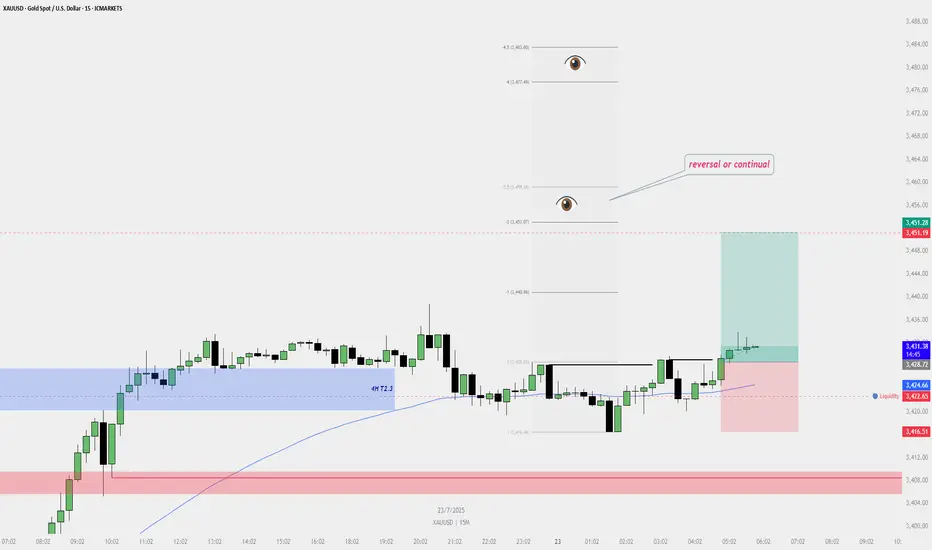
Buy Plan – XAUUSD (Gold Spot) | 15M Chart📈 Buy Plan – XAUUSD (Gold Spot) | 15M Chart
Entry Reason:
Price reclaimed liquidity below the internal range and formed a bullish shift in structure. A valid bullish dealing range was confirmed, supported by the 200 EMA and 4H T2.3 zone.
✅ Entry Zone:
➤ Entry taken after confirmation above short-term swing high
➤ Liquidity sweep confirmed below M15 consolidation
➤ Bullish FVG + support from HTF zone
🎯 Target:
TP1: 3,440.86 (1R)
TP2: 3,451.07 to 3,459.18 (Eyes above – possible reversal or continuation zone)
🛑 Stop Loss:
Placed below most recent swing low: 3,416.51
Below liquidity & invalidation of bullish structure
🧠 Bias:
Bullish (short-term continuation expected)
Reclaim above EMA and HTF zone respected
📌 Key Notes:
Watch price behavior near 3,451.07–3,459.18 for potential reversal or breakout
If price fails to maintain strength above 3,440, consider locking partial profits
Monitor 15M and 1H structure for any sign of internal break
DAX / DE30 Long Day TradeXETR:DAX / ICMARKETS:DE30 taking a pullback towards up, catching this pullback.
These are good levels if you trade nicely.
Use proper risk management
Looks like good trade.
Lets monitor.
Use proper risk management.
Disclaimer: only idea, not advice

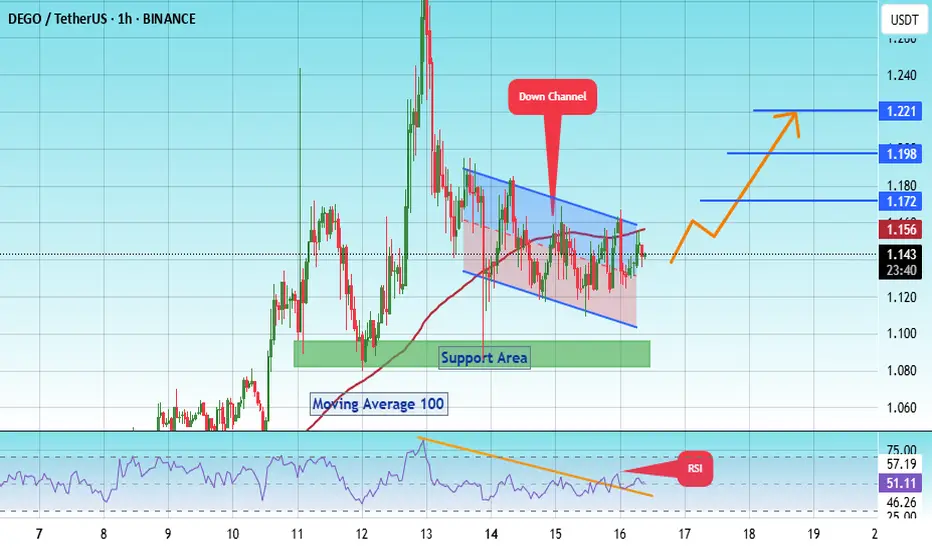
#DEGO/USDT – Bullish Breakout Setup | 1H Chart Analys#DEGO
The price is moving within a descending channel on the 1-hour frame, adhering well to it, and is heading for a strong breakout and retest.
We are experiencing a bounce from the lower boundary of the descending channel. This support is at 1.10.
We have a downtrend on the RSI indicator that is about to be broken and retested, supporting the upside.
There is a major support area in green at 1.08, which represents a strong basis for the upside.
Don't forget a simple thing: ease and capital.
When you reach the first target, save some money and then change your stop-loss order to an entry order.
For inquiries, please leave a comment.
We are in a consolidation trend above the 100 Moving Average.
Entry price: 1.14.
First target: 1.17.
Second target: 1.20.
Third target: 1.22.
Don't forget a simple thing: ease and capital.
When you reach the first target, save some money and then change your stop-loss order to an entry order.
For inquiries, please leave a comment.
Thank you.
Pound Hits $1.35 on Weaker DollarThe pound climbed to $1.35, supported by a weaker dollar and cautious positioning ahead of the August 1 U.S. tariff deadline. Investors expect UK economic data to show improving momentum, while the Bank of England may scale back bond sales due to weak demand. Despite the optimism, markets still price in two BoE rate cuts in 2025.
Resistance stands at 1.3550, with support at 1.3380.

AUDUSD Q3 | D23 | W30 | Y25📊AUDUSD Q3 | D23 | W30 | Y25
Daily Forecast🔍📅
Here’s a short diagnosis of the current chart setup 🧠📈
Higher time frame order blocks have been identified — these are our patient points of interest 🎯🧭.
It’s crucial to wait for a confirmed break of structure 🧱✅ before forming a directional bias.
This keeps us disciplined and aligned with what price action is truly telling us.
📈 Risk Management Protocols
🔑 Core principles:
Max 1% risk per trade
Only execute at pre-identified levels
Use alerts, not emotion
Stick to your RR plan — minimum 1:2
🧠 You’re not paid for how many trades you take, you’re paid for how well you manage risk.
🧠 Weekly FRGNT Insight
"Trade what the market gives, not what your ego wants."
Stay mechanical. Stay focused. Let the probabilities work.
FRGNT

AUDCAD Q3 | D23 | W30 | Y25📊AUDCAD Q3 | D23 | W30 | Y25
Daily Forecast🔍📅
Here’s a short diagnosis of the current chart setup 🧠📈
Higher time frame order blocks have been identified — these are our patient points of interest 🎯🧭.
It’s crucial to wait for a confirmed break of structure 🧱✅ before forming a directional bias.
This keeps us disciplined and aligned with what price action is truly telling us.
📈 Risk Management Protocols
🔑 Core principles:
Max 1% risk per trade
Only execute at pre-identified levels
Use alerts, not emotion
Stick to your RR plan — minimum 1:2
🧠 You’re not paid for how many trades you take, you’re paid for how well you manage risk.
🧠 Weekly FRGNT Insight
"Trade what the market gives, not what your ego wants."
Stay mechanical. Stay focused. Let the probabilities work.
FRGNT

GBPUSD Q3 | D23 | W30 | Y25📊GBPUSD Q3 | D23 | W30 | Y25
Daily Forecast🔍📅
Here’s a short diagnosis of the current chart setup 🧠📈
Higher time frame order blocks have been identified — these are our patient points of interest 🎯🧭.
It’s crucial to wait for a confirmed break of structure 🧱✅ before forming a directional bias.
This keeps us disciplined and aligned with what price action is truly telling us.
📈 Risk Management Protocols
🔑 Core principles:
Max 1% risk per trade
Only execute at pre-identified levels
Use alerts, not emotion
Stick to your RR plan — minimum 1:2
🧠 You’re not paid for how many trades you take, you’re paid for how well you manage risk.
🧠 Weekly FRGNT Insight
"Trade what the market gives, not what your ego wants."
Stay mechanical. Stay focused. Let the probabilities work.
FRGNT

EURUSD Q3 | D23 | W30 | Y25📊EURUSD Q3 | D23 | W30 | Y25
Daily Forecast🔍📅
Here’s a short diagnosis of the current chart setup 🧠📈
Higher time frame order blocks have been identified — these are our patient points of interest 🎯🧭.
It’s crucial to wait for a confirmed break of structure 🧱✅ before forming a directional bias.
This keeps us disciplined and aligned with what price action is truly telling us.
📈 Risk Management Protocols
🔑 Core principles:
Max 1% risk per trade
Only execute at pre-identified levels
Use alerts, not emotion
Stick to your RR plan — minimum 1:2
🧠 You’re not paid for how many trades you take, you’re paid for how well you manage risk.
🧠 Weekly FRGNT Insight
"Trade what the market gives, not what your ego wants."
Stay mechanical. Stay focused. Let the probabilities work.
FRGNT

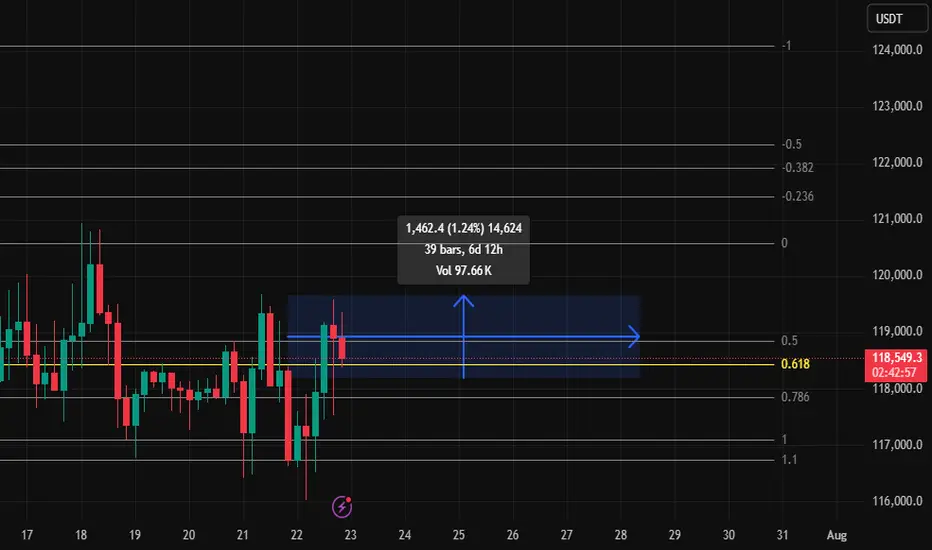
Can BTC Reclaim 118,700?1% a day can near 400% my life.
I Spot Longed BTC looking for a 1% up, might take awhile but, BTC is king, I will wait. and when it hits, a couple of memes have retraced on the daily, I will be looking for more riskier memes for a higher %pump.
USCAD Q3 | D23 | W30 | Y25📊USCAD Q3 | D23 | W30 | Y25
Daily Forecast🔍📅
Here’s a short diagnosis of the current chart setup 🧠📈
Higher time frame order blocks have been identified — these are our patient points of interest 🎯🧭.
It’s crucial to wait for a confirmed break of structure 🧱✅ before forming a directional bias.
This keeps us disciplined and aligned with what price action is truly telling us.
📈 Risk Management Protocols
🔑 Core principles:
Max 1% risk per trade
Only execute at pre-identified levels
Use alerts, not emotion
Stick to your RR plan — minimum 1:2
🧠 You’re not paid for how many trades you take, you’re paid for how well you manage risk.
🧠 Weekly FRGNT Insight
"Trade what the market gives, not what your ego wants."
Stay mechanical. Stay focused. Let the probabilities work.
FRGNT

Consistency: The Pursuit of Happiness – Week 2, Trade #4📘 Week 2 – Trade #4
Strategy Journal | Futures Account**
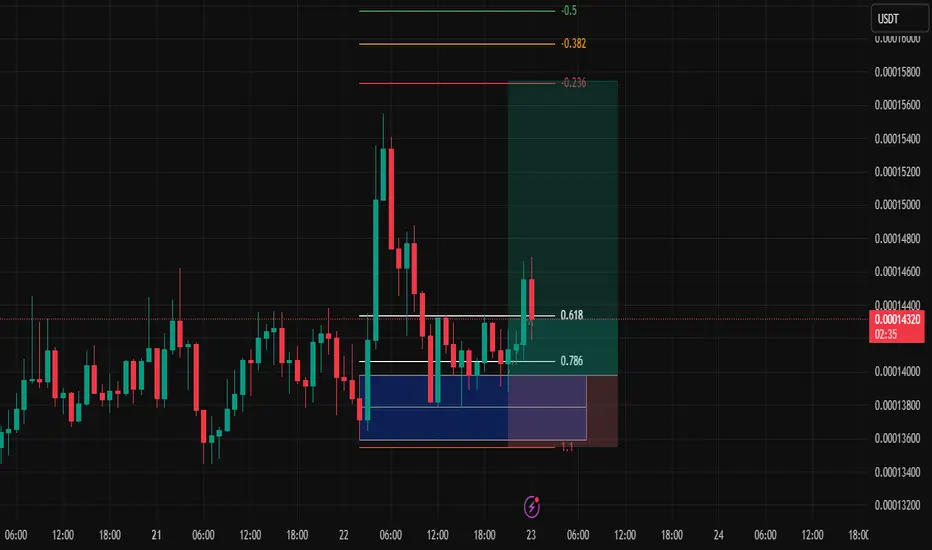
Asset: \ BINANCE:FLOKIUSDT
Timeframe**: 1H
Entry Type**: Order Block (below the 0.786)
---
🧭 Context
This is Day 4 of my live journaling and strategy publishing process.
Normally, I don’t trade on Mondays or weekends—but recent schedule shifts had me checking the charts over the weekend and saw some SPOT trades to take on Monday. That work took up a lot of mental capital heading into Tuesday. Still, I wanted to stay consistent in the process, even if energy wasn’t fully focused on the charts.
Trade Setup & Strategy
I’ve been sitting in cash for a while. Today, I wasn’t actively hunting setups—I was waiting for one to come into my criteria , and this one did.
The asset: \ BINANCE:FLOKIUSDT
My usual entries are around the 0.618 retracement , but this time, I adjusted based on my internal bandwidth and risk sensitivity.
Instead, I entered below the 0.786 , directly on the order block.
Why?
Because when my mind isn’t 100% on the charts, I don’t want to overexpose myself. Order block entries reduce my stop size and allow for better risk-to-reward profiles. It’s a cleaner, more defensive entry compared to FVGs or mid-OTE zones.
So yes—I’ve gone a little off script from my usual 0.618 entries, but not outside the logic of the framework. It’s a tweak based on context and mental clarity.
📊 Market Structure & Bias
I’m looking for a run of the previous day’s high.
But here’s the wrinkle: that high is a Monday high. And Monday’s range often gets targeted later in the week, so there’s potential—but no guarantees.
London PM session consolidated.
NY AM lacked strong momentum.
That leaves NY PM or Wednesday Asia/NY as potential breakout windows.
I’m letting it run, no interference.
🔍 Risk, Entry, and Strategy Notes
Entry: Order Block, below 0.786
Bias: Take out previous day’s high
Timeframe: 1H
Stop: Tighter than my usual 0.618 entries
Mental Capital: Split between trading futures and Spot
Objective: Stay consistent with journaling and process
Trade Management: No touch. Let it do what it does.
📌 Reflections
This is a good representation of adapting the strategy without breaking it. Fewer trades, less risk, more focus—and ideally, cleaner results.
This also confirms something I’ve been leaning into:
> **I'd rather take fewer, higher-conviction trades at cleaner levels.**
Let’s see if this one plays out. Win or loss, the goal remains the same:
Consistency → Clarity → Repeatability.
---
Result to be published once the trade concludes.
This journal remains part of a longer strategy documentation series.
BTCUSD BULISH TRANDE Btuusd buy from 117,500
tp 118,500
tp 119,500
tp 120,590
Stope Lose 116,000
TRADE AT YOUR OWN RISK

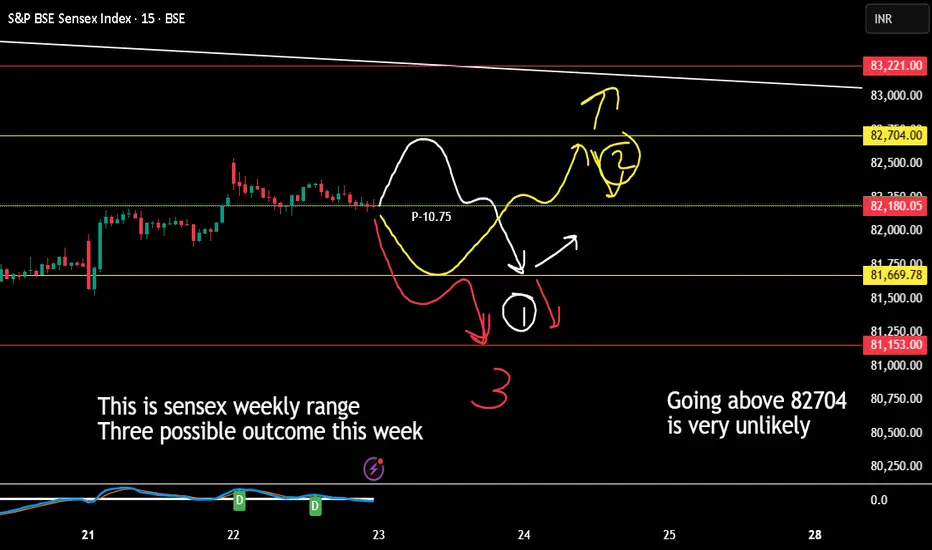
Sensex Weekly Expiry (applicable only till 29th July 2025)1. If Market VIx is less than pivot point then any price coming near pivot line or above is an opportunity to short.
2. Coming to half line below the pivot is highly possible by 80% by 24th July 2025 if not today.
3. That half line point will decide the market direction and any closing below in day to day bassis will indicate weak market.
I am expecting reversal or bulls to enter on 25th july or else by 28th July 2025
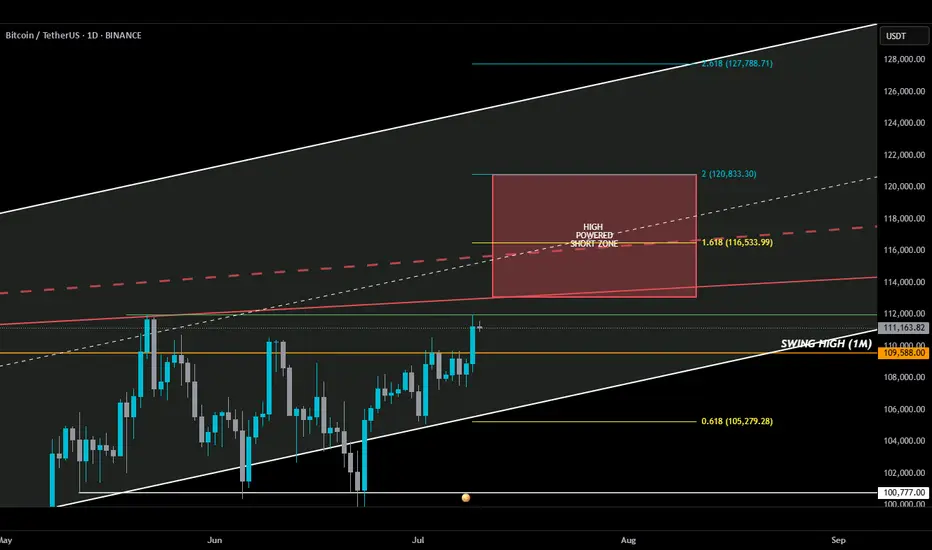
HIGH POWERED SHORT ZONE 2.0HIGH POWERED SHORT ZONE ⚡️
Usually, a 3% move doesn’t make anyone blink—but this one? It sent BTC into all-time high territory. I almost popped the champagne… until I remembered I’m in a short.
Not because I don’t believe in upside—but because my add zone in the HIGH POWERED SHORT ZONE hasn’t been tagged. Yet.
Here’s the breakdown 🧵👇
________________________________________
Before anyone goes bUCK wilD and cracks open that dusty bottle of Veuve, double-check something:
📅 The July 10th daily candle needs to close above the monthly swing high (orange line).
If BTC bulls lock that in, then a move deeper into the HIGH POWERED SHORT ZONE becomes real...
play-the-game real…
________________________________________
Where’s this HIGH POWERED SHORT ZONE coming from?
🔻 Solid red line – a trendline from Dec 2024 that has held strong through three separate tests — marking it as a key line on the sand.
🔻 Dashed red line – goes all the way back to Dec 2017. A seasoned veteran of resistance.
I also drew in a white ascending channel—not just for looks. If BTC breaks out, this channel will help us ask:
“How high is too high?”
________________________________________
Now enters Fibonacci — where nature maps out key alignments on the chart. 🌱
🟡 Gold lines = Fib golden ratios
🔵 Teal lines = Fib Degen Ratios
It’s wild how they just line up:
• 2.618? Right on the top of the channel.
• 1.618? Sitting on the 2017 trendline.
• 0.618? Near current support + bottom of the channel.
Also had to draw that horizontal support white line to keep an eye on.
A Bounce or bust? Ask the bUCKmOON!
Title: Buy Trade Strategy for ACH: Powering the Future of CryptoDescription:
This trading idea highlights ACH, the native token of the Alchemy Pay ecosystem, a project focused on bridging the gap between fiat and crypto through seamless payment solutions. ACH enables fast, low-cost transactions and supports real-world utility by integrating with global merchants and payment gateways. With partnerships spanning major platforms and growing adoption in Asia and beyond, Alchemy Pay positions itself as a key player in driving cryptocurrency adoption for everyday use. The project’s mission to enable crypto-to-fiat conversions for businesses and consumers gives ACH strong utility and growth potential.
Still, the crypto market remains highly volatile, and the value of ACH can be influenced by global economic trends, competition, regulatory frameworks, and evolving market sentiment. Like all digital assets, ACH carries risks that must be carefully considered.
Disclaimer:
This trading idea is for educational purposes only and should not be considered financial advice. Investing in cryptocurrencies such as ACH involves significant risk, including the potential for total capital loss. Always perform your own research, assess your financial situation, and consult a licensed financial advisor before making investment decisions. Past performance is not indicative of future results.

TRUMPUSDT – Explosion Loading...TRUMPUSDT is showing strong confluence between Elliott Wave and Gann techniques, suggesting a potential breakout phase is underway. The WXY corrective structure has matured, and price is unfolding impulsively with textbook internal wave symmetry.
This setup is not just technical—it's mathematical precision in motion.

USDJPY (daily update) 23/07happy trading everyone, here is the daily usdjpy video update. hope this helps happy trading as always

XAU/USD /IDEAGold continues its second consecutive aggressive bullish move, but the structure is beginning to show signs of a potential correction.
During this rally, highs and liquidity were taken,
and previously unfilled FVG zones from about a month ago have now been filled.
I'm watching for a possible correction toward the discount zone around 3360, where the following are located:
– A daily FVG
– A 4H FVG
– 1H Equal Lows, with clear liquidity resting below
If price sweeps the liquidity below these equal lows and reacts around 3360, I will anticipate a continuation of the bullish trend.
However, if a solid setup forms before that, I may enter a short position targeting 3360, where I’ll be looking to close the trade and potentially position for a reversal.
No entry yet – watching closely and waiting for price confirmation.

Adobe - A gigantic triangle breakout! 🔋Adobe ( NASDAQ:ADBE ) will break the triangle:
🔎Analysis summary:
Yes, for the past five years Adobe has been overall consolidating. But this consolidation was governed by a strong symmetrical triangle pattern. Thus following the underlying uptrend, there is already a higher chance that we will see a bullish breakout, followed by a strong rally.
📝Levels to watch:
$400, $700
🙏🏻#LONGTERMVISION
Philip - Swing Trader
