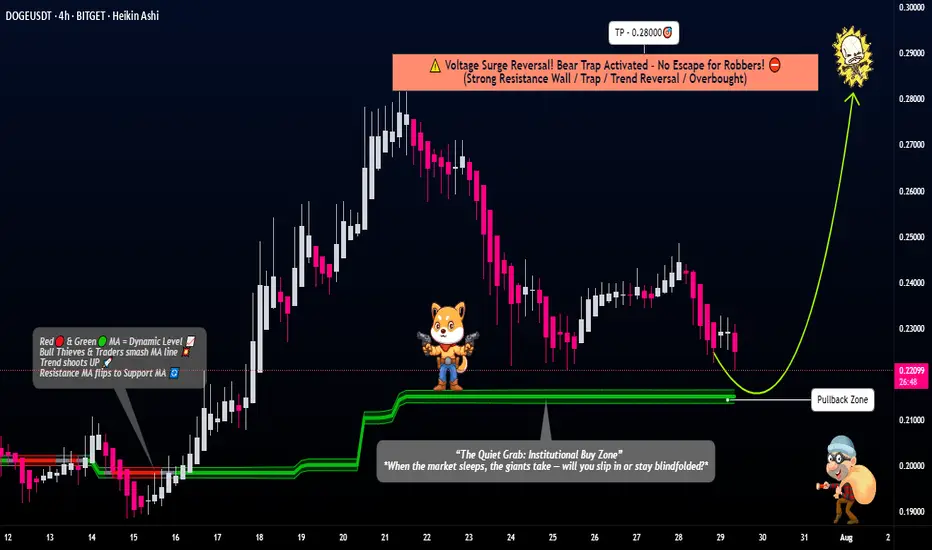
Thief Strategy Unlocked: DOGE/USDT Swing Robbery🐕💸 "DogeCoin Heist Plan: Swipe the Vault Before the Bark Bites!" 💥🔐
🌍 Hi! Hola! Ola! Bonjour! Hallo! Marhaba! 🌍
🎩 Welcome back, Money Makers & Market Robbers! 🏴☠️
💥 This is your DOGE/USDT (Dogecoin vs Tether) Crypto Market Heist Plan – fully loaded with Thief Trading Style tactics combining technical firepower 🔥 and macro intel 📊 for a high-voltage entry!
💣 Plan of Attack: The Robbery Blueprint 📈
🎯 Entry Point:
🟢 The vault's wide open! Enter LONG at any price—pullback is your sneak path in.
Set your BUY LIMIT orders using 15m or 30m timeframes at the recent swing zones.
Layer them like a pro 💹 with DCA (Dollar Cost Averaging) precision.
🛑 Stop Loss (SL):
👂 "Listen up!" Don’t slap a stop loss before the pullback confirms—it’s like triggering the alarm too early!
📍 Thief's SL placed only after pullback occurs—use the 4H swing low around 0.19000.
✍️ Adjust SL based on your risk appetite, lot size, and number of entries.
🏁 Target Zone:
🎯 Aim for 0.28000, or make a stealthy exit before the escape door shuts.
💰 Special Note for Scalpers:
Only go LONG—this market’s barking up, not down!
Big pockets? Straight in.
Smaller stack? Join the swing crew and rob with patience.
Use a trailing SL to secure the loot 🏆.
📊 Market Overview:
Currently bullish bias due to:
Macro inflows
Risk sentiment shift
Volume surge
On-chain support
Check 📡: Fundamentals | COT | Intermarket | Sentiment | Price Action.
⚠️ Heist Hazard - News Alert:
📰 Don’t enter new positions around high-impact news.
Set trailing SLs to guard your open trades during these volatile spikes.
💖💬 Robbers' Call to Action:
💥 Hit that BOOST Button on the idea 💥
Not just for likes—it fuels our squad’s energy and signals more Thief Heist Plans are coming 🐱👤💸
Let’s rob these charts—strategically, smartly, & silently.
📌 Stay Tuned for more explosive trade setups from the vault of Thief Trader.
🤑🛸 Trade smart. Trade bold. Trade like a Thief.
Gann
GOLD Short tradeOANDA:XAUUSD Short trade, with my back testing of this strategy, Short correction.
This is good trade.
Don't overload your risk like Greedy Gambler!!!
Be disciplined trader.
Use proper risk management
Looks like good trade.
Lets monitor.
Use proper risk management.
Disclaimer: only idea, not advice

Buy Trade Strategy for LDO: Leveraging Liquid Staking Adoption GDescription:
This trading idea highlights LDO, the governance token of Lido Finance, the leading liquid staking protocol in the crypto industry. LDO enables holders to participate in governance decisions that shape the platform’s development, while Lido itself allows users to stake assets like Ethereum and receive liquid tokens in return, unlocking liquidity and yield opportunities simultaneously. As Ethereum staking adoption grows post-merge and more networks integrate with Lido, the demand for its services and governance relevance of LDO are expected to strengthen. Backed by strong partnerships, continuous protocol upgrades, and dominant market share in liquid staking, LDO stands out as a key player in the evolving DeFi landscape.
Still, investors should be aware that cryptocurrency markets are highly volatile and subject to risks from regulatory changes, market sentiment shifts, and technological challenges. Proper risk management is essential when considering LDO as part of an investment strategy.
Disclaimer:
This trading idea is provided for educational purposes only and should not be considered financial advice. Cryptocurrencies like LDO involve substantial risk, including the possibility of losing your entire investment. Always conduct your own research, assess your financial position, and seek advice from a qualified financial professional before making any investment decisions. Past performance is not indicative of future results.

IBM International Business Machines Options Ahead of EarningsIf you haven`t bought IBM before the rally:
Now analyzing the options chain and the chart patterns of IBM International Business Machines prior to the earnings report this week,
I would consider purchasing the 290usd strike price Puts with
an expiration date of 2025-9-19,
for a premium of approximately $17.30.
If these options prove to be profitable prior to the earnings release, I would sell at least half of them.
Disclosure: I am part of Trade Nation's Influencer program and receive a monthly fee for using their TradingView charts in my analysis.

BTC 140K Loading…
We nailed the LONG entry right at the golden zone 🎯
Now CRYPTOCAP:BTC is breaking out with force – bulls fully in control 🐂🔥
📊 Targets in sight:
🎯 T1 – $126,472 ✅
🎯 T2 – $132,320
🎯 T3 – $138,556 (140K psychological level next 🏆)
Weekly + Daily both showing bullish continuation 📈
Every dip = opportunity until we tag that 140K zone 💪

GHST Bullish DivergenceBINANCE:GHSTUSDT
Trade Setup:
Target 1: 0.455 (0.786 Fibonnaci Golden Zone).
Target 2: 0.481 (0.618 Fibonnaci Golden Zone).
Target 3: 0.500 (0.786 Fibonnaci Golden Zone).
Target 4: 0.578 (0 Fibonnaci).
Stop Loss: 0.379 (1.272 Fibonnaci).
RSI Analysis: The RSI is showing a bullish divergence, suggesting potential bullish momentum. The current RSI is around 21.88, approaching oversold territory, so caution is advised.

#MYRO/USDT myro road map ( 1 H )#MYRO
The price is moving within an ascending channel on the 1-hour frame, adhering well to it, and is poised to break it strongly upwards and retest it.
We have support from the lower boundary of the ascending channel, at 0.02040.
We have a downtrend on the RSI indicator that is about to break and retest, supporting the upward move.
There is a key support area in green at 0.02020, which represents a strong basis for the upward move.
Don't forget one simple thing: ease and capital.
When you reach the first target, save some money and then change your stop-loss order to an entry order.
For inquiries, please leave a comment.
We have a trend of stability above the Moving Average 100.
Entry price: 0.02040
First target: 0.02140
Second target: 0.02200
Third target: 0.002276
Don't forget one simple thing: ease and capital.
When you reach the first target, save some money and then change your stop-loss order to an entry order.
For inquiries, please leave a comment.
Thank you.

ETHUSD: Strong Growth Ahead! Long!
My dear friends,
Today we will analyse ETHUSD together☺️
The recent price action suggests a shift in mid-term momentum. A break above the current local range around 4,212.0 will confirm the new direction upwards with the target being the next key level of 4,280.7 and a reconvened placement of a stop-loss beyond the range.
❤️Sending you lots of Love and Hugs❤️

BTCUSD: Will Go Down! Short!
My dear friends,
Today we will analyse BTCUSD together☺️
The in-trend continuation seems likely as the current long-term trend appears to be strong, and price is holding below a key level of 118,171.98 So a bearish continuation seems plausible, targeting the next low. We should enter on confirmation, and place a stop-loss beyond the recent swing level.
❤️Sending you lots of Love and Hugs❤️

#APT/USDT Buyers Need To Establish Support Zone#APT
The price is moving within an ascending channel on the 1-hour frame, adhering well to it, and is on its way to break strongly upwards and retest it.
We have support from the lower boundary of the ascending channel, at 4.10.
We have a downtrend on the RSI indicator that is about to break and retest, supporting the upside.
There is a major support area in green at 4.05, which represents a strong basis for the upside.
Don't forget a simple thing: ease and capital.
When you reach the first target, save some money and then change your stop-loss order to an entry order.
For inquiries, please leave a comment.
We have a trend to hold above the Moving Average 100.
Entry price: 4.25.
First target: 4.35.
Second target: 4.46.
Third target: 4.05.
Don't forget a simple thing: ease and capital.
When you reach the first target, save some money and then change your stop-loss order to an entry order.
For inquiries, please leave a comment.
Thank you.

ETHUSD-SELL strategy 3D chart Reg.ChannelOverall view is unchanged. ETHUSD is very overbought, and a fallba ck towards 3,200 is possible in the medium-term.
Strategy SELL @ $ 4,200-4,275 and take profit near $ 3,450 for now.

Fartcoin 0.9-783I gonna invest 5b€ in fartcoin
Are you ready to ride the next big wave in crypto? FartCoin is not just another meme token — it’s a movement! Here’s why FartCoin deserves a spot in your portfolio:
🔥 Explosive Growth Potential — Don’t miss the chance to catch the rocket before it blasts off to the moon! FartCoin’s community is growing fast and hype is building every day.
💨 Unique and Fun — Crypto doesn’t have to be boring! FartCoin brings humor and excitement to the market, making investing enjoyable.
🌍 Strong Community — Join thousands of passionate holders who believe in FartCoin’s future and actively promote its success worldwide.
💰 Limited Supply — With a capped supply, scarcity means price could soar as demand grows.
📈 Upcoming Listings and Partnerships — FartCoin is gearing up to be listed on major exchanges and partner with top blockchain projects. The best is yet to come!
Don’t be the one who misses out on the next crypto sensation. Grab your FartCoins today and be part of the explosive journey!
FartCoin — The Token That’s Blowing Up the Market! 💥

Euro dollar rollover at the ML & at resting on the edge of priceThere is plenty more going on via Gann MTF & Annual Forecast but technically on the forks the Euro should head to the new median line with approximately an 80% probability. If we get momentum on the sell off and later the new median line ( Downward Pitchfork ) gets breached decisively via a Zoom Bar/Retest, we may get all the way down to the second target as shown. looking for additional shorts on the lower TF. Cheers

Cadjpy enter for longCadjpy enter for long = in this video i will show my friends what i am gonna trade

#LEVER/USDT#LEVER
The price is moving within an ascending channel on the 1-hour frame, adhering well to it, and is poised to break it strongly upwards and retest it.
We have support from the lower boundary of the ascending channel, at 0.0001800.
We have a downtrend on the RSI indicator that is about to break and retest, supporting the upward trend.
There is a key support area in green at 0.0001780, which represents a strong basis for the upward trend.
Don't forget one simple thing: ease and capital.
When you reach the first target, save some money and then change your stop-loss order to an entry order.
For inquiries, please leave a comment.
We have a trend of stability above the Moving Average 100.
Entry price: 0.0001877
First target: 0.0001938
Second target: 0.0002026
Third target: 0.0002110
Don't forget one simple thing: ease and capital.
When you reach the first target, save some money and then change your stop-loss order to an entry order.
For inquiries, please leave a comment.
Thank you.

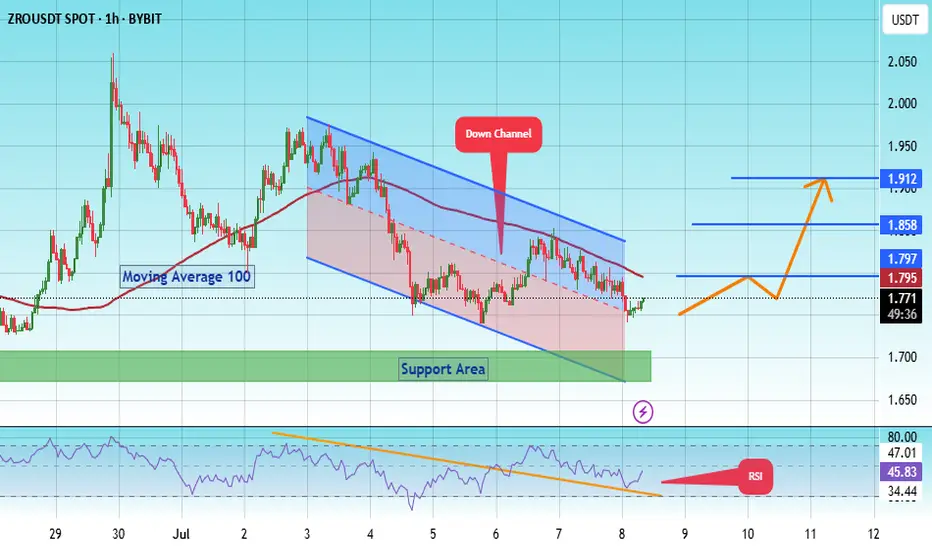
#ZRO/USDT#ZRO
The price is moving within a descending channel on the 1-hour frame, adhering well to it, and is heading for a strong breakout and retest.
We have a bounce from the lower boundary of the descending channel, this support at 1.71.
We have a downtrend on the RSI that is about to be broken and retested, supporting the upside.
There is a major support area in green at 1.70, which represents a strong basis for the upside.
Don't forget a simple thing: ease and capital.
When you reach the first target, save some money and then change your stop-loss order to an entry order.
For inquiries, please leave a comment.
We have a trend to hold above the 100 Moving Average.
Entry price: 1.764
First target: 1.795
Second target: 1.858
Third target: 1.912
Don't forget a simple thing: ease and capital.
When you reach the first target, save some money and then change your stop-loss order to an entry order.
For inquiries, please leave a comment.
Thank you.
Weekly outlook Weekly outlook in this outlook i will tell my partners what i am gonna trade for the week

#TAI/USDT#TAI
The price is moving within an ascending channel on the 1-hour frame, adhering well to it, and is on its way to breaking strongly upwards and retesting it.
We have support from the lower boundary of the ascending channel, at 0.055773.
We have a downtrend on the RSI indicator that is about to break and retest, supporting the upside.
There is a major support area in green at 0.05656, which represents a strong basis for the upside.
Don't forget a simple thing: ease and capital.
When you reach the first target, save some money and then change your stop-loss order to an entry order.
For inquiries, please leave a comment.
We have a trend to hold above the 100 Moving Average.
Entry price: 0.06117.
First target: 0.6386.
Second target: 0.6663.
Third target: 0.
Don't forget a simple thing: ease and capital.
When you reach your first target, save some money and then change your stop-loss order to an entry order.
For inquiries, please leave a comment.
Thank you.

#MYRIA/USDT#MYRIA
The price is moving within an ascending channel on the 1-hour frame, adhering well to it, and is poised to break it strongly upwards and retest it.
We have support from the lower boundary of the ascending channel, at 0.0009555.
We have a downtrend on the RSI indicator that is about to break and retest, supporting the upward move.
There is a key support area (in green) at 0.0009720, which represents a strong basis for the upward move.
Don't forget one simple thing: ease and capital.
When you reach the first target, save some money and then change your stop-loss order to an entry order.
For inquiries, please leave a comment.
We have a trend of stability above the moving average of 100.
Entry price: 0.0010490
First target: 0.0010962
Second target: 0.0011460
Third target: 0.0012145
Don't forget one simple thing: ease and capital.
When you reach the first target, save some money and then change your stop-loss order to an entry order.
For inquiries, please leave a comment.
Thank you.

Nifty August TDX Levels -Observation:
The month has erupted with a bearish undertone, casting shadows over the market’s horizon. It’s a turbulent start, fraught with uncertainty .
Bulls:
Despite the indicators flashing oversold, there’s a flicker of hope—a glimmer that a resilient bullish pattern might awaken on a smaller time frame. Yet, patience is vital; we must wait for that decisive moment when the market reveals a clear bullish formation before boldly stepping in.
Bears:
Since the dawn of last month, relentless downward momentum has engulfed the markets .
Now, only a tentative pullback, should tempt us to initiate fresh short positions, for the risk-reward landscape remains perilous and unkind.
Conclusion:
The true opportunities lie at the crucial junctures—those key Support and Resistance levels, pausing points within the intricate dance of Time Cycles. It is only when these points are reached that we should reassess with clarity and resolve. The probability of an Impulsive wave surging forth is high; the current Corrective wave has hit its targets, yet its story remains unfinished—setting the stage for a potential dramatic turn in the market’s saga.
For sharper insight and a more profound understanding, I urge you to view the chart through the hourly lens. Only then can the full emotional weight and strategic clarity of these movements come into focus.

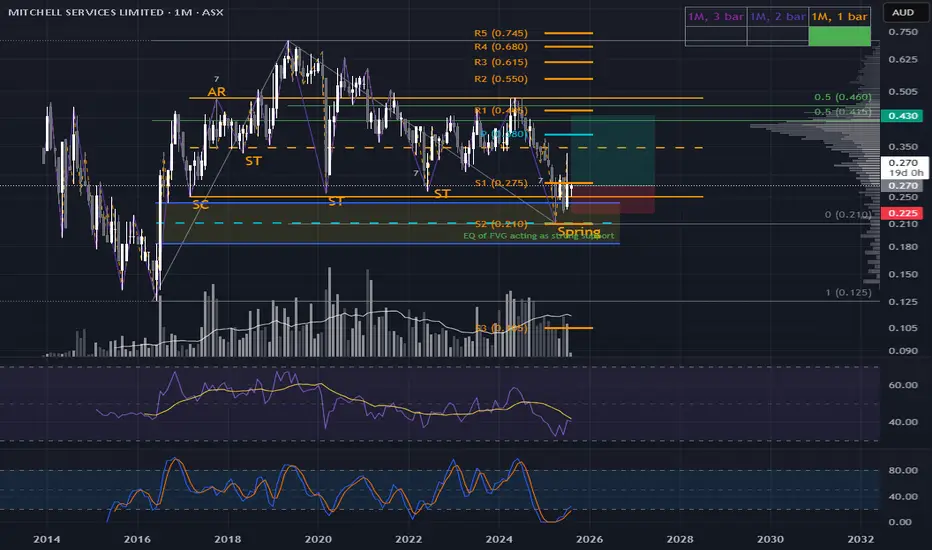
Microcap Coil: MSV Poised for a Spring UnwindMSV is shaping up beautifully — potential spring in play. Price action suggests a classic Wyckoff Phase C moment, with signs of absorption and a possible reclaim on deck. But let’s be clear: this is a microcap, and that means elevated risk.
High caution required — thin liquidity, fast moves, and headline sensitivity make this one a sniper’s game, not a swing-for-the-fences setup. If the spring confirms, it could offer a sharp asymmetric move — but only if you’re disciplined with size and execution.
Dead Cat or Last Breath? RHC’s Pivot Trap LoomsRHC is sitting at a pivotal moment. For the bullish case to stay alive, we need to see price swiftly reclaim and close above ~$43 — that’s the line in the sand.
However, I’m leaning toward Scenario 1, which suggests a short-term push up to the yearly pivot and macro 50% retracement level, followed by a rejection and sharp move lower.
Bearish Pathway
Initial Bounce: Push toward ~$43 could trap late longs.
Rejection Zone: Yearly pivot and macro 50% level act as resistance.
Downside Targets:
First stop: $26 — previous structural support.
Then potentially: $18 — deeper liquidity zone and psychological level.

COL Bullish Blueprint: $20 or $18.93 — Which Launchpad Wins?Coles is setting up for a sustained move higher. The structure is clean, and two key scenarios are worth tracking:
Scenario 1:
Shallow Pullback to ~$20
LVN Zone: Low Volume Node suggests weak price acceptance — price may dip but not stay.
Fib Confluence:
50% retracement from the recent 1-month 2-bar swing low aligns with this zone.
Yearly R1 Pivot:
Adds structural weight to the $20 area.
Expectation: Quick dip, then bounce — ideal for aggressive entries with tight invalidation.
Scenario 2:
Deeper Pullback to ~$18.93 (Preferred)
Major Support Cluster: Previous swing tops now act as support.
Macro Fib Level: 50% retracement from ATH to the March 14.81 low lands here.
Wick Memory: March’s long wick suggests liquidity and buyer defense — midpoint could act as a springboard.
Expectation: Stronger base, better risk-reward, and potential for a more explosive leg higher.
Invalidation: if we have a monthly close below $18.31 then the chances was this breakout was a false move.
please note, no time analysis done arrows show pathing
