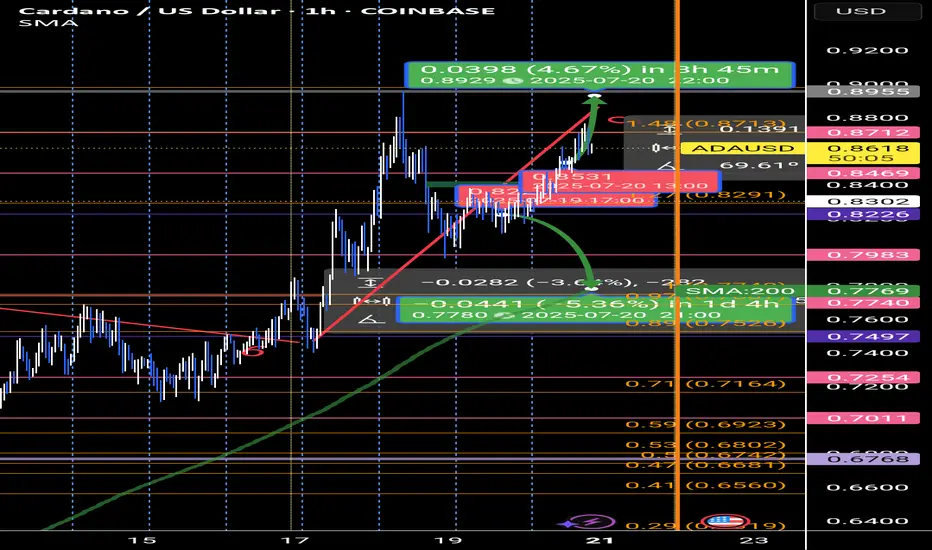
UPDATE ADA FORCAST🔄 When Time Speaks, Price Listens
#TimeAnalysis | #Cardano | #ADAUSDT | #SmartTrading
In my previous ADA/USDT analysis, the mistake wasn’t in the price structure—it was in the timing.
The price didn’t reverse where expected, not because the setup was wrong, but because I ignored one critical factor:
The time cycle must align with the price cycle.
📌 Here's what really happened:
From July 2 to July 7, price moved sideways in a clear accumulation range.
Then came an explosive expansion wave (Wave 3) from 0.573 to 0.75, lasting 113 hourly candles.
This was followed by a correction wave (Wave 6) of 130 candles.
Currently, price is in a distribution wave (Wave 9), ongoing for over 90 candles.
📉 My error? Misalignment between time and price.
📆 After applying my fixed monthly time cycle model, based on the rule that 9 marks the end of every cycle,
it became obvious that the price waves were following exact temporal intervals:
➡️ Monthly cycle anchor points:
(8 Jan, 7 Feb, 6 Mar, ..., 9 Sep, 8 Oct...)
Each month is divided into 3 major time zones, and each zone into two sub-zones.
This creates a clean framework where waves naturally unfold:
🔹 3 = Expansion
🔹 6 = Correction
🔹 9 = Distribution
💡 Key Takeaways:
Don’t trade predictions. Trade the wave.
Every price move is governed by time.
Ignoring time leads to premature entries—even with solid technical analysis.
🧠 Want to learn how to read these time-price cycles? Let’s discuss in the comments.
Gann

gkgj,hgfj- SUI is currently trading near the resistance line. Price was reject around this resistance line in the previous pump.
- Given the current bullish market, price is expected to breakout from this resistance easily
Entry Price: 4.04
StopLoss: 3.2
TP1: 4.5059
TP2: 5.3810
TP3: 6.5106
TP4: 7.8772
TP5: 10+
Don't forget to set stoploss.
Stay tuned for more updates
hihiThe convergence of artificial intelligence and decentralized finance presents a paradigm shift in global economic systems, where algorithmic governance, autonomous agents, and smart contracts could redefine trust, efficiency, and access. This fusion offers transformative potential but raises critical ethical, regulatory, and socio-technical challenges demanding interdisciplinary exploration and resilient systemic safeguards.
Ask ChatGPT

AMD Analysis! Bullish 🔷 📝 AMD Analysis – GEN Methodology & Fibonacci Projection NASDAQ:AMD
✅ Chart Technique:
The blue overlay represents a historical price pattern (GEN Projection) applied to the current AMD chart using Bar Pattern Projection.
This technique forecasts potential timing and price movement based on similar past structures.
✅ Fibonacci Retracement (purple levels):
After the July high, a correction into the Golden Zone (0.618 at $109.16) was expected.
The current price is hovering around the 0.5–0.382 retracement levels ($119–129), suggesting potential support or a mid-term consolidation.
✅ Green box:
Marks a liquidity zone or accumulation area where the price may form a local bottom before continuation.
✅ Overall idea:
If the GEN Projection plays out, AMD could consolidate here before a strong rally towards new highs ($200+) in the coming months.
Invalidation: A clean break and daily close below the 0.618 Fibonacci ($109) would weaken this bullish scenario.

Solana and BNB Chain Lead Blockchain Growth: Weekly HighlightsRecord Activity: 342 Million Transactions in Just 7 Days
July 2025 marks a historic milestone for the crypto industry: in a single week, public blockchains processed more than 342 million transactions — the highest figure in the history of decentralized networks. Two platforms stood out the most: Solana and BNB Chain, ranking at the top in network activity and showcasing both technological maturity and growing user demand.
Solana — The Engine of Hyperactive Web3
Solana continues to prove its reputation as one of the most high-performance blockchains. Over the past week, the network processed over 200 million transactions, accounting for more than 58% of total activity. This achievement is driven by Solana’s high throughput and ultra-low fees, making it highly attractive for mass adoption and retail developers.
One of the main growth drivers has been the surge in meme coins and simple tokens created on Solana through platforms like Pump.fun. While these assets are often speculative, they generate massive traffic — tens of millions of transactions daily from thousands of users. This in turn boosts TVL and DEX activity.
But Solana is no longer just about gamified tokens. Increasingly, serious projects in DeFi, infrastructure, and Web3 gaming are launching on the network. New NFT platforms, liquid staking services, and retail investment apps are transforming Solana into a hub for both speculators and long-term participants.
BNB Chain — Stability, Infrastructure, and Maturity
While Solana grabs attention with viral growth and hype, BNB Chain demonstrates the steady strength of a mature ecosystem. The network handled approximately 65 million transactions, securing second place in the weekly rankings. User and developer activity remains consistently high, while tools for building DApps and DeFi products continue to expand.
Recent upgrades, including faster block finality and support for new standardized smart contracts, have enhanced user experience and transaction speed. In 2025, BNB Chain is targeting throughput of up to 20,000 transactions per second, aiming for scalability on par with centralized exchanges.
BNB Chain also plays a strong role in GameFi, logistics solutions, stablecoins, and cross-chain interoperability, positioning itself as a foundation for integrating traditional business models into the crypto ecosystem.
Why This Growth Matters
This record-breaking week signals that crypto has moved far beyond speculative trading. Blockchains are becoming operational environments where millions of value-driven transactions occur daily.
The surge in activity on Solana and BNB Chain underscores a key trend: platforms that combine high traffic capacity with usability and cost efficiency are taking center stage.
Risks and Challenges
Despite the positive outlook, vulnerabilities remain:
Solana could overheat. Activity driven by meme coins is volatile — if hype fades, engagement could plummet.
BNB faces competition from Ethereum L2. Fast, low-cost L2 solutions like Arbitrum and Optimism could lure users away.
Regulatory threats. Any sanctions or restrictions, especially in the U.S., could negatively impact both networks.
Conclusion
Solana and BNB Chain represent two distinct strategies for success:
Solana: speed, scale, and viral engagement.
BNB Chain: stability, ecosystem depth, and infrastructural strength.
Their dominance during the biggest week in blockchain history proves they are among the key architects of the new digital economy. Which one will maintain leadership in the second half of the year remains to be seen — but one thing is clear: the fight for the heart of Web3 is on.
Thumzup Bets Big on XRP How $250 Million Could Be a Game-ChangerA New Crypto Strategy: Beyond Bitcoin
In 2025, one thing is clear: publicly traded companies are no longer limiting themselves to Bitcoin-only investments. A prime example is Thumzup Media Corporation, a Nasdaq-listed firm that recently approved a plan to allocate up to $250 million into crypto assets. Unlike past strategies, which were heavily BTC-focused, Thumzup is diversifying — prioritizing XRP, ETH, SOL, DOGE, USDC, and LTC. Among these, XRP stands out as one of the company’s largest bets.
Why XRP?
XRP is a token with a complex history and massive potential. Despite years of legal battles with the SEC, by 2025, XRP has solidified its position as a reliable asset for fast international transactions. Its widespread use among banks and financial institutions makes it unique compared to other altcoins.
Thumzup highlighted several reasons for putting XRP at the forefront:
High Liquidity: XRP trades on most major exchanges with significant volume.
Low Fees: The network enables quick, low-cost transfers of large sums.
Regulatory Progress: After Ripple’s partial victory over the SEC, XRP gained legal clarity in the U.S., making it far more attractive for public companies.
Adding to the momentum, XRP reached a new all-time high above $3.60 when Thumzup announced its strategic move — further boosting investor confidence.
$250 Million — The Source and the Strategy
In 2025, Thumzup’s board approved a major expansion of crypto holdings on its balance sheet. This investment is financed through a mix of free capital, new stock issuance, and partial bonds. The goal is not just to build an investment portfolio but to create an infrastructure-like crypto fund, similar to MicroStrategy’s approach — but with a broader basket of assets.
The company’s ambition goes beyond simply holding assets for price appreciation. Thumzup plans to integrate cryptocurrency into its advertising platform, where users get paid for posting content. XRP and other assets could serve as internal payment tools within this ecosystem.
Media Impact and Brand Boost
The move sparked massive media attention and market buzz. The excitement grew further when Donald Trump Jr. acquired company shares and joined as an advisor, creating a PR storm. As a result, Thumzup’s stock surged over 80% in a single month.
Such attention from political figures and traditional investors reinforces the notion that XRP — and other crypto assets — are evolving from “digital assets” to integral components of operational business models.
Risks to Consider
High Volatility: Significant crypto exposure could harm the company’s balance sheet in a bear market.
Regulatory Shifts: Despite progress, Ripple’s legal situation isn’t fully resolved.
Reputation Risk: Failure in crypto ventures could damage shareholder confidence.
Bottom Line
Thumzup Media has taken a bold step, positioning cryptocurrency — especially XRP — as a strategic growth tool rather than just a hedge. This move signals a paradigm shift: from “Bitcoin as a reserve” to multi-token integration into business models. If successful, this strategy could encourage other public companies to follow suit, marking the dawn of multi-asset corporate crypto treasuries.

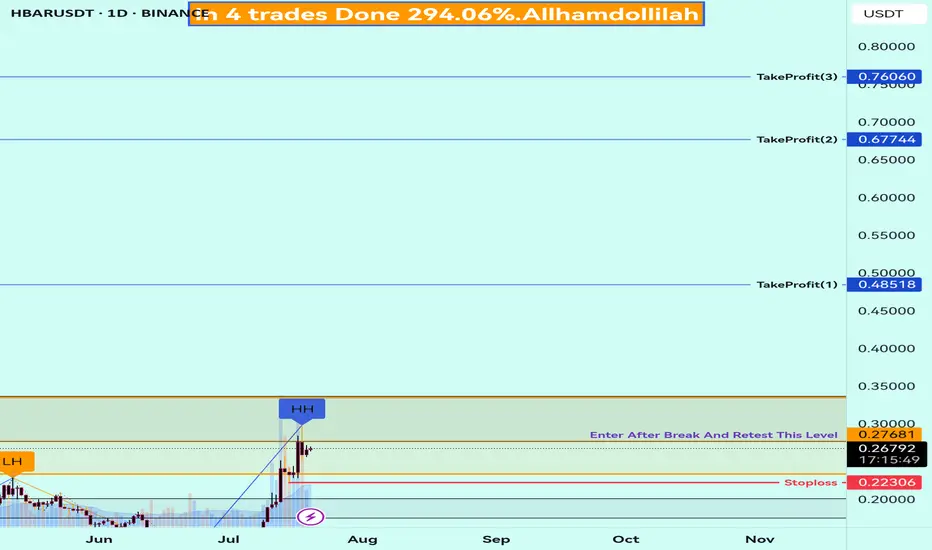
Buy Trade Strategy for HBAR: Backing Enterprise-Grade DLT AdoptiDescription:
This trading idea is centered on HBAR, the native token of Hedera Hashgraph, a next-generation distributed ledger technology (DLT) designed for speed, security, and scalability. Unlike traditional blockchains, HBAR uses a unique hashgraph consensus mechanism, making it exceptionally efficient and suitable for enterprise adoption. Major companies, including Google, IBM, and Boeing, are part of Hedera's Governing Council, which enhances its credibility and long-term sustainability. HBAR is used to power decentralized applications, pay for network services, and secure the network through staking.
As interest in scalable and environmentally friendly DLTs grows, HBAR is well-positioned to benefit from broader institutional and developer adoption. Nevertheless, the crypto market remains highly volatile and is influenced by a variety of external factors such as regulations, market sentiment, and global economic trends. Investing in HBAR requires a balanced risk management approach.
Disclaimer:
This trading idea is provided for educational purposes only and does not constitute financial advice. Cryptocurrencies, including HBAR, involve substantial risks and may result in the loss of your entire investment. Always conduct independent research, consider your financial situation, and seek professional advice before making any investment decisions. Past performance is not indicative of future results.
Monday till thursday expiry rangeAs long as vix value is under 11.24 crossing pivot and going on top is not possible as per my mathematical range calculation (accuracy is 80%).
If it is near 25111 level on Thursday (and ind vix is less than 11.24) a very good time to make handsome money as market will touch 24946.27 level (probability s 80%)
For Monday we should follow buy the dip as long 24920 is intact.
Breaching 24920 market will show 24800-24781 as first target. If 30 min candle stays below this level (24780) then next tgt will be open. Will keep you posted if anything changes.
Caution: I am not SEBI registered it is my mathematical analysis and it is not buy or sell recommendation

FLOKI Headed to $0.01. Cents Floki to the upside after break out from bullish triangle pattern. Target is the 141.00%

PEPEUSDT Dipping Down for Key Zone 0.00001230 to TouchBINANCE:PEPEUSDT has been quite on bullish trend and last week has been stopped being bullish, and started ranging, now PEPEUSDT will correct itself slightly by dipping down towards 0.00001230 which is very important level.
After 0.00001230 then next key level is 0.00001117 but we need to see if it really need to go down there or will bounce back up from 0.00001230.
0.00001327 is the Key Resistance Level, if its respected well then our target is very obvious to hit.
Use proper risk management
Lets monitor.
Use proper risk management.
Disclaimer: only idea, not advice

BTCUSDT Short Swing TradeBINANCE:BTCUSDT Short Swing Trade, with my back testing of this strategy, it hits multiple possible take profits, manage your position accordingly.
This is good trade, don't overload your risk like greedy, be disciplined trader.
I manage trade on daily basis.
Use proper risk management
Looks like good trade.
Lets monitor.
Use proper risk management.
Disclaimer: only idea, not advice

ADA GOES DOWN🔍 Still analyzing the markets based on price only?
Markets don't move randomly. They follow precise time-based cycles that repeat with uncanny accuracy.
In this analysis, I focused on:
🔁 Time segmentation using the 3-6-9 cycle
⏳ Key reversal points calculated with Time Cycle Lines
📉 Smart price action based on real Order Blocks and liquidity
🧠 A core belief that “Time is more important than Price”, inspired by Gann and modern cycle theory.
---
✅ Now the real question is:
Do you see how the major shift happened exactly at a timed zone, not just a price level?
🗣️ Let me hear your thoughts:
Do you use time tools in your strategy?
Would you like to learn how I project these reversal zones in advance?
👇👇
💬 Drop your insights in the comments
🔁 Share with traders who think beyond indicators
➕ Follow me if you want to explore how Time-based analysis can give you a real edge.
#TradingView #Forex #MarketCycles #GannTheory #SmartMoneyConcepts #ForexStrategy #DigitalAnalysis #TimeAnalysis #PriceAction #DrGemy

NZDUSD Bullish Pressure coming innOANDA:NZDUSD have finally closed above 0.59485 which is weekly support and NZDUSD is respecting it nicely, now with bullish pressure came it: it will touch 0.60060 as its the most important level at the moment, if price closed above 0.60060 making it good support then next level is 0.60345 if price kept bullish.
Key levels to look are:
0.60060
0.60345
and finally 0.60633 as weekly high.
0.60633 as Strong Resistance.
This is good trade, don't overload your risk like greedy, be disciplined trader.
I manage trade on daily basis.
Use proper risk management
Looks like good trade.
Lets monitor.
Use proper risk management.
Disclaimer: only idea, not advice

NZD/USD is on the verge of a dropBased on the fractal structure and the highs and lows in the market, a trend reversal on NZD/USD is confirmed — a drop is coming.
Exit at the marked target, or secure the majority of your profits.

EURGBP – WEEKLY FORECAST Q3 | W30 | Y25📊 EURGBP – WEEKLY FORECAST
Q3 | W30 | Y25
Weekly Forecast 🔍📅
Here’s a short diagnosis of the current chart setup 🧠📈
Higher time frame order blocks have been identified — these are our patient points of interest 🎯🧭.
It’s crucial to wait for a confirmed break of structure 🧱✅ before forming a directional bias.
This keeps us disciplined and aligned with what price action is truly telling us.
📈 Risk Management Protocols
🔑 Core principles:
Max 1% risk per trade
Only execute at pre-identified levels
Use alerts, not emotion
Stick to your RR plan — minimum 1:2
🧠 You’re not paid for how many trades you take, you’re paid for how well you manage risk.
🧠 Weekly FRGNT Insight
"Trade what the market gives, not what your ego wants."
Stay mechanical. Stay focused. Let the probabilities work.
FRGNT FOREX ANALYSIS 📊

GBPCAD – WEEKLY FORECAST Q3 | W30 | Y25📊 GBPCAD – WEEKLY FORECAST
Q3 | W30 | Y25
Weekly Forecast 🔍📅
Here’s a short diagnosis of the current chart setup 🧠📈
Higher time frame order blocks have been identified — these are our patient points of interest 🎯🧭.
It’s crucial to wait for a confirmed break of structure 🧱✅ before forming a directional bias.
This keeps us disciplined and aligned with what price action is truly telling us.
📈 Risk Management Protocols
🔑 Core principles:
Max 1% risk per trade
Only execute at pre-identified levels
Use alerts, not emotion
Stick to your RR plan — minimum 1:2
🧠 You’re not paid for how many trades you take, you’re paid for how well you manage risk.
🧠 Weekly FRGNT Insight
"Trade what the market gives, not what your ego wants."
Stay mechanical. Stay focused. Let the probabilities work.
FRGNT FOREX ANALYSIS 📊

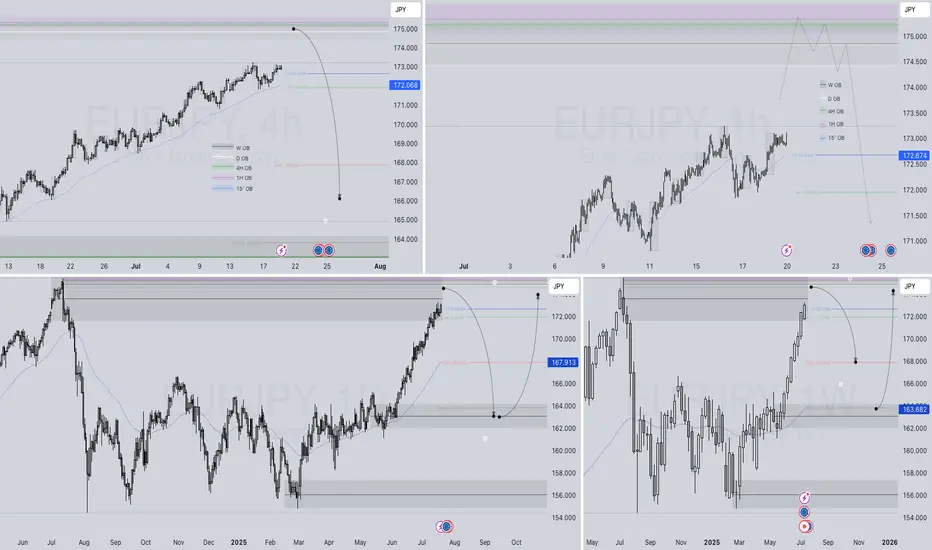
EURJPY – WEEKLY FORECAST Q3 | W30 | Y25📊 EURJPY – WEEKLY FORECAST
Q3 | W30 | Y25
Weekly Forecast 🔍📅
Here’s a short diagnosis of the current chart setup 🧠📈
Higher time frame order blocks have been identified — these are our patient points of interest 🎯🧭.
It’s crucial to wait for a confirmed break of structure 🧱✅ before forming a directional bias.
This keeps us disciplined and aligned with what price action is truly telling us.
📈 Risk Management Protocols
🔑 Core principles:
Max 1% risk per trade
Only execute at pre-identified levels
Use alerts, not emotion
Stick to your RR plan — minimum 1:2
🧠 You’re not paid for how many trades you take, you’re paid for how well you manage risk.
🧠 Weekly FRGNT Insight
"Trade what the market gives, not what your ego wants."
Stay mechanical. Stay focused. Let the probabilities work.
FRGNT FOREX ANALYSIS 📊
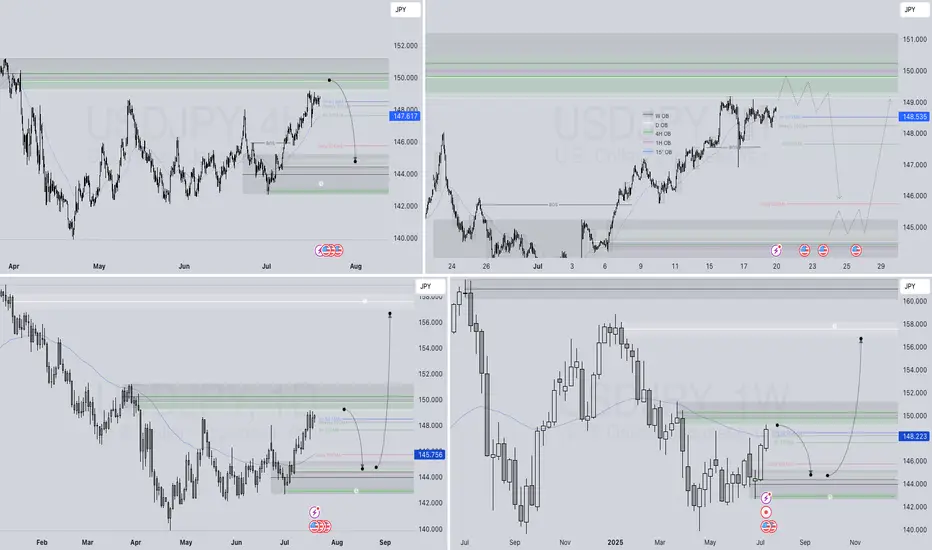
USDJPY – WEEKLY FORECAST Q3 | W30 | Y25📊 USDJPY – WEEKLY FORECAST
Q3 | W30 | Y25
Weekly Forecast 🔍📅
Here’s a short diagnosis of the current chart setup 🧠📈
Higher time frame order blocks have been identified — these are our patient points of interest 🎯🧭.
It’s crucial to wait for a confirmed break of structure 🧱✅ before forming a directional bias.
This keeps us disciplined and aligned with what price action is truly telling us.
📈 Risk Management Protocols
🔑 Core principles:
Max 1% risk per trade
Only execute at pre-identified levels
Use alerts, not emotion
Stick to your RR plan — minimum 1:2
🧠 You’re not paid for how many trades you take, you’re paid for how well you manage risk.
🧠 Weekly FRGNT Insight
"Trade what the market gives, not what your ego wants."
Stay mechanical. Stay focused. Let the probabilities work.
FRGNT FOREX ANALYSIS 📊
EURUSD – WEEKLY FORECAST Q3 | W30 | Y25📊 EURUSD – WEEKLY FORECAST
Q3 | W30 | Y25
Weekly Forecast 🔍📅
Here’s a short diagnosis of the current chart setup 🧠📈
Higher time frame order blocks have been identified — these are our patient points of interest 🎯🧭.
It’s crucial to wait for a confirmed break of structure 🧱✅ before forming a directional bias.
This keeps us disciplined and aligned with what price action is truly telling us.
📈 Risk Management Protocols
🔑 Core principles:
Max 1% risk per trade
Only execute at pre-identified levels
Use alerts, not emotion
Stick to your RR plan — minimum 1:2
🧠 You’re not paid for how many trades you take, you’re paid for how well you manage risk.
🧠 Weekly FRGNT Insight
"Trade what the market gives, not what your ego wants."
Stay mechanical. Stay focused. Let the probabilities work.
FRGNT FOREX ANALYSIS 📊

#ETH look for the false breakoutany false break out to the area of
2400-2500
will be a good buy sign with stop below 3200 and target 4300
trade safe and follow me 😉

TESLA SELL PLAN – BEWARE BUYERS, FUEL IS BELOW📉 TESLA SELL PLAN – BEWARE BUYERS, FUEL IS BELOW
🔻 Market Structure:
Recent bullish push retraced into a bearish fair value gap (FVG), indicating potential exhaustion in buying.
🟥 Supply Zone Hit:
Price revisited the FVG zone and faced rejection twice, showing sellers are active at that level.
👁️ Liquidity Eyes:
Two major liquidity pools are clearly marked below – price may seek these resting liquidity areas.
🔻 Bias:
Bearish, as price reacted from premium FVG and is forming lower highs.
📍 Execution Plan:
Monitor for continuation patterns on lower timeframe within context.
Ideal short entries can be found after confirmation rejections from FVG zone.
Expect internal liquidity sweeps before the major drop.
🎯 Target:
Watch for price to draw down toward the external liquidity zones below, especially near previous macro demand areas.
⚠️ Note for Buyers:
Current retracement is likely corrective. Until price breaks structure and invalidates the bearish FVG, upside is risky.

EURCHFA 100% opportunity on EUR/CHF —
The fractal structure confirms a bullish trend, and the marked zone is based on an “N” pattern setup.
