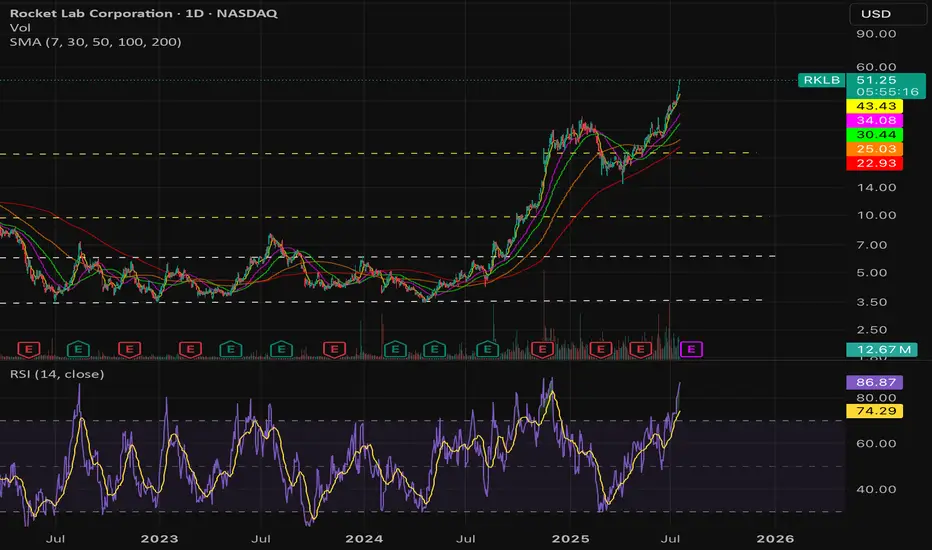
$RKLB Overvalued asf! - NASDAQ:RKLB is overvalued. I will either stay on the sidelines or short the heck out of this POS.
- Company sells hopium which doesn't have meaningful materialization as of now and not even in the distant future.
Fundamentally,
2025 | 2026 | 2027 | 2028
-0.32 | -0.08 | 0.17 | 0.47
Revenue:
576.83M | 905.01M | 1.21B | 1.69B
- Market cap of NASDAQ:RKLB currently sits at 24.61B as of July 17, 2025.
- People who are buying now are buying someone else bag and are in for a horrible ride.
- Consider buying it under $15 if you are super bullish
Gann
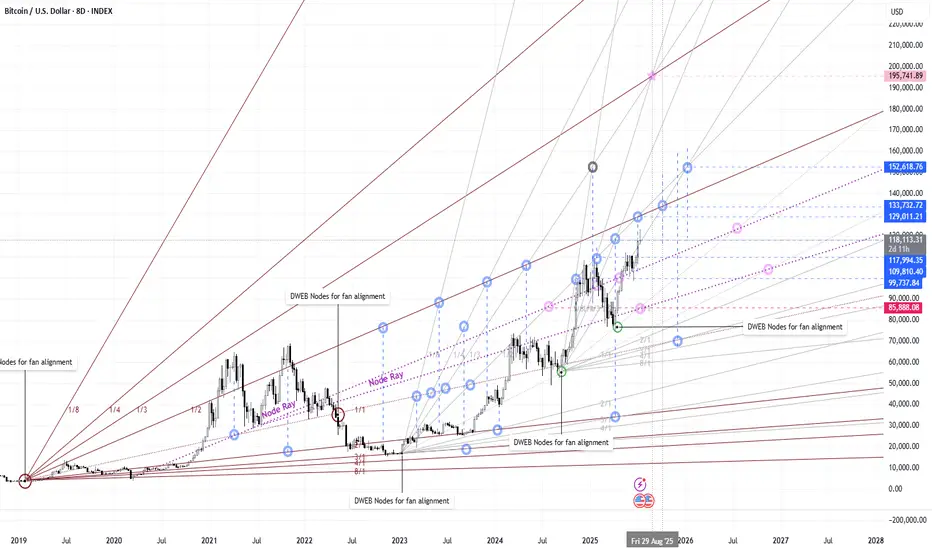
DWEB Node trends, intersects, levels, pivotsWith DWEB indicator , you find the major node trendline built between 2 nodes of the same color ( start with same color). With those nodes and the line given you then have a start point and the alignment for Gann fans and rays. These fans and rays, when properly placed will provide very accurate trends to follow into the future. When using multiple node trends with fans and rays, you will find that when things are aligned properly, the points at which the lines intersect more than likely hold some form of data. This can be in time/pivot zones (x), price levels (y) or both. Take a close look, this chart took all of 20 mins to build and I am willing to bet there is much more data found and drawing tools used to help predict future trends an price action. Sine, Fib, geometry etc. . See the original chart here with DWEB nodes ON.
Long term I am very bullish on BTC. This is an 8D chart so keep that in mind.
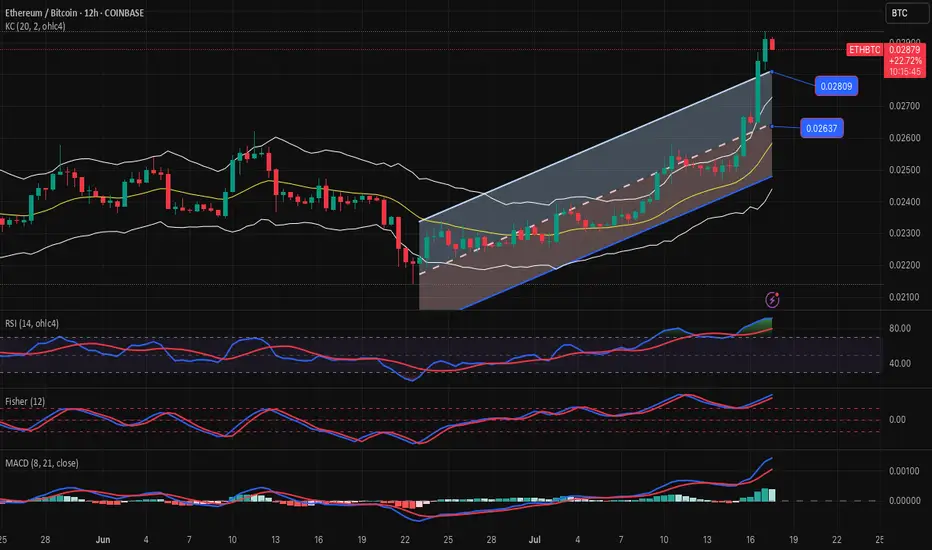
ETHBTC-SELL strategy 12 hourly chrt Reg. ChannelETH is more overvalued than BTC, hence selling this combo may make sense.
Strategy SELL @ 0.028800 area and take profit near 0.26500.
AUDCHF Buy PlanChatGPT said:
📈 AUDCHF Buy Plan
Bias: Bullish — Price tapped 4H demand zone (blue box).
Context: Liquidity swept below previous low. Price inside FVG zone.
Trigger: Wait for bullish confirmation from this zone (bullish candle or market structure shift).
Entry: Upon confirmation within context area.
Stop Loss: Below the recent swing low.
Target: H4 swing high or higher liquidity zone.
Risk: Adjust position size to maintain fixed % risk (as per your plan).
Note: Ignore past price action. Focus only if trade aligns with your system.
Let price breathe. Execute only when criteria match

The Crypto Market Shaken by USDe Collapse – What’s Next for BtcIn early July 2025, the crypto market was rocked by the sudden destabilization of one of the fastest-growing stablecoins — USDe by Ethena. In just a few days, the token lost over 10% of its value, dropping to $0.88. This triggered a wave of liquidations across DeFi protocols and a sharp decline in major crypto assets like Bitcoin and Ethereum.
Why USDe Collapsed
The main cause of the collapse was a weak collateral model. Unlike USDT and USDC, USDe lacked full fiat backing. Its reserves were partially based on derivatives and complex hedging strategies. When a few large wallets began withdrawing liquidity, panic spread quickly. The rush to exit USDe overwhelmed the system, breaking the $1 peg.
This led to an accelerated loss of trust and triggered cascading liquidations across multiple DeFi platforms.
Impact on DeFi and the Broader Market
DeFi was hit hard. The total value locked (TVL) across major protocols like Aave, Curve, and MakerDAO dropped by 17% in one week. Some platforms halted USDe-related activity to contain losses.
Bitcoin fell below $58,000, and Ethereum dropped under $3,000, driven not only by lower liquidity but also by renewed skepticism from institutional investors. The volatility in what was perceived as a “safe” asset reignited debates around the future of algorithmic stablecoins.
What Happens Next?
The fallout from USDe is a major stress test for the entire DeFi ecosystem. If the team behind Ethena fails to restore trust, other algorithmic stablecoins could come under pressure. There are already growing calls for greater transparency, independent audits, and stricter collateralization rules.
On the flip side, many see this as a healthy correction — a purge of undercollateralized, risky experiments. The long-term winners could be robust, transparent protocols, and Bitcoin, with its capped supply and increasing institutional demand, may once again be seen as a flight-to-safety asset.
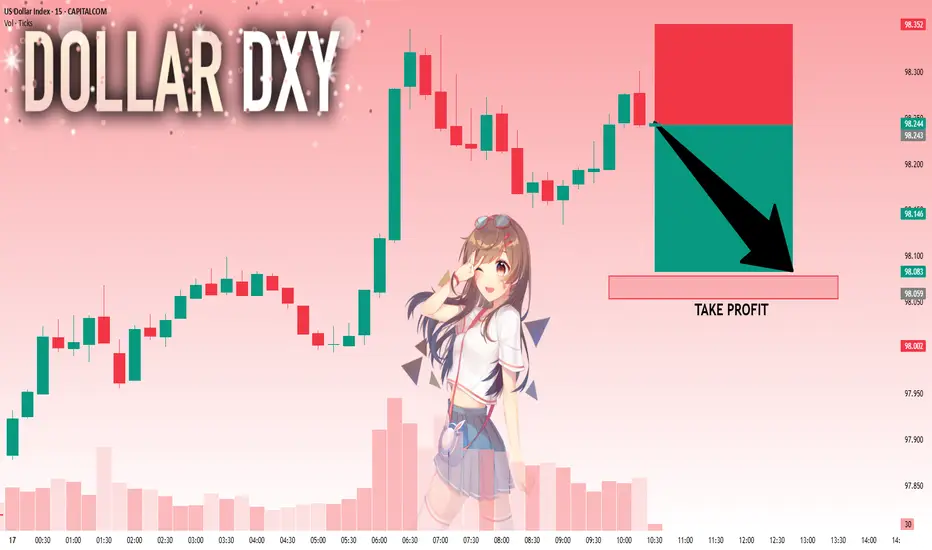
DXY: Next Move Is Down! Short!
My dear friends,
Today we will analyse DXY together☺️
The price is near a wide key level
and the pair is approaching a significant decision level of 98.243 Therefore, a strong bearish reaction here could determine the next move down.We will watch for a confirmation candle, and then target the next key level of 98.078..Recommend Stop-loss is beyond the current level.
❤️Sending you lots of Love and Hugs❤️
#SEI/USDT#SEI
The price is moving within a descending channel on the 1-hour frame, adhering well to it, and is on its way to breaking strongly upwards and retesting it.
We have support from the lower boundary of the descending channel at 0.3450.
We have a downtrend on the RSI indicator that is about to break and retest, supporting the upside.
There is a major support area in green at 0.3380, which represents a strong basis for the upside.
Don't forget a simple thing: ease and capital.
When you reach the first target, save some money and then change your stop-loss order to an entry order.
For inquiries, please leave a comment.
We have a trend to hold above the 100 Moving Average.
Entry price: 0.3580
First target: 0.3684
Second target: 0.3850
Third target: 0.4016
Don't forget a simple thing: ease and capital.
When you reach your first target, save some money and then change your stop-loss order to an entry order.
For inquiries, please leave a comment.
Thank you.

EURUSD: Target Is Up! Long!
My dear friends,
Today we will analyse EURUSD together☺️
The recent price action suggests a shift in mid-term momentum. A break above the current local range around 1.15850 will confirm the new direction upwards with the target being the next key level of 1.16039 and a reconvened placement of a stop-loss beyond the range.
❤️Sending you lots of Love and Hugs❤️

GOLD: Move Up Expected! Long!
My dear friends,
Today we will analyse GOLD together☺️
The in-trend continuation seems likely as the current long-term trend appears to be strong, and price is holding above a key level of 3,327.26 So a bullish continuation seems plausible, targeting the next high. We should enter on confirmation, and place a stop-loss beyond the recent swing level.
❤️Sending you lots of Love and Hugs❤️

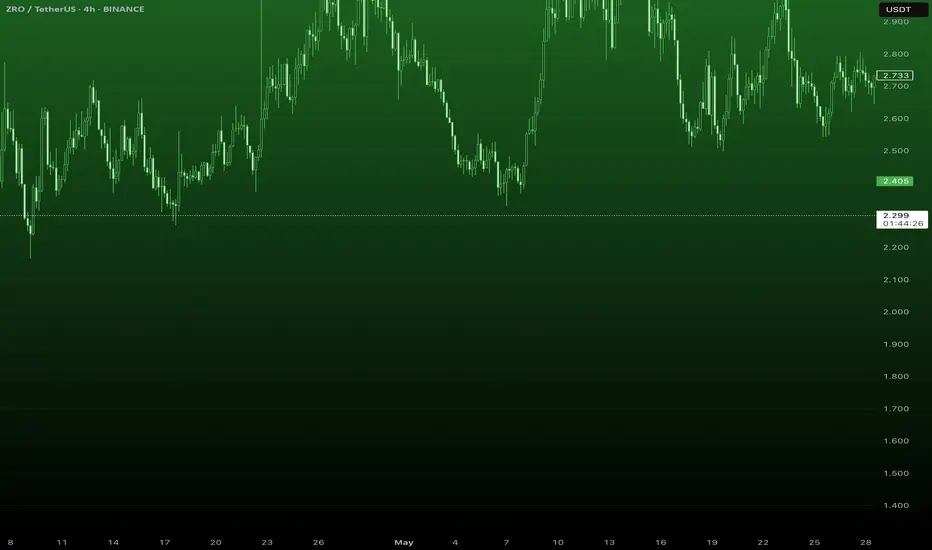
ZROUSDT lets sing a song 🎧
📌 Key Elements on Chart:
🔴 Resistance Zones (Red Boxes):
Marked from approx 2.35 to 2.50 USDT
Multiple red boxes stacked → showing layered resistance
Price is nearing the upper edge, suggesting rejection likely
🟡 Gann-Like Fan Lines (Yellow):
Multiple ascending support/resistance lines
Price is currently near the upper boundary, testing this zone
🔵 Vertical Time Lines (Cycle Dates):
Marked important time zones where reversal might occur
Noted dates:
July 18, 2025
July 20, 2025
July 21, 2025
Possibly July 22, 2025
🔽 Bearish Arrows:
Arrows indicate expected movement:
Price touches upper resistance
Breaks below fan supports
Heads toward 1.90 – 1.60 USDT range
🧠 Interpretation of This Idea:
You’re expecting a trend reversal after hitting the resistance zone near 2.40–2.50.
Time-based Gann or cycle analysis suggests mid-late July 2025 as a potential trend change window.
The fan lines act as temporary support, but if broken, sharp drop is expected.
This is a counter-trend short setup based on price + time confluence.
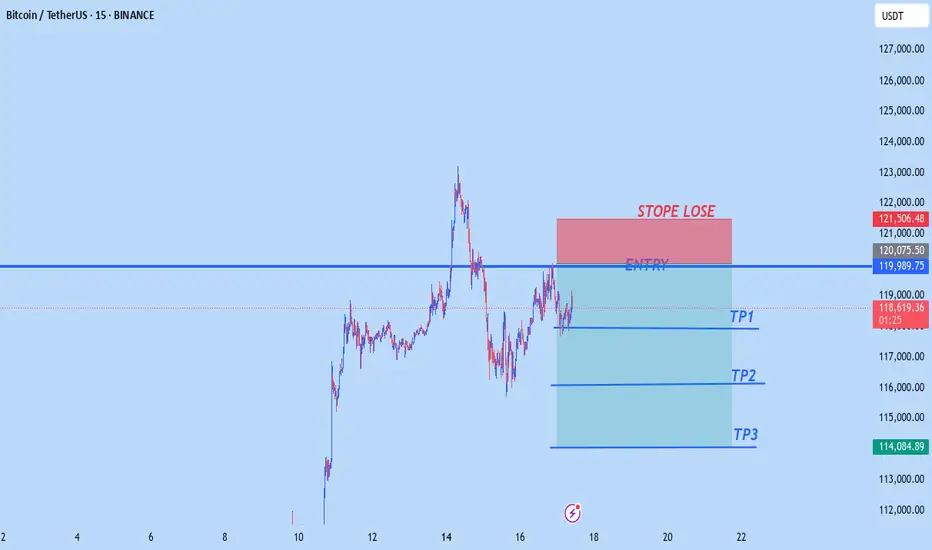
BTCUSD NEW OUTLOOK Btcusd sell from 120,000
tp1 118,000
tp2 116,000
tp3 114,000
Stopelose 121,500
Trade at your own risk
SILVER: Local Bearish Bias! Short!
My dear friends,
Today we will analyse SILVER together☺️
The market is at an inflection zone and price has now reached an area around 37.832 where previous reversals or breakouts have occurred.And a price reaction that we are seeing on multiple timeframes here could signal the next move down so we can enter on confirmation, and target the next key level of 37.762..Stop-loss is recommended beyond the inflection zone.
❤️Sending you lots of Love and Hugs❤️

#LEVER/USDT Forming Strong Falling Wedge#LEVER
The price is moving within a descending channel on the 1-hour frame and is expected to break and continue upward.
We have a trend to stabilize above the 100 moving average once again.
We have a downtrend on the RSI indicator that supports the upward move with a breakout.
We have a support area at the lower boundary of the channel at 0.0001915, acting as a strong support from which the price can rebound.
We have a major support area in green that pushed the price upward at 0.0001672.
Entry price: 0.0001955.
First target: 0.0002087.
Second target: 0.0002283.
Third target: 0.0002472.
To manage risk, don't forget stop loss and capital management.
When you reach the first target, save some profits and then change the stop order to an entry order.
For inquiries, please comment.
Thank you.

Long-Term Gold Analysis (XAU/USD)Gold has been stuck in a range for about 92 days, and recently, price action within the range has become increasingly compressed.
This tightening suggests that a breakout in either direction could lead to the beginning of a new long-term trend.

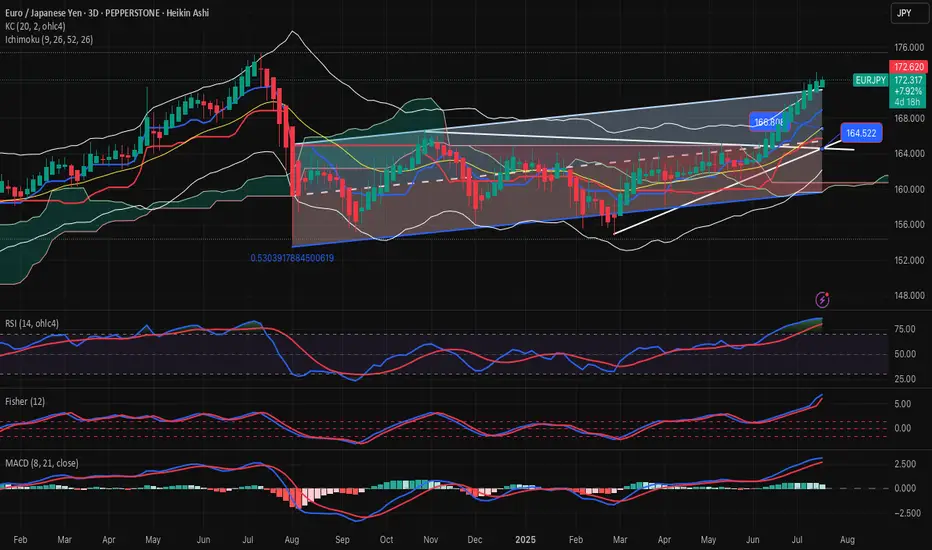
EURJPY-SELL strategy 3D chart Reg. ChannelThe pair is extremely overbought based on #D which means over time we likely see a recovery back to somewhere 168.00 area.
Strategy SELL @ 172.50-173.00 and take profit near 168.50 for now.
ETHUSD-SELL strategy 9 hourly chart Reg.ChannelNo doubt Crypto is more volatile than other asset classes, and even when very overbought it can run higher. It does not change the over all picture, and recovery is required over time. The correction is like to bring us back towards $ 2,875 area overall, but in steps .
Strategy SELL @ $ 3,300-3,375 and take profit near $ 3,025 at first, and re-sell after for a profit near $ 2,875.

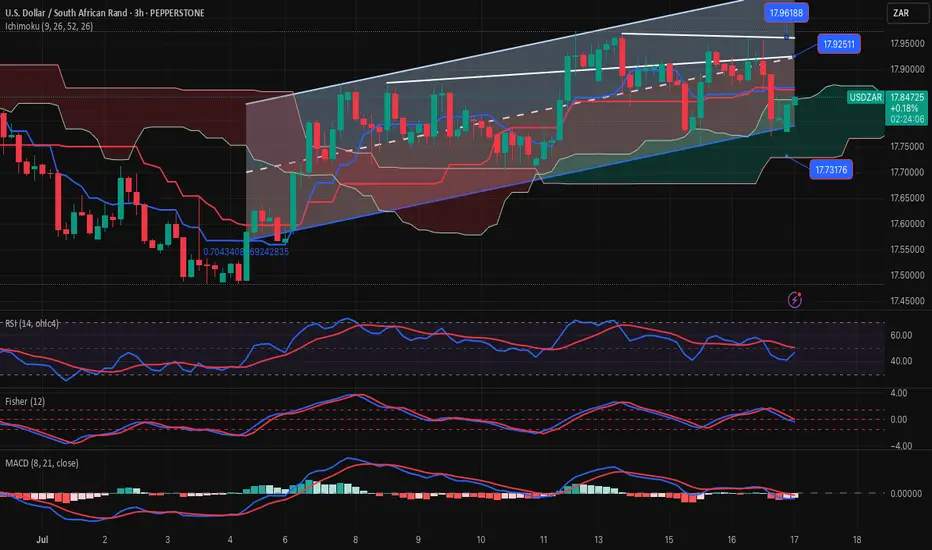
USDZAR-BUY strategy - RANGE 3 hourly chartThe pair is still within a wider range, and it feels we may remain so for a little longer. The direction feels moving higher again with cloud suport 17.7300 area, and i mproving indicators.
Strategy BUY @ 17.7875-17.8350 and take profit near 17.9875 for now.
USD/CAD is ready for takeoff.A highly strong trend is underway.
Based on market structure, USD/CAD is moving toward the 50% level of the daily bearish leg, and any resistance in its path is likely to be crushed.

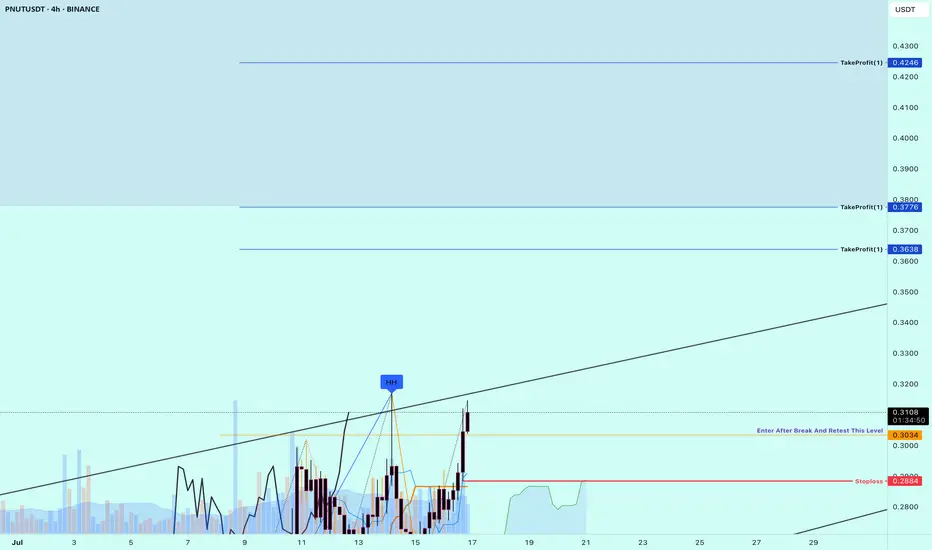
Buy Trade Strategy for PNUT: Exploring DeFi Yield Farming PotentDescription:
This trading idea is based on PNUT, the native token of the Peanut DeFi platform, which operates primarily within the SmartBCH ecosystem. PNUT plays a crucial role in powering yield farming, liquidity mining, and governance activities on the platform. With DeFi continuing to expand globally, projects like Peanut aim to offer accessible, low-cost, and efficient tools for users to participate in decentralized finance. The fundamentals of PNUT are supported by its utility, active community, and its positioning in an emerging blockchain environment with room for growth.
However, it is important to understand that PNUT operates in a highly volatile and speculative segment of the crypto market. DeFi protocols are particularly sensitive to shifts in regulation, platform security, and liquidity changes. While there may be upside potential, such assets require strict risk management and an informed investment strategy.
Disclaimer:
This trading idea is for educational purposes only and should not be considered as financial advice. Trading or investing in cryptocurrencies like PNUT involves substantial risk and may result in a complete loss of capital. Always do your own research, assess your financial situation carefully, and consult with a licensed financial advisor before making investment decisions. Past performance is not indicative of future results.
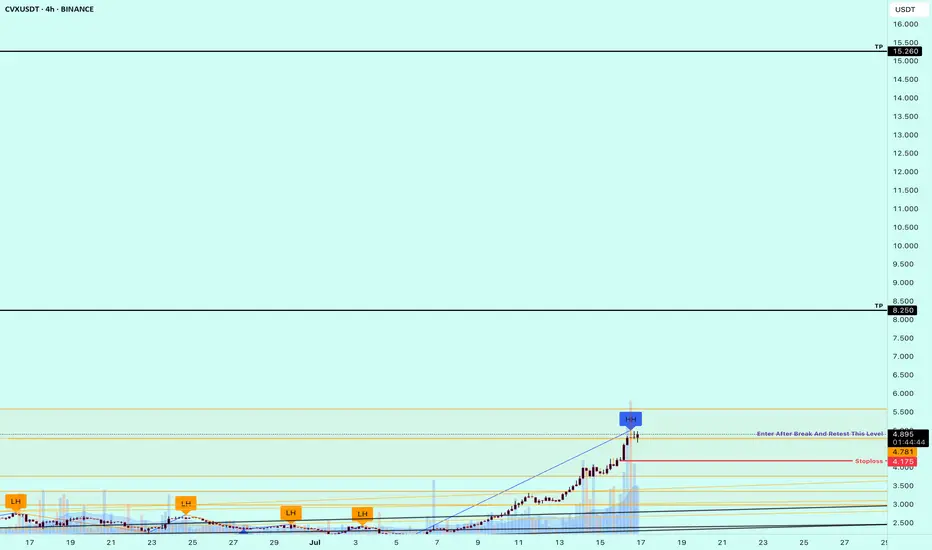
Buy Trade Strategy for CVX: Tapping into DeFi Yield OptimizationDescription:
This trading idea highlights CVX, the native token of Convex Finance, a key player in the DeFi ecosystem focused on optimizing yield farming within the Curve Finance protocol. CVX allows users to earn boosted rewards without locking their tokens directly into Curve, making it highly attractive for liquidity providers and yield seekers. With its growing influence over Curve’s governance and incentives, CVX has become a strategic asset in the DeFi landscape. As institutional interest and on-chain liquidity continue to grow, Convex's role in yield aggregation strengthens, potentially increasing demand for CVX.
Despite the strong fundamentals, the cryptocurrency market is unpredictable and susceptible to various external risks, including regulatory shifts, smart contract vulnerabilities, and overall market sentiment. Like all digital assets, CVX investments require careful consideration of both potential rewards and risks.
Disclaimer:
This trading idea is for educational purposes only and should not be interpreted as financial advice. Trading cryptocurrencies, including CVX, involves substantial risk and could result in the loss of your entire investment. Always do your own research, evaluate your financial situation, and consult with a licensed financial advisor before making any investment decisions. Past performance is not indicative of future results.
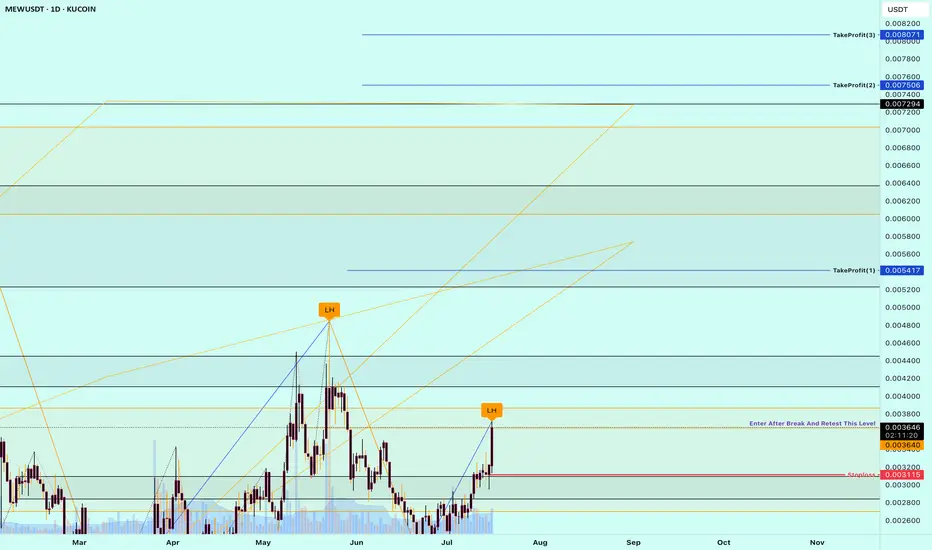
Buy Trade Strategy for MEW: Tapping Into the Meme Economy SurgeDescription:
This trading idea focuses on MEW, a rising star in the meme coin category that’s capturing community attention through strong online engagement and viral appeal. Unlike traditional cryptocurrencies, MEW leverages the power of internet culture and social media dynamics to drive visibility and adoption. With a growing holder base and active community, MEW stands as a speculative yet potentially rewarding asset for those looking to benefit from the explosive trends in the meme economy. Its branding, humor-driven outreach, and increasing listings on exchanges contribute to its early growth momentum.
Still, it’s important to remember that meme tokens are among the most volatile and unpredictable assets in the crypto market. Price swings can be rapid and sentiment-driven, making it essential to approach this asset class with a clear risk strategy and realistic expectations.
Disclaimer:
This trading idea is for educational purposes only and does not represent financial advice. Trading cryptocurrencies such as MEW involves substantial risk, including the possible loss of your entire investment. Always perform your own due diligence, evaluate your financial capacity, and consult a licensed financial advisor before investing. Past performance is not indicative of future outcomes.
USDJPY (Daily Update) 17/07hi everyone as we yesterdays video is pretty much showing us whats happened today i did not go in as much detail but hopefully this video you find helpful. as always happy trading

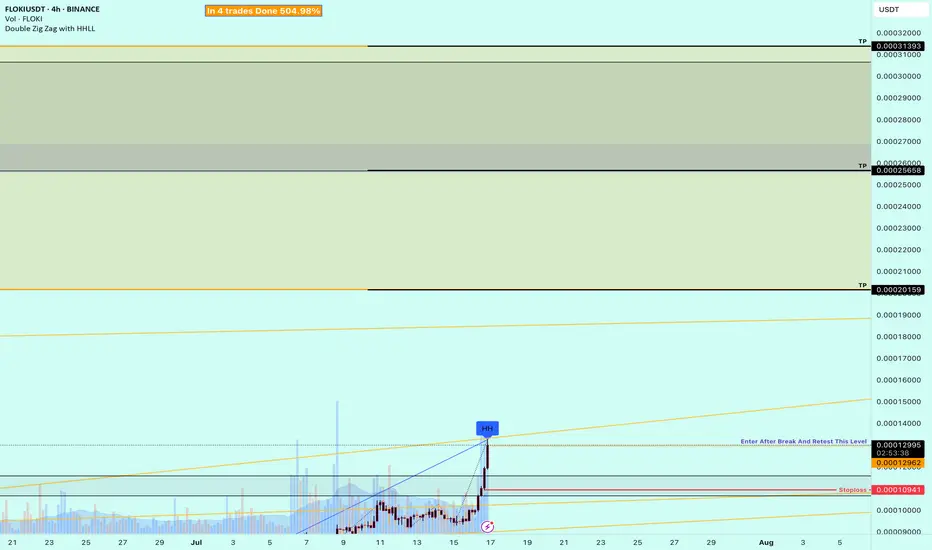
Buy Trade Strategy for FLOKI: Tapping Into Memecoin UtilityDescription:
This trading idea is centered on FLOKI, a cryptocurrency that originated as a memecoin but has evolved into a broader ecosystem project with real-world utility. Backed by a vibrant community and inspired by Elon Musk’s Shiba Inu, FLOKI aims to differentiate itself through initiatives such as Floki University (crypto education), Valhalla (an NFT metaverse game), and strategic charity partnerships. The project's growing utility and branding strength position it as a serious contender among memecoins shifting toward tangible use cases.
Despite its promising development roadmap, FLOKI remains a high-risk asset due to its origins in speculative hype and the unpredictable nature of retail-driven trends. External factors like market sentiment, regulatory scrutiny, and overall crypto market conditions can strongly influence its price action. Investors should exercise caution and apply disciplined risk management when considering exposure to FLOKI.
Disclaimer:
This trading idea is for educational purposes only and does not constitute financial advice. Cryptocurrencies like FLOKI are highly speculative and involve substantial risks, including the complete loss of capital. Always conduct independent research, consider your financial situation, and consult a licensed financial advisor before making any investment decisions. Past performance is not indicative of future results.