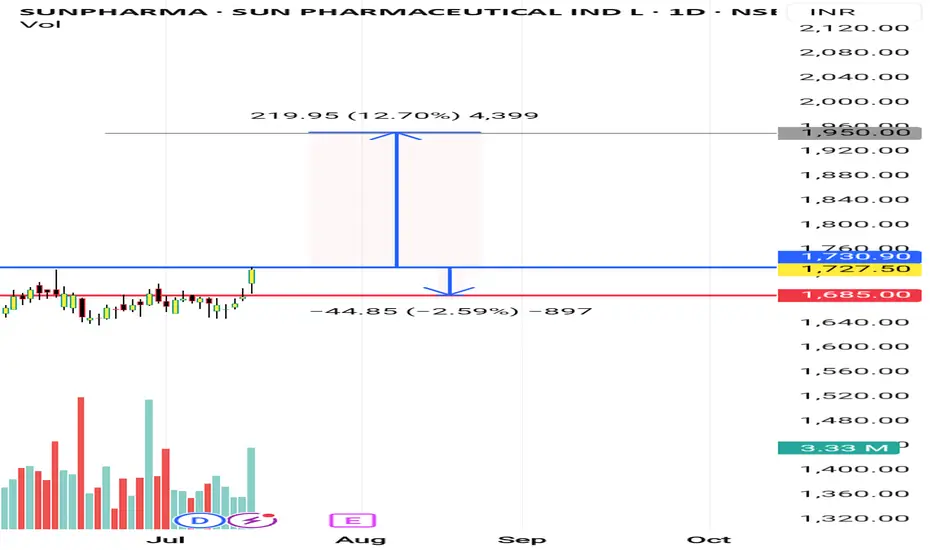
Sunpharma I'm not a SEBI REGISTERED ANYLISIS
just for learning purpose
above the blue line close in D chart candle i will buy and put strictly SL to below red line...once candle close below Red line in D chart...i will close the Trade...
Note: 1
Breakout candle should close time 6 or below 6 points I will buy same day or I will wait for the blue line price to re-trace)
Note:2
If previous volume is buyers(for ex- 10k) Breakout candle volume should be low in present day with buyers volume(below 10k for ex- 9k like this)
target check the chart
WAIT FOR ENTRY......then after
WAIT FOR TARGET...... or
WAIT FOR STOPLOSS
educational purpose only
oits simple ORB WITH VOLUME BREAKOUT STRATEGY...with small condition apply for selecting the stocks
owt not response for your profit and loss
Gann
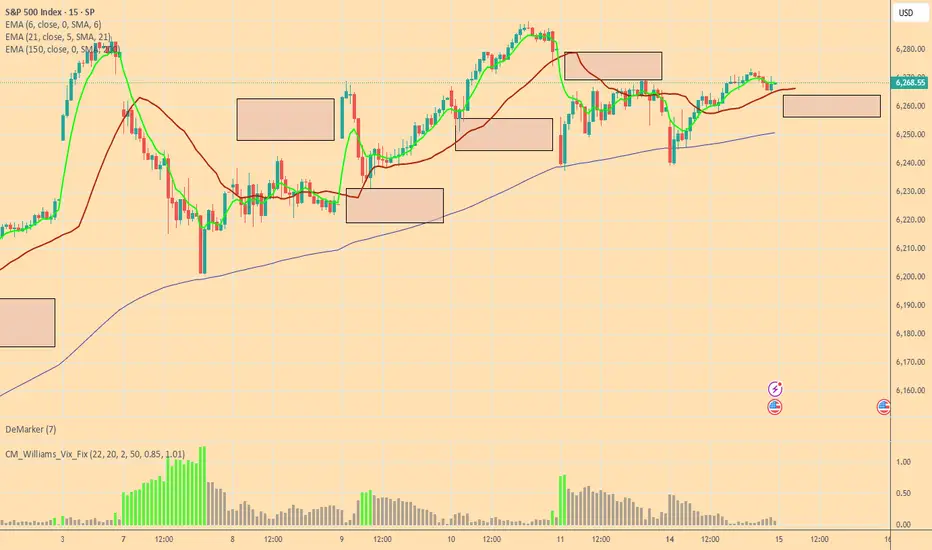
Bulls and Bears zone for 07-15-2025ETH session market is trading higher and expected to Open gap up.
Would traders be able to keep that momentum going rest of the RTH session.
Level to watch: 6328 --- 6330
Eth killer Today was a solid trading day with some interesting moves across the markets:
S&P 500: The market trended upwards from the open, gradually moving into and above the prior day’s value area, closing near the high of that range.
NASDAQ 100: After some initial back-and-forth, it climbed above the prior day’s high and value area, showing strength into the close.
Russell 2000: This market was quite choppy and balanced for a good part of the session, but eventually pushed up to close near the prior value area high.
Gold: It stayed range-bound, moving between the CVA high and the prior day’s value area without breaking out.
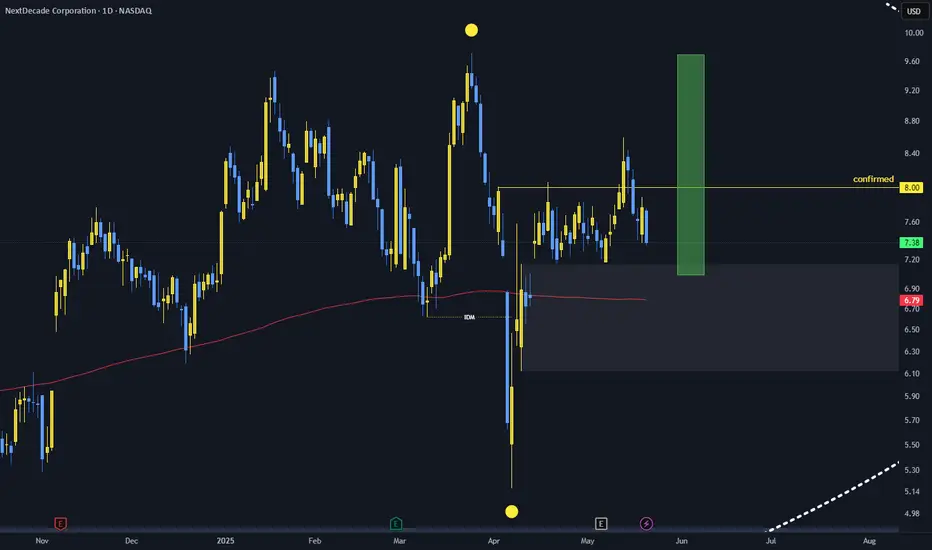
Bullishpossible entry covering the green rectangle.
i see a new high but price do whatever it likes and may fail. so, as usual it's NOT a financial advice.
I share my thoughts, hope to hear from you. Auf Wiedersehen!
US30: Bears Are Winning! Short!
My dear friends,
Today we will analyse US30 together☺️
The price is near a wide key level
and the pair is approaching a significant decision level of 44,420.7 Therefore, a strong bearish reaction here could determine the next move down.We will watch for a confirmation candle, and then target the next key level of 44,379.6..Recommend Stop-loss is beyond the current level.
❤️Sending you lots of Love and Hugs❤️

SILVER: Next Move Is Down! Short!
My dear friends,
Today we will analyse SILVER together☺️
The recent price action suggests a shift in mid-term momentum. A break above the current local range around 38.253 will confirm the new direction upwards with the target being the next key level of 38.151 and a reconvened placement of a stop-loss beyond the range.
❤️Sending you lots of Love and Hugs❤️

GOLD: Target Is Up! Long!
My dear friends,
Today we will analyse GOLD together☺️
The in-trend continuation seems likely as the current long-term trend appears to be strong, and price is holding above a key level of 3,363.43 So a bullish continuation seems plausible, targeting the next high. We should enter on confirmation, and place a stop-loss beyond the recent swing level.
❤️Sending you lots of Love and Hugs❤️

BTC BIG SHORT!We did a mirror retest, and many other signals also point to a sharp decline, indicating numerological codes 69/96.

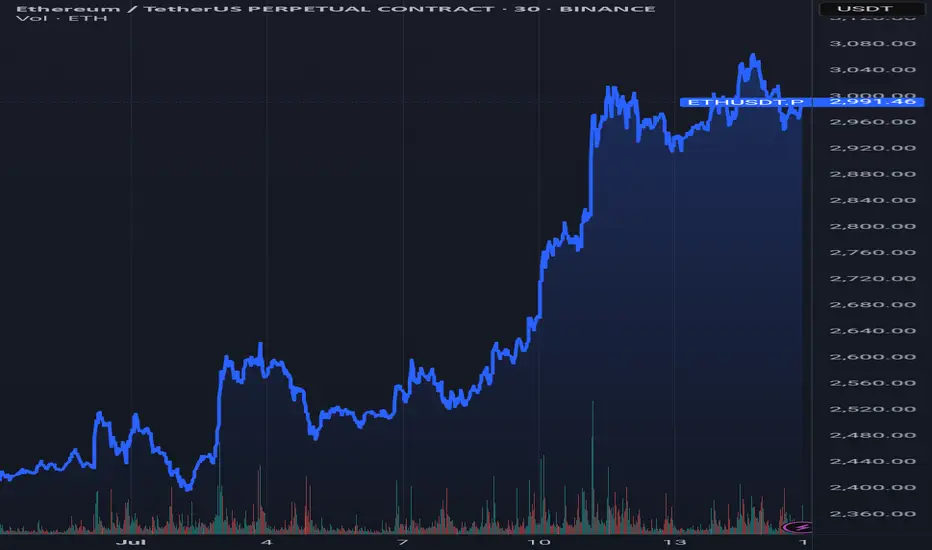
ETHUSDHonestly, I’ve seen a lot of people say Ethereum isn’t what it used to be — not as active, not as hyped, maybe even “dying” compared to a couple of years ago. 🚶♂️📉
But here’s the thing: I didn’t get into ETH for the quick hype. I got in around $1,300, and I’m not planning on touching it until we’re somewhere around $6,500 or more. 🚀💎🙌
Ethereum is still the backbone of most real innovation in Web3 — smart contracts, DeFi, layer 2s, NFTs (yes, still alive), and massive institutional interest brewing beneath the surface. 🧠🔥
People forget: the best gains come when no one’s paying attention. The crowd’s asleep now… perfect. 😴🕵️♂️
I'm not here for short-term noise — I'm here for long-term value.
I’d rather hold strong while the market underestimates it, than chase FOMO later when it’s back on headlines. 💼🕰️📈
Let them doubt — I’m holding.
Let them forget — I’m positioning.
Let them sell — I’m accumulating. ⚖️🧘♂️
$6,500 isn’t a dream, it’s just the beginning.
ETH isn’t dead — it’s just recharging. ⚡️💻🧬

EURUSD: Move Up Expected! Long!
My dear friends,
Today we will analyse EURUSD together☺️
The market is at an inflection zone and price has now reached an area around 1.16869 where previous reversals or breakouts have occurred.And a price reaction that we are seeing on multiple timeframes here could signal the next move up so we can enter on confirmation, and target the next key level of 1.16975.Stop-loss is recommended beyond the inflection zone.
❤️Sending you lots of Love and Hugs❤️

July 14 Bitcoin Bybit chart analysisHello
It's a Bitcoin Guide.
If you "follow"
You can receive real-time movement paths and comment notifications on major sections.
If my analysis was helpful,
Please click the booster button at the bottom.
This is a Bitcoin 30-minute chart.
There is no separate Nasdaq indicator announcement.
Nasdaq upper gap reversal condition and
Bitcoin is moving sideways after a sharp rebound until the afternoon.
I created today's strategy based on the vertical decline condition based on the 5-minute trend reversal in Tether Dominance.
On the lower left, I connected the long position entry section of 117,451.1 dollars that I entered on the 11th.
* In the case of the red finger movement path,
This is a one-way long position
current position chase purchase strategy.
1. Chasing purchase at 121,897.1 dollars / Stop loss price when the green support line is broken
2. 124,639.5 dollars long position 1st target -> Good, Great in order of target price
Since I left a simulation in the middle,
I think it would be good to use it for re-entry after liquidating the long position.
The movement within the 1st section at the top and the 2nd section at the bottom
is an extreme sideways movement, and from a long position,
if it succeeds in rebounding within the 2nd section, it becomes a strong upward condition.
From the 3rd section breakout today,
the low point is broken in the newly created weekly and daily chart candles this week,
so please note that the upward trend may be delayed.
The next support line is the Gap8 section created last week.
Up to this point, I ask that you simply refer to and utilize my analysis
and I hope that you operate safely with principle trading and stop loss prices.
Thank you.

USDJPY LONG & SHORT – DAILY FORECAST Q3 | D15 | W29 | Y25💼 USDJPY LONG & SHORT – DAILY FORECAST
Q3 | D15 | W29 | Y25
📊 MARKET STRUCTURE SNAPSHOT
USDJPY is currently reaching for a key higher time frame supply zone, looking for price action to show weakness at premium levels. Structure and momentum are now aligning for a short opportunity backed by multi-timeframe confluence.
🔍 Confluences to Watch 📝
✅ Daily Order Block (OB)
Looking for Strong reaction and early signs of distribution.
✅ 4H Order Block
Break of internal structure (iBoS) confirms a short-term bearish transition.
✅ 1H Order Block
📈 Risk Management Protocols
🔑 Core principles:
Max 1% risk per trade
Only execute at pre-identified levels
Use alerts, not emotion
Stick to your RR plan — minimum 1:2
🧠 You’re not paid for how many trades you take, you’re paid for how well you manage risk.
🧠 Weekly FRGNT Insight
"Trade what the market gives, not what your ego wants."
Stay mechanical. Stay focused. Let the probabilities work.
🏁 Final Thoughts from FRGNT
📌 The structure is clear.
The confluences are stacked.
Let execution follow discipline, not emotion.

USDCAD LONG DAILY FORECAST Q3 D15 W29 Y25USDCAD LONG DAILY FORECAST Q3 D15 W29 Y25
Professional Risk Managers👋
Welcome back to another FRGNT chart update📈
Diving into some Forex setups using predominantly higher time frame order blocks alongside confirmation breaks of structure.
Let’s see what price action is telling us today! 👀
💡Here are some trade confluences📝
✅Daily Order block identified
✅4H Order Block identified
✅1H Order Block identified
🔑 Remember, to participate in trading comes always with a degree of risk, therefore as professional risk managers it remains vital that we stick to our risk management plan as well as our trading strategies.
📈The rest, we leave to the balance of probabilities.
💡Fail to plan. Plan to fail.
🏆It has always been that simple.
❤️Good luck with your trading journey, I shall see you at the very top.
🎯Trade consistent, FRGNT X

GBPCAD SHORT FORECAST Q3 D15 W29 Y25GBPCAD SHORT FORECAST Q3 D15 W29 Y25
Professional Risk Managers👋
Welcome back to another FRGNT chart update📈
Diving into some Forex setups using predominantly higher time frame order blocks alongside confirmation breaks of structure.
Let’s see what price action is telling us today! 👀
💡Here are some trade confluences📝
✅Daily Order block identified
✅4H Order Block identified
✅1H Order Block identified
🔑 Remember, to participate in trading comes always with a degree of risk, therefore as professional risk managers it remains vital that we stick to our risk management plan as well as our trading strategies.
📈The rest, we leave to the balance of probabilities.
💡Fail to plan. Plan to fail.
🏆It has always been that simple.
❤️Good luck with your trading journey, I shall see you at the very top.
🎯Trade consistent, FRGNT X

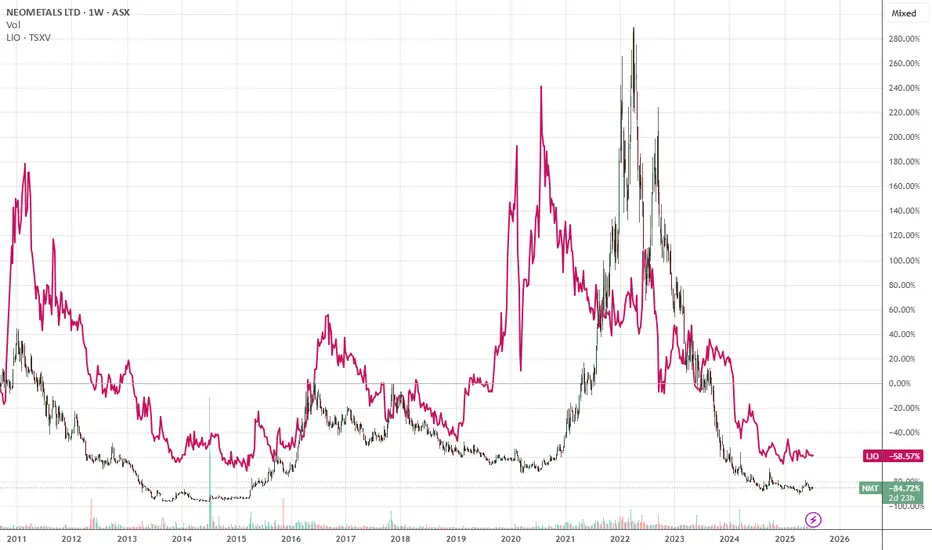
A sector wide issue, resources to double at leastA sector wide issue, resources to double at least. It seems to be a world wide issue that resources do not get valued well. Their Price to Earnings is often below 5, while tech often gets above 100. The growth does not warant that anymore.
EURJPY SHORT – DAILY FORECAST Q3 | W29 | D15 | Y25💼 EURJPY SHORT – DAILY FORECAST
Q3 | W29 | D15 | Y25
📊 MARKET STRUCTURE SNAPSHOT
EURJPY is currently reacting from a key higher time frame supply zone, with price action showing weakness at premium levels. Structure and momentum are now aligning for a short opportunity backed by multi-timeframe confluence.
🔍 Confluences to Watch 📝
✅ Daily Order Block (OB)
Strong reaction and early signs of distribution.
Previous bullish momentum is losing steam; structure is flattening with rejection wicks forming.
✅ 4H Order Block
Break of internal structure (iBoS) confirms a short-term bearish transition.
✅ 1H Order Block
1H structure shift bearish
📈 Risk Management Protocols
🔑 Core principles:
Max 1% risk per trade
Only execute at pre-identified levels
Use alerts, not emotion
Stick to your RR plan — minimum 1:2
🧠 You’re not paid for how many trades you take, you’re paid for how well you manage risk.
🧠 Weekly FRGNT Insight
"Trade what the market gives, not what your ego wants."
Stay mechanical. Stay focused. Let the probabilities work.
🏁 Final Thoughts from FRGNT
📌 The structure is clear.
The confluences are stacked.
Let execution follow discipline, not emotion.

AUDUSD SHORT & LONG FORECAST Q3 D15 W29 Y25AUDUSD SHORT & LONG FORECAST Q3 D15 W29 Y25
Professional Risk Managers👋
Welcome back to another FRGNT chart update📈
Diving into some Forex setups using predominantly higher time frame order blocks alongside confirmation breaks of structure.
Let’s see what price action is telling us today! 👀
💡Here are some trade confluences📝
✅Daily Order block identified
✅4H Order Block identified
✅1H Order Block identified
🔑 Remember, to participate in trading comes always with a degree of risk, therefore as professional risk managers it remains vital that we stick to our risk management plan as well as our trading strategies.
📈The rest, we leave to the balance of probabilities.
💡Fail to plan. Plan to fail.
🏆It has always been that simple.
❤️Good luck with your trading journey, I shall see you at the very top.
🎯Trade consistent, FRGNT X

It stopped (resisted) where the AI said it would! Very Exciting!Witness the precision: Price hit resistance exactly as predicted by AI analysis. Thrilling confirmation of my AI tech-driven trading insights!

GBPUSD LONG FORECAST Q3 D15 W29 Y25GBPUSD LONG FORECAST Q3 D15 W29 Y25
Welcome back to the watchlist GBPUSD ! Let's go long ! Alignment across all time frames.
Professional Risk Managers👋
Welcome back to another FRGNT chart update📈
Diving into some Forex setups using predominantly higher time frame order blocks alongside confirmation breaks of structure.
Let’s see what price action is telling us today!
💡Here are some trade confluences📝
✅Daily order block
✅1H Order block
✅Intraday breaks of structure
✅4H Order block
📈 Risk Management Principles
🔑 Core Execution Rules
Max 1% risk per trade
Set alerts — let price come to your levels
Minimum 1:2 RR
Focus on process, not outcomes
🧠 Remember, the strategy works — you just need to let it play out.
🧠 FRGNT Insight of the Day
"The market rewards structure and patience — not emotion or urgency."
Execute like a robot. Manage risk like a pro. Let the chart do the talking.
🏁 Final Words from FRGNT
📌 GBPUSD is offering textbook alignment — structure, order flow, and confirmation all check out.
Let’s approach the trade with clarity, conviction, and risk-managed execution.
🔑 Remember, to participate in trading comes always with a degree of risk, therefore as professional risk managers it remains vital that we stick to our risk management plan as well as our trading strategies.
📈The rest, we leave to the balance of probabilities.
💡Fail to plan. Plan to fail.
🏆It has always been that simple.
❤️Good luck with your trading journey, I shall see you at the very top.
🎯Trade consistent, FRGNT X

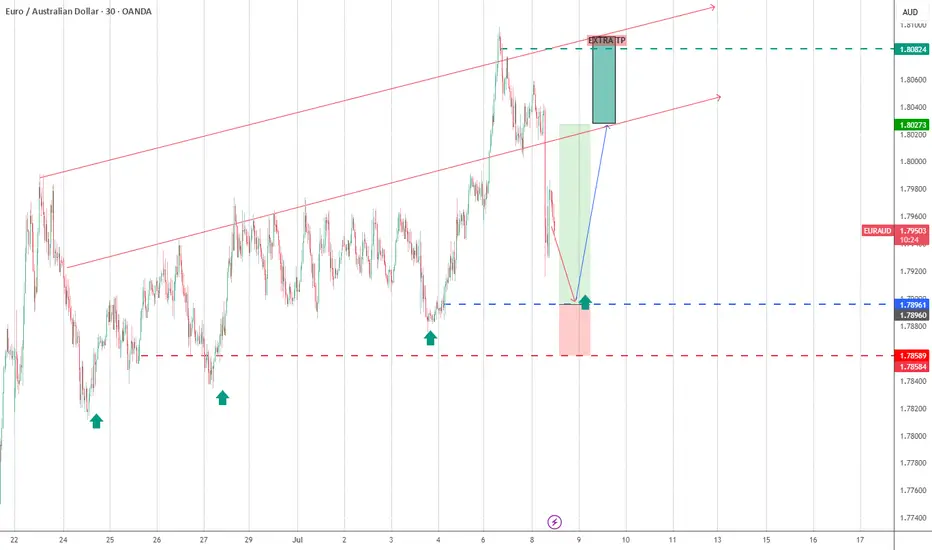
EURAUDLet’s focus on the EURAUD forex pair with a more tight and cautious approach compared to other setups. ⚠️📉
If price breaks our stop-loss, I won’t be interested in looking for buy entries at lower levels anymore. It’s important to respect the trade plan and avoid chasing the market. 🚫🔄
The week ended on a bullish note and the momentum has continued upward, but I will only consider entering if I see a proper price correction that offers a better risk-to-reward opportunity. 📈⏳
Patience is key here — waiting for the right pullback to optimize the entry and manage risk effectively will increase the chances of a successful trade. 🎯💡
Remember, disciplined trading always wins in the long run! 💪📊
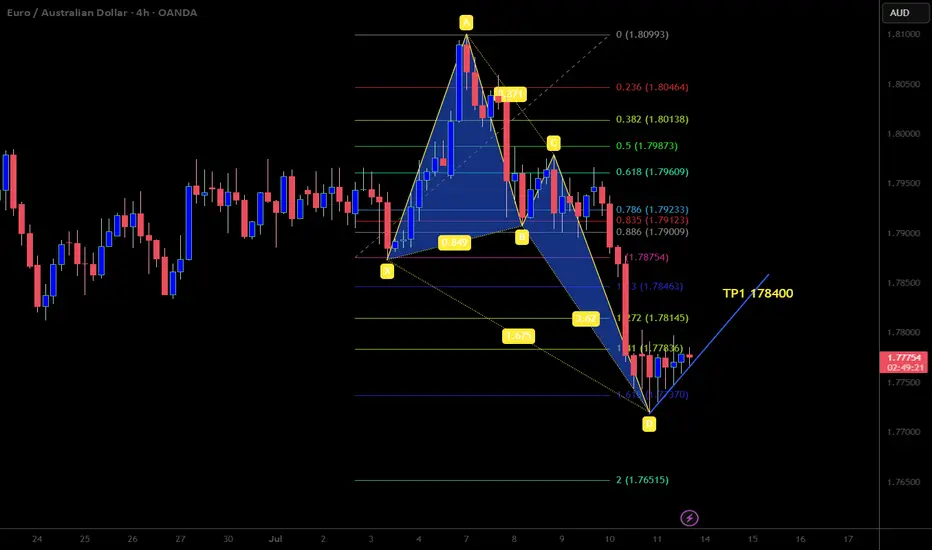
EURAUD BULLISH DEEP CRAB Looking for a huge bullish move here if price stays above our upwards trendline. If so, it'll be a great start to the week. Happy Trading.
CITYSTAR | AUDUSD ; SELL ANALYSE AUDUSD New Forecast👨💻👨💻
This is my personal trade and not in anyway a mandatory setup.
Note:
Follow proper risk management rules. Never risk more then 2% of your total capital. Money management is the key of success in this business...... Set your own SL & TP.
Please support this idea with a Like and COMMENT if you find it useful click "follow" on our profile if you will like these type of trading ideas delivered straight to your email in the future.
Thanks for your continued support!! lemme know your thoughts in the comment sec..

ETHUSD-SELL strategy 6 hourly chart Reg. ChannelIt is quite overbought, and besides, negative divergence is developing, and considering negative indicators, we should see move back to $ 2,900 > 2,775.
Strategy SELL @ $ 2,975 - 3,050 and take profit initially @ $ 2,840 for now.
