CITYSTAR | AUDUSD ; SELL ANALYSE AUDUSD New Forecast👨💻👨💻
This is my personal trade and not in anyway a mandatory setup.
Note:
Follow proper risk management rules. Never risk more then 2% of your total capital. Money management is the key of success in this business...... Set your own SL & TP.
Please support this idea with a Like and COMMENT if you find it useful click "follow" on our profile if you will like these type of trading ideas delivered straight to your email in the future.
Thanks for your continued support!! lemme know your thoughts in the comment sec..
Gann

ETHUSD-SELL strategy 6 hourly chart Reg. ChannelIt is quite overbought, and besides, negative divergence is developing, and considering negative indicators, we should see move back to $ 2,900 > 2,775.
Strategy SELL @ $ 2,975 - 3,050 and take profit initially @ $ 2,840 for now.


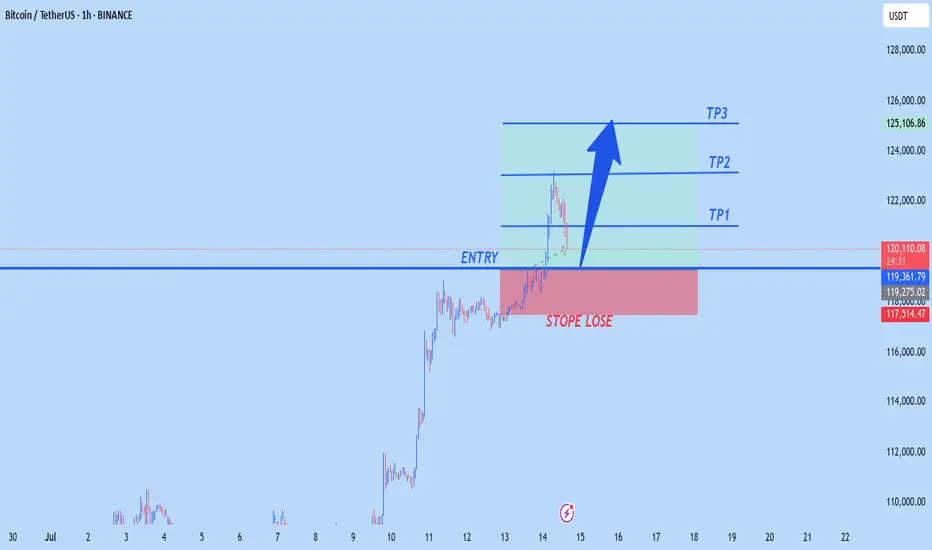
BTCUSD NEW OUTLOOKBtc buy from 119,000
TP1 122,000
Tp2 123,000
Tp3 125,000
STOPE LOSE 117,500
Trade at your own risk
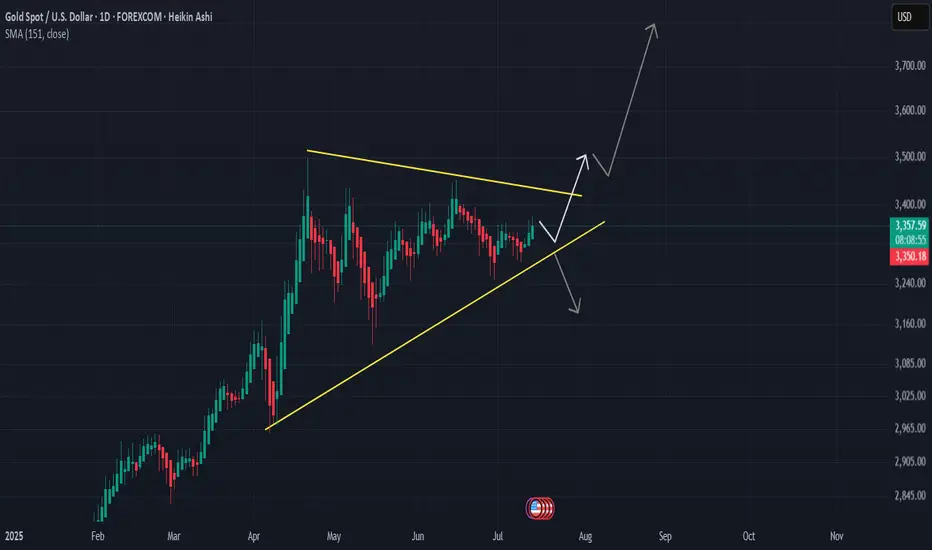
GOLD: Local Bearish Bias! Short!
My dear friends,
Today we will analyse GOLD together☺️
The price is near a wide key level
and the pair is approaching a significant decision level of 3,349.76 Therefore, a strong bearish reaction here could determine the next move down.We will watch for a confirmation candle, and then target the next key level of 3,341.88..Recommend Stop-loss is beyond the current level.
❤️Sending you lots of Love and Hugs❤️

EURUSD: Will Go Down! Short!
My dear friends,
Today we will analyse EURUSD together☺️
The recent price action suggests a shift in mid-term momentum. A break below the current local range around 1.16802 will confirm the new direction downwards with the target being the next key level of 1.16684.and a reconvened placement of a stop-loss beyond the range.
❤️Sending you lots of Love and Hugs❤️

Posible trade bueno With expectations of a bearish bias today, I'm looking for short entries. With an entry in a bearish order block.

DXY: The Market Is Looking Up! Long!
My dear friends,
Today we will analyse DXY together☺️
The in-trend continuation seems likely as the current long-term trend appears to be strong, and price is holding above a key level of 97.463 So a bullish continuation seems plausible, targeting the next high. We should enter on confirmation, and place a stop-loss beyond the recent swing level.
❤️Sending you lots of Love and Hugs❤️

Divergencia bajistaWe can se a bearish divergence on the daily chart, that could represent high sells and hihg sells power

SILVER: Strong Bullish Sentiment! Long!
My dear friends,
Today we will analyse SILVER together☺️
The market is at an inflection zone and price has now reached an area around 38.768 where previous reversals or breakouts have occurred.And a price reaction that we are seeing on multiple timeframes here could signal the next move up so we can enter on confirmation, and target the next key level of 38.937.Stop-loss is recommended beyond the inflection zone.
❤️Sending you lots of Love and Hugs❤️

XAUUSD - GOLD TO UP and never back down.never say never.
Due to the current and near-future military and political developments, gold will maintain its upward trend for a long time, and any short position will only be a temporary correction.
#SOL/USDT Loves THIS Pattern | BULLISH#SOL
The price is moving within a descending channel on the 1-hour frame, adhering well to it, and is on its way to breaking strongly upwards and retesting it.
We have a bounce from the lower boundary of the descending channel. This support is at 143.
We have a downtrend on the RSI indicator that is about to break and retest, supporting the upside.
There is a major support area in green at 142, which represents a strong basis for the upside.
Don't forget a simple thing: ease and capital.
When you reach the first target, save some money and then change your stop-loss order to an entry order.
For inquiries, please leave a comment.
We have a trend to hold above the moving average of 100.
Entry price: 149.
First target: 153.
Second target: 156.
Third target: 159.
Don't forget a simple thing: ease and capital.
When you reach the first target, save some money and then change your stop-loss order to an entry order.
For inquiries, please leave a comment.
Thank you.

#SUI/USDT ready to surge 13% toward $3.72 target?#SUI
The price is moving within a descending channel on the 1-hour frame, adhering well to it, and is on its way to breaking it strongly upwards and retesting it.
We have a bounce from the lower boundary of the descending channel. This support is at 3.30.
We have a downtrend on the RSI indicator that is about to be broken and retested, supporting the upside.
There is a major support area in green at 3.20, which represents a strong basis for the upside.
Don't forget a simple thing: ease and capital.
When you reach the first target, save some money and then change your stop-loss order to an entry order.
For inquiries, please leave a comment.
We have a trend to hold above the 100 Moving Average.
Entry price: 3.44
First target: 3.53
Second target: 3.62
Third target: 3.72
Don't forget a simple thing: ease and capital.
When you reach the first target, save some money and then change your stop-loss order to an entry order.
For inquiries, please leave a comment.
Thank you.

#PEOPLE/USDT trading opportunity#PEOPLE
The price is moving within a descending channel on the 1-hour frame and is expected to break and continue upward.
We have a trend to stabilize above the 100 moving average once again.
We have a downtrend on the RSI indicator that supports the upward break.
We have a support area at the lower boundary of the channel at 0.2030, acting as strong support from which the price can rebound.
We have a major support area in green that pushed the price upward at 0.02000.
Entry price: 0.02070
First target: 0.02140
Second target: 0.02210
Third target: 0.02288
To manage risk, don't forget stop loss and capital management.
When you reach the first target, save some profits and then change the stop order to an entry order.
For inquiries, please comment.
Thank you.

Buy Trade Strategy for COW: Backing MEV-Protected DEX EvolutionDescription:
This trading idea is centered on COW, the native token powering the CoW Protocol, a decentralized exchange (DEX) that uniquely focuses on protecting users from MEV (Maximal Extractable Value) attacks. COW enables a batch auction mechanism that matches orders peer-to-peer before accessing traditional liquidity pools, aiming for fairer and more cost-efficient trades. With growing concerns around MEV and gas efficiency in DeFi, CoW Protocol’s innovative architecture positions it as a promising infrastructure player in the decentralized trading space.
The COW token supports governance and aligns incentives among users, solvers, and liquidity providers, helping to build a more sustainable and democratic trading environment. As the protocol garners more attention and integration across DeFi tools, demand for COW may rise. That said, crypto markets are volatile, and broader adoption will depend on user trust, regulation, and technical execution.
Disclaimer:
This idea is shared for educational purposes only and should not be considered financial advice. Investing in cryptocurrencies like COW involves high risk, including the potential loss of all invested capital. Always conduct your own due diligence, understand the associated risks, and consult a licensed financial advisor before making any trading decisions. Past performance does not guarantee future results.

Buy Trade Strategy for ONDO: Bridging Traditional FinanceDescription:
This trading idea focuses on ONDO, a cryptocurrency that sits at the intersection of traditional finance and decentralized finance (DeFi). As the native token of Ondo Finance, ONDO powers a platform that aims to bring real-world assets—such as bonds and treasuries—onto the blockchain, enabling institutional-grade investment access for a broader audience. With increasing regulatory clarity around tokenized securities and rising demand for stable yield-generating products, ONDO is well-positioned to benefit from the convergence of conventional finance and DeFi innovation.
The project’s focus on compliance, transparency, and sustainable yield sets it apart in a crowded market. However, the crypto space remains volatile, and ONDO’s value is influenced by broader market conditions, regulatory dynamics, and investor sentiment.
Disclaimer:
This trading idea is for educational purposes only and should not be considered financial advice. Trading or investing in cryptocurrencies like ONDO carries significant risks, including the possibility of total capital loss. Always conduct your own due diligence, consider your personal financial situation, and consult a financial advisor before making any investment decisions. Past performance is not a reliable indicator of future results.

Buy Trade Strategy for POL: Backing the Future of Web3 GovernancDescription:
This trading idea highlights POL, the new token powering the next evolution of the Polygon ecosystem, which is shifting toward a more robust and scalable multichain architecture. Designed to eventually replace MATIC, POL introduces advanced staking and governance capabilities that aim to unify and secure various Layer 2 solutions under one interoperable umbrella. Its core function is to support validators across multiple Polygon chains, making it an essential asset for the future of decentralized Web3 infrastructure.
The migration to POL is more than a technical upgrade—it's a strategic move to strengthen long-term network sustainability and user empowerment. As adoption of Polygon’s technology continues to grow across DeFi, gaming, and enterprise solutions, POL is positioned to become a fundamental component of the next generation of blockchain governance.
Disclaimer:
This trading idea is for educational purposes only and is not to be considered financial advice. Investing in cryptocurrencies, including POL, carries a high level of risk and may result in the complete loss of capital. Always conduct your own due diligence, evaluate your personal financial situation, and consult a licensed financial advisor before making investment decisions. Past performance is not indicative of future results.

XAUUSD: Market analysis and strategy on July 14Gold technical analysis
Daily chart resistance 3412, support below 3339
Four-hour chart resistance 3400, support below 3349
One-hour chart resistance 3390, support below 3353
Gold news analysis: In the Asian market on Monday, spot gold hit a high of 3374, a new high since June 23. Trump announced last weekend that he would impose a 30% tariff on goods imported from the European Union from August 1, further heating up the market's concerns about international trade and providing momentum for gold prices to rise. Gold prices rose 1% last Friday, closing at 3357, as investors sought safe-haven assets after US President Trump announced multiple tariff measures. Analysts said the uncertainty premium has returned to the market again. Last week, Trump stepped up his tariff offensive against Canada, saying that the United States would impose a 35% tariff on Canadian imports in August and planned to impose a comprehensive tariff of 15% or 20% on most other trading partners. Trump also announced last week that he would impose a 50% tariff on imported copper and a 50% tariff on Brazilian goods.
Gold operation suggestions:
From the current trend analysis, the support below focuses on the four-hour level 3349--53 range support, and the upper pressure focuses on the suppression near the 3400-3412 range. The short-term long and short strength dividing line is 3350. If the four-hour level stabilizes above this position, continue to buy on dips.
Buy: 3350near
Buy: 3356near

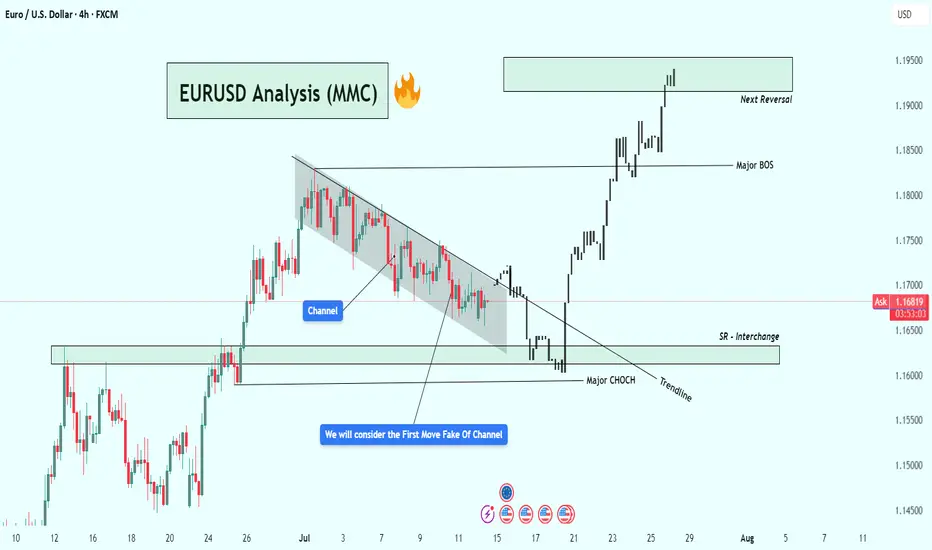
EURUSD Analysis – Smart Money Breakout + Reversal Zone in Play🔹 1. Bearish Channel & Liquidity Trap Setup
Price action from late June into mid-July formed a clearly defined descending channel, with consistent lower highs and lower lows. This structure likely attracted retail traders into short positions, expecting continued downside.
💡 Key Insight: The initial breakout of the channel was a fake move — often referred to as a liquidity grab or inducement. This is typical in smart money models where institutions trap early traders before the real move begins.
🔹 2. Major CHoCH (Change of Character)
Shortly after the fakeout, price sharply reversed and broke a major internal structure level, giving us our first CHoCH confirmation. This is a critical event in SMC, signaling a possible trend reversal from bearish to bullish.
Why it matters: A CHoCH after a channel + fakeout combo is a strong reversal signal, especially when supported by volume and aggression.
Visual cue: Look at the bullish engulfing momentum candle post-fakeout — this was the moment smart money entered.
🔹 3. Trendline Break + SR Interchange (Support/Resistance Flip)
Following the CHoCH, price broke the trendline and came back down to test a high-probability SR Interchange Zone — an area where previous resistance turned into fresh support.
This zone also aligns with the order block and inefficiency area, making it a premium entry for institutions.
Notice how price respected the zone before launching aggressively upward.
🧠 Note: This was the cleanest entry point in this setup — combining structure break, liquidity, and a demand zone.
🔹 4. Major BOS (Break of Structure)
After the retest, EURUSD broke the last major lower high, confirming a Bullish BOS (Break of Structure). This is where many traders realized the trend had shifted.
Market sentiment flipped from bearish to bullish.
Momentum increased, indicating institutional buying pressure.
🔹 5. Next Target: Reversal Zone (Supply Area)
Price has now reached a critical supply zone (1.1930 – 1.1970) where the next major reaction is likely to occur. This area was previously a strong rejection point, and it aligns with a potential higher timeframe supply zone.
⚠️ Watch for:
Bearish rejection wicks
Liquidity sweeps above highs
Bearish engulfing or mitigation patterns
CHoCH on lower timeframes (1H, 15m)
✅ Key Trading Takeaways:
Liquidity Trap: Retail was trapped inside a clean channel.
Fakeout Move: Induced shorts were wiped out.
CHoCH & BOS: Clear reversal pattern with momentum.
Perfect Retest Entry: Price retested demand and launched.
Current Area = Supply/Distribution: Great place to look for shorts or take profits.
📌 Possible Trading Plans:
🔸 Plan A: Reversal Short (Countertrend)
Entry: Inside 1.1930–1.1970 zone
Confirmation: Bearish PA + LTF CHoCH
TP1: Previous BOS (~1.1830)
TP2: Demand zone retest (~1.1650)
SL: Above 1.1980–1.2000
🔸 Plan B: Continuation Long (Breakout Bias)
Entry: Break + Retest above 1.2000 psychological level
SL: Below breakout wick
TP1: 1.2100
TP2: 1.2200+
🔖 Concepts Applied:
Smart Money Concepts (CHoCH, BOS, liquidity sweep)
Price Action Structure
Trendline break and retest
Supply & Demand Zones
Support/Resistance Flip (SR Interchange)
Volume + Momentum Confirmation
🔄 Conclusion:
This chart demonstrates a classic Smart Money narrative:
“Trap the retail, shift the structure, drive price into premium, then reverse.”
We're now at a make-or-break supply zone. Watch price behavior carefully — this is where smart traders either secure profits or prepare for the next leg.
Overlaying AI forecast directly onto chart. Judge for yourself On the 27th of June I put through a prediction into my AI forecasting machine and this is what it said (image on screen)
I am SO impressed with the forecast so far, so I've overlayed the image onto the price action and will check in on it daily
This will give You the dominant trend direction for Bitcoin, and perhaps some extra capital in your accounts #you'reWelcome

EURJPY SHORT – DAILY FORECAST Q3 | W29 | D14 | Y25 GAP SHORT!!!!💼 EURJPY SHORT – DAILY FORECAST
Q3 | W29 | D14 | Y25
📊 MARKET STRUCTURE SNAPSHOT
EURJPY is currently reacting from a key higher time frame supply zone, with price action showing weakness at premium levels. Structure and momentum are now aligning for a short opportunity backed by multi-timeframe confluence.
🔍 Confluences to Watch 📝
✅ Daily Order Block (OB)
Strong reaction and early signs of distribution.
Previous bullish momentum is losing steam; structure is flattening with rejection wicks forming.
✅ 4H Order Block
Break of internal structure (iBoS) confirms a short-term bearish transition.
✅ 1H Order Block
1H structure shift bearish
📈 Risk Management Protocols
🔑 Core principles:
Max 1% risk per trade
Only execute at pre-identified levels
Use alerts, not emotion
Stick to your RR plan — minimum 1:2
🧠 You’re not paid for how many trades you take, you’re paid for how well you manage risk.
🧠 Weekly FRGNT Insight
"Trade what the market gives, not what your ego wants."
Stay mechanical. Stay focused. Let the probabilities work.
🏁 Final Thoughts from FRGNT
📌 The structure is clear.
The confluences are stacked.
Let execution follow discipline, not emotion.

USDCAD LONG DAILY FORECAST Q3 D14 W29 Y25USDCAD LONG DAILY FORECAST Q3 D14 W29 Y25
Professional Risk Managers👋
Welcome back to another FRGNT chart update📈
Diving into some Forex setups using predominantly higher time frame order blocks alongside confirmation breaks of structure.
Let’s see what price action is telling us today! 👀
💡Here are some trade confluences📝
✅Daily Order block identified
✅4H Order Block identified
✅1H Order Block identified
📈 Risk Management Principles
🔑 Core Execution Rules
Max 1% risk per trade — protect your capital, preserve your edge
Set alerts — let price come to your levels, not the other way around
Minimum 1:2 RR — if the reward doesn’t justify the risk, it’s not worth it
Focus on process, not outcomes — the outcome is random, your process is not
🧠 Remember: The edge lies in execution, not prediction. Your strategy is only as good as your discipline to follow it.
🧠 FRGNT Insight of the Day
"The market rewards structure and patience — not emotion or urgency."
Execute like a robot. Manage risk like a pro. Let the chart do the talking.
🏁 Final Words from FRGNT
📌 USDCAD is offering textbook alignment — structure, order flow, and confirmation are all in place.
📌 The opportunity is there — now it’s about how you show up to execute.
🎯 Trade with clarity. Act with conviction. Manage with precision.
🔑 Remember, to participate in trading comes always with a degree of risk, therefore as professional risk managers it remains vital that we stick to our risk management plan as well as our trading strategies.
📈The rest, we leave to the balance of probabilities.
💡Fail to plan. Plan to fail.
🏆It has always been that simple.
❤️Good luck with your trading journey, I shall see you at the very top.
🎯Trade consistent, FRGNT X

GBPUSD LONG FORECAST Q3 D14 W29 Y25GBPUSD LONG FORECAST Q3 D14 W29 Y25
Welcome back to the watchlist GBPUSD ! Let's go long ! Alignment across all time frames.
Professional Risk Managers👋
Welcome back to another FRGNT chart update📈
Diving into some Forex setups using predominantly higher time frame order blocks alongside confirmation breaks of structure.
Let’s see what price action is telling us today!
💡Here are some trade confluences📝
✅Daily order block
✅1H Order block
✅Intraday breaks of structure
✅4H Order block
📈 Risk Management Principles
🔑 Core Execution Rules
Max 1% risk per trade
Set alerts — let price come to your levels
Minimum 1:2 RR
Focus on process, not outcomes
🧠 Remember, the strategy works — you just need to let it play out.
🧠 FRGNT Insight of the Day
"The market rewards structure and patience — not emotion or urgency."
Execute like a robot. Manage risk like a pro. Let the chart do the talking.
🏁 Final Words from FRGNT
📌 GBPUSD is offering textbook alignment — structure, order flow, and confirmation all check out.
Let’s approach the trade with clarity, conviction, and risk-managed execution.
🔑 Remember, to participate in trading comes always with a degree of risk, therefore as professional risk managers it remains vital that we stick to our risk management plan as well as our trading strategies.
📈The rest, we leave to the balance of probabilities.
💡Fail to plan. Plan to fail.
🏆It has always been that simple.
❤️Good luck with your trading journey, I shall see you at the very top.
🎯Trade consistent, FRGNT X
