Gann
USDJPY LONG & SHORT – WEEKLY FORECAST Q3 | W29 | Y25
💼 USDJPY LONG & SHORT – WEEKLY FORECAST
Q3 | W29 | Y25
📊 MARKET STRUCTURE SNAPSHOT
USDJPY is currently reaching for a key higher time frame supply zone, looking for price action to show weakness at premium levels. Structure and momentum are now aligning for a short opportunity backed by multi-timeframe confluence.
🔍 Confluences to Watch 📝
✅ Daily Order Block (OB)
Looking for Strong reaction and early signs of distribution.
✅ 4H Order Block
Break of internal structure (iBoS) confirms a short-term bearish transition.
✅ 1H Order Block
📈 Risk Management Protocols
🔑 Core principles:
Max 1% risk per trade
Only execute at pre-identified levels
Use alerts, not emotion
Stick to your RR plan — minimum 1:2
🧠 You’re not paid for how many trades you take, you’re paid for how well you manage risk.
🧠 Weekly FRGNT Insight
"Trade what the market gives, not what your ego wants."
Stay mechanical. Stay focused. Let the probabilities work.
🏁 Final Thoughts from FRGNT
📌 The structure is clear.
The confluences are stacked.
Let execution follow discipline, not emotion.

ETHUSD: Bulls Are Winning! Long!
My dear friends,
Today we will analyse ETHUSD together☺️
The price is near a wide key level
and the pair is approaching a significant decision level of 2,980.5 Therefore, a strong bullish reaction here could determine the next move up.We will watch for a confirmation candle, and then target the next key level of 3,001.1.Recommend Stop-loss is beyond the current level.
❤️Sending you lots of Love and Hugs❤️

BTCUSD: Next Move Is Down! Short!
My dear friends,
Today we will analyse BTCUSD together☺️
The recent price action suggests a shift in mid-term momentum. A break below the current local range around 118.878 will confirm the new direction downwards with the target being the next key level of 118.470.and a reconvened placement of a stop-loss beyond the range.
❤️Sending you lots of Love and Hugs❤️

AUDUSD SHORT & LONG – WEEKLY FORECAST Q3 | W 29 | Y25💼 AUDUSD SHORT & LONG – WEEKLY FORECAST
Q3 | W 29 | Y25
📊 MARKET STRUCTURE OVERVIEW
AUDUSD is currently trading around a previously mitigated Daily and 4H Order Block zone.
Price has shown signs of short-term bearish momentum on lower timeframes (1H & 15m), but the broader structure still allows for bullish re-entries from deeper discounted levels.
We’re entering a key decision zone with potential for both short and long opportunities, depending on intraday confirmation.
🔍 Confluences to Watch 📝
✅ Daily OB – Previously Mitigated
Larger structure still holds room for bullish continuation if key internal supports hold.
✅ 4H OB – Mitigated with Initial Rejection
✅ 1H & 15m OBs – Valid for Intraday Shorts
Clean bearish structure on intraday timeframes.
Potential shorts available
📈 Risk Management Protocols
🔑 Core Principles
Risk per trade: Max 1%
Only act at planned levels — never chase
RR minimum: 1:2
Use scaling techniques on intraday shorts, and hold conviction for swings when structure confirms
🧠 Your risk plan is your protection. Without it, your strategy is meaningless.
🧠 Weekly FRGNT Insight
“Bias is flexible. Discipline is not.”
Adapt to what price gives — but never abandon your risk framework.
🏁 Final Thoughts from FRGNT
📌 Both short and long opportunities are valid this week.
📌 Choose your bias based on structure + confirmation.
📌 Let the order flow lead and risk management guide.
❤️ Stay sharp, stay structured. I’ll see you at the very top.
🎯 Trade consistent. FRGNT X

$BTC Ready to Explode – Targeting $125K+ Soon! Bitcoin has finaCRYPTOCAP:BTC Ready to Explode – Targeting $125K+ Soon!
Bitcoin has finally broken out of the previous resistance range (~$110K–$111K), where it was rejected multiple times in June. Now it's consolidating in a tight box, setting up for a big move.
🔸 Support $110k–$113k
This area was previous resistance and is now acting as strong support. Holding above this confirms bullish strength.
🔸 Upside Target: $125k
If BTC holds within the current range and breaks above, the next leg could push price toward $125K. A clean breakout could even extend toward $140K.
🔸 Short-Term Take Profits:
✅ TP1: $120,000
✅ TP2: $122,000
✅ TP3: $125,000
🔸 Risk Level at $110,000:
Break below this level would invalidate the bullish setup and increase downside risk.
0X0 LONG Position but a Possible pullback before the major Run!!On my last post on 0X0USDT, price broke a minor structure leaving liquidity behind yet to be taken before expected market pump, price is currently making a correction to demand zone for a continuation to the upside. I am still BULLISH on 0X0 but we just have to see what it does in coming weeks.

#PORTAL/USDT#PORTAL
The price is moving within a descending channel on the 1-hour frame, adhering well to it, and is heading for a strong breakout and retest.
We have a bounce from the lower boundary of the descending channel. This support is at 0.0494.
We have a downtrend on the RSI indicator that is about to be broken and retested, supporting the upside.
There is a major support area in green at 0.0461, which represents a strong basis for the upside.
Don't forget a simple thing: ease and capital.
When you reach the first target, save some money and then change your stop-loss order to an entry order.
For inquiries, please leave a comment.
We have a trend to hold above the 100 Moving Average.
Entry price: 0.0584
First target: 0.0648
Second target: 0.0727
Third target: 0.0840
Don't forget a simple thing: ease and capital.
When you reach the first target, save some money and then change your stop-loss order to an entry order.
For inquiries, please leave a comment.
Thank you.

valu suport level and time lines this is a possible support level and time line of the new stock VALU using W.D Gann method
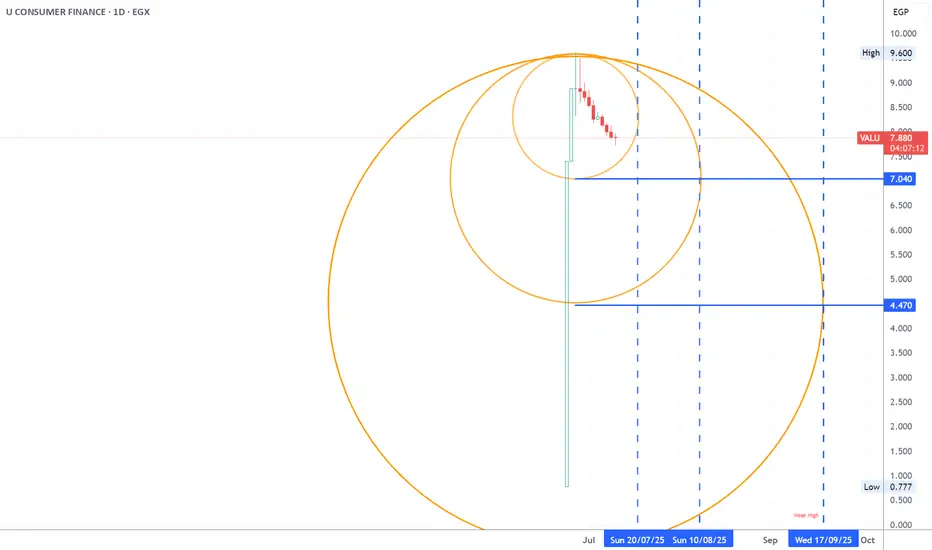
continue example 1 how to identify direction of the marketeurussd replicated on w d 4 Today 1220254
join the bullies

direction example 1 finding directionbullish mostly
market reading saturday 12 25
2 ways to identify which direction its going

BTC Forecast: CPI Trap or Liquidity Sweep?Powered by Advanced Time-Price Analysis | Dr.Gemy | Digital Gann Strategy
Using Time Cycles, IPDA logic, and Digital Gann structure, the upcoming week for Bitcoin is setting up for a high-probability liquidity event, especially with high-impact macro data scheduled.
📍In the next 18 hours, we expect a short-term correction toward the 115,911 USD zone.
---
⏰ CPI (Tuesday) & PPI (Wednesday) = catalysts for smart money traps.
I expect a textbook liquidity hunt around the inflation data window.
Time is more important than price.
🔮 Two Critical Scenarios Unfolding:
✅ Scenario 1 – CPI Trap Setup (Tuesday News Play)
🕒 If BTC continues correcting into Tuesday (July 15), targeting 113,724 USD, this will align perfectly with the release of U.S. CPI (Inflation) data at 3:30 PM GMT+3.
📈 A fake bullish breakout above 118,098 USD could follow, luring retail traders with an inflation-driven spike, only to be reversed sharply to collect liquidity around 111,537 USD.
🧠 CPI y/y forecast is 2.6% vs 2.4% prior – higher inflation could spark temporary bullish reaction, but the underlying setup suggests it's a trap.
---
🎭 Scenario 2 – Smart Money Pump and Dump
📈 BTC might front-run expectations with an early week rally to retest 118,098 USD, only to reverse midweek (around Wednesday's PPI release) as the market reacts to deeper macro data and shifting dollar strength.
💣 Downside continuation could sweep below 113,724 USD, ultimately reaching the key demand base at 111,537 USD, which marks the beginning of the last major impulsive move.
---
🧠 Strategic Concepts Used:
Time Fractals (9H Cycle Lines)
Gann Reversal Timing & Breaker Blocks (H4)
Smart Money Traps around News
IPDA Voids & Liquidity Pools
CPI/PPI/Macro Liquidity Zones
#CryptoForecast #BTCUSD #CPIWeek #GannTiming #SmartMoney #LiquiditySweep #IPDA #ForexStyleCrypto #DigitalGann #DrGemy

#WLD/USDT#WLD
The price is moving within a descending channel on the 1-hour frame, adhering well to it, and is heading for a strong breakout and retest.
We are experiencing a rebound from the lower boundary of the descending channel, which is support at 1.08.
We are experiencing a downtrend on the RSI indicator, which is about to break and retest, supporting the upward trend.
We are looking for stability above the 100 moving average.
Entry price: 1.143
First target: 1.190
Second target: 1.236
Third target: 1.300

EURGBP SHORT – WEEKLY FORECAST Q3 | W29 | Y25💼 EURGBP SHORT – WEEKLY FORECAST
Q3 | W29 | Y25
📊 MARKET STRUCTURE SNAPSHOT
EURGBP is currently reacting from a key higher time frame supply zone, with price action showing weakness at premium levels. Momentum has slowed, and early signs of distribution are appearing. With structure aligning bearishly across multiple timeframes, the pair presents a short bias opportunity.
🔍 Confluences to Watch 📝
✅ Daily Order Block (OB)
Price reacted from a high-probability bearish OB.
Rejection wicks and a shift in candle body control point to supply dominance.
Momentum is fading, confirming the presence of smart money sellers.
✅ 4H Order Block
Clear mitigation of 4H OB followed by an internal break of structure (iBoS).
Price is respecting the OB zone, printing lower highs beneath key supply.
Perfect mid-timeframe confirmation of trend transition.
✅ 1H Order Block
1H structure shifted bearish, validating LTF trend alignment.
Price building supply chain with continued lower highs and bearish engulfing patterns.
Ideal zone for entry on pullback or liquidity sweep.
📈 Risk Management Protocols
🔑 Core Principles:
💰 Max 1% risk per trade
📍 Only execute at pre-identified zones
⏰ Set alerts — avoid impulsive trades
📉 Respect RR — minimum 1:2 per position
🧠 You're not paid for frequency. You're paid for discipline and execution quality.
🧠 Weekly FRGNT Insight
“Trade what the market gives, not what your ego wants.”
Stay mechanical, stay focused, and allow the probabilities to play out. Your job is to control risk — not the outcome.
🏁 Final Thoughts from FRGNT
📌 The structure is clear.
📌 The confluences are stacked.
📌 The bias is confirmed.
Let your execution reflect your discipline, not your emotions.
❤️ Good luck this week, and as always – I’ll see you at the very top.

USOIL: Local Bearish Bias! Short!
My dear friends,
Today we will analyse USOIL together☺️
The market is at an inflection zone and price has now reached an area around 68.669 where previous reversals or breakouts have occurred.And a price reaction that we are seeing on multiple timeframes here could signal the next move down so we can enter on confirmation, and target the next key level of 67.925..Stop-loss is recommended beyond the inflection zone.
❤️Sending you lots of Love and Hugs❤️

EURJPY SHORT – WEEKLY FORECAST Q3 | W29 | Y25💼 EURJPY SHORT – WEEKLY FORECAST
Q3 | W29 | Y25
📊 MARKET STRUCTURE SNAPSHOT
EURJPY is currently reacting from a key higher time frame supply zone, with price action showing weakness at premium levels. Structure and momentum are now aligning for a short opportunity backed by multi-timeframe confluence.
🔍 Confluences to Watch 📝
✅ Daily Order Block (OB)
Strong reaction and early signs of distribution.
Previous bullish momentum is losing steam; structure is flattening with rejection wicks forming.
✅ 4H Order Block
Break of internal structure (iBoS) confirms a short-term bearish transition.
✅ 1H Order Block
1H structure shift bearish
📈 Risk Management Protocols
🔑 Core principles:
Max 1% risk per trade
Only execute at pre-identified levels
Use alerts, not emotion
Stick to your RR plan — minimum 1:2
🧠 You’re not paid for how many trades you take, you’re paid for how well you manage risk.
🧠 Weekly FRGNT Insight
"Trade what the market gives, not what your ego wants."
Stay mechanical. Stay focused. Let the probabilities work.
🏁 Final Thoughts from FRGNT
📌 The structure is clear.
The confluences are stacked.
Let execution follow discipline, not emotion.

NG1!: Strong Growth Ahead! Long!
My dear friends,
Today we will analyse NG1! together☺️
The price is near a wide key level
and the pair is approaching a significant decision level of 3.377 Therefore, a strong bullish reaction here could determine the next move up.We will watch for a confirmation candle, and then target the next key level of 3.408.Recommend Stop-loss is beyond the current level.
❤️Sending you lots of Love and Hugs❤️

NI225: Will Go Up! Long!
My dear friends,
Today we will analyse NI225 together☺️
The recent price action suggests a shift in mid-term momentum. A break above the current local range around 39,581.12 will confirm the new direction upwards with the target being the next key level of 39,719.48 and a reconvened placement of a stop-loss beyond the range.
❤️Sending you lots of Love and Hugs❤️

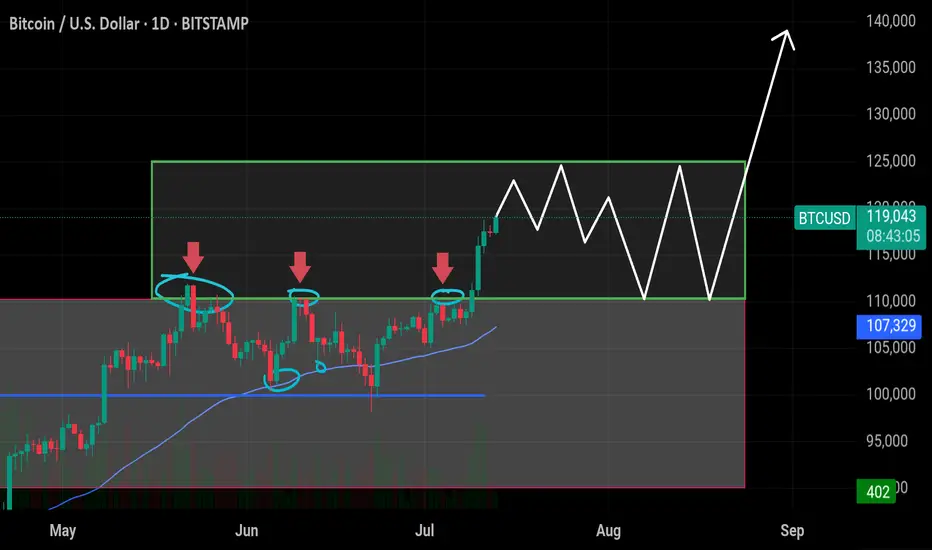
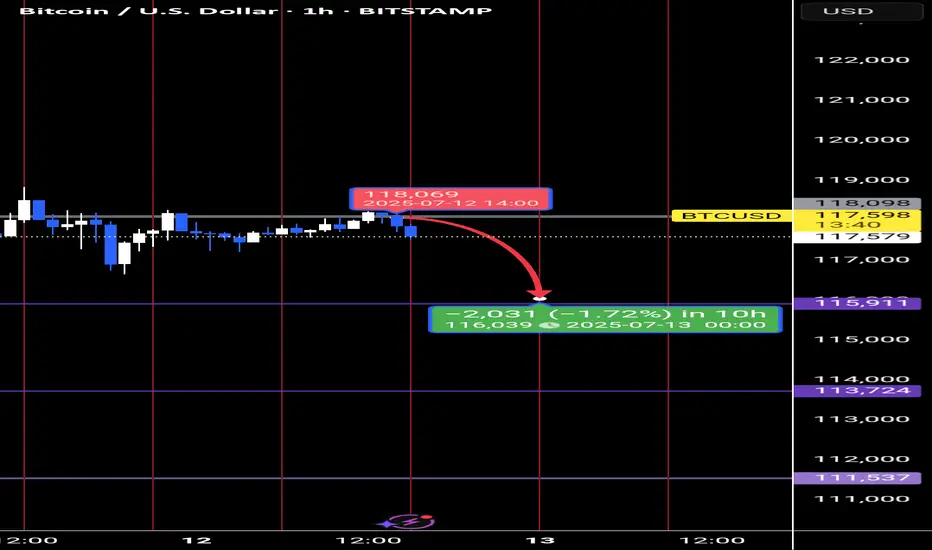
bitcoin will go down for the next 8hrs After sweep the liquidity above 118098. the price goes down for the correction . I expect it will reach the one hr order block at 115911.
Entry : 118098- 117500
St : 118200
tp: 116000
XLMUSDT.P – Fibonacci Buy Zone & Fair Value Gap Alignment (KT FuKT Digital Asset Hedge Fund Strategy Setup – 15m Chart
This idea shows a potential long opportunity using the KT Fund’s intraday Fibonacci trend entry system, which aligns confluence zones with strict SL/TP rules:

bitcoin down for 8 hrAfter sweep the liquidity above 118098. the price will correct may be to 115911 or more ...
for the next 8 hrs I expect it will reach the 1 hr order block at 115911.
entry : 118098- 117000
tk: 115911 or end of time cycle of 8hr
St: 118198

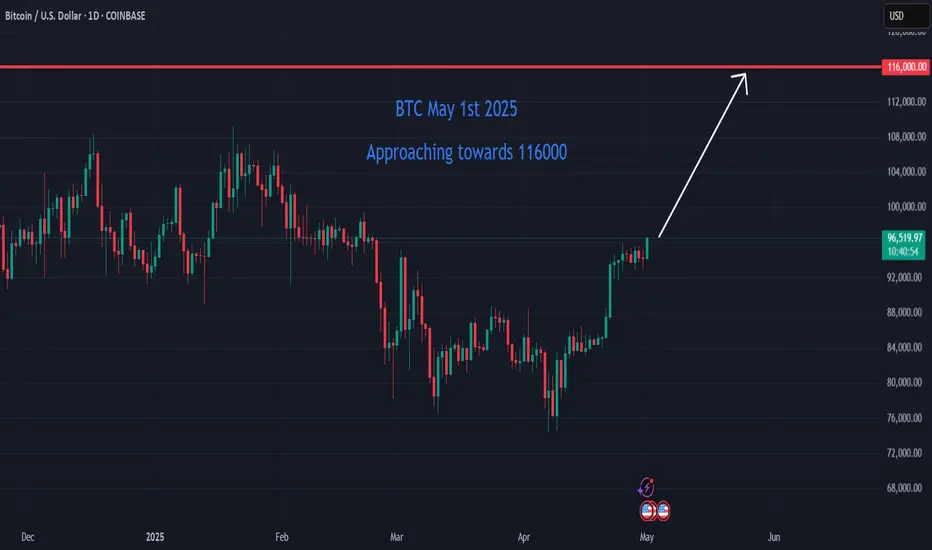
Bitcoin on the Brink: Short-Term Surge Toward $116K Bitcoin (BTC) is currently trading at approximately $96,390, approaching the $116,000 mark. Here's a short-term analysis using Cycle Analysis, Elliott Wave Theory, and Gann Analysis to inform potential trading strategies.
________________________________________
📈 Cycle Analysis: Mid-2025 Surge
Historical patterns suggest that Bitcoin tends to reach its peak between 518 and 546 days after a halving event. Given the most recent halving in April 2024, analysts anticipate a potential price peak around mid-2025, approximately 1.5 years post-halving. Notably, Bitcoin is currently about 35 days ahead of its typical cycle, indicating a possible acceleration in price growth.
________________________________________
📊 Elliott Wave Analysis: Wave 3 in Progress
Elliott Wave Theory suggests that Bitcoin is currently in the third wave of its bullish cycle, which is typically the most powerful and extended wave. Recent analyses indicate that the third wave is unfolding, with potential targets ranging from $114,500 to $120,500. A conservative estimate places the peak of this wave between $127,000 and $150,000
________________________________________
📐 Gann Analysis: Price-Time Equilibrium
Gann Analysis utilizes geometric angles to predict price movements. The "2×1 Fan" line, representing a 45-degree angle, is considered a fair value line. Historically, Bitcoin's price has peaked near this line during parabolic run-ups. Currently, Bitcoin's price is approaching this level, suggesting a potential peak.
________________________________________
🧭 Short-Term Trade Setup
✅ Entry Points:
• Accumulation Zone: $85,000 to $90,000
• Current Price: $96,390
🎯 Target Levels:
• Short-Term Peak: $116,000 to $135,000
• Medium-Term Peak: $150,000
⚠️ Risk Management:
• Potential Correction: After reaching the peak, anticipate a significant pullback, possibly 30–50%.
• Exit Strategy: Consider taking profits as Bitcoin approaches upper resistance zones.
________________________________________
🧾 Conclusion
Bitcoin is in the final stages of its current bullish cycle, with projections indicating a potential peak between $150,000 and $278,000. However, caution is warranted as market corrections are typical following such surges. Investors should consider taking profits as Bitcoin approaches upper resistance levels and prepare for potential pullbacks.