EURJPY SHORT DAILY FORECAST Q3 D11 W28 Y25EURJPY SHORT DAILY FORECAST Q3 D11 W28 Y25
It’s Fun Coupon Friday! 💸🔥
Professional Risk Managers👋
Welcome back to another FRGNT chart update📈
Diving into some Forex setups using predominantly higher time frame order blocks alongside confirmation breaks of structure.
Let’s see what price action is telling us today! 👀
💡Here are some trade confluences📝
✅Daily Order block identified
✅4H Order Block identified
✅1H Order Block identified
🔑 Remember, to participate in trading comes always with a degree of risk, therefore as professional risk managers it remains vital that we stick to our risk management plan as well as our trading strategies.
📈The rest, we leave to the balance of probabilities.
💡Fail to plan. Plan to fail.
🏆It has always been that simple.
❤️Good luck with your trading journey, I shall see you at the very top.
🎯Trade consistent, FRGNT X
Gann

AUDUSD SHORT & LONG FORECAST Q3 D11 W28 Y25AUDUSD SHORT & LONG FORECAST Q3 D11 W28 Y25
It’s Fun Coupon Friday! 💸🔥
Professional Risk Managers👋
Welcome back to another FRGNT chart update📈
Diving into some Forex setups using predominantly higher time frame order blocks alongside confirmation breaks of structure.
Let’s see what price action is telling us today! 👀
💡Here are some trade confluences📝
✅Daily Order block identified
✅4H Order Block identified
✅1H Order Block identified
🔑 Remember, to participate in trading comes always with a degree of risk, therefore as professional risk managers it remains vital that we stick to our risk management plan as well as our trading strategies.
📈The rest, we leave to the balance of probabilities.
💡Fail to plan. Plan to fail.
🏆It has always been that simple.
❤️Good luck with your trading journey, I shall see you at the very top.
🎯Trade consistent, FRGNT X

Buy Trade Strategy for MOODENG: Tapping Into Web3 Identity Growt
This trading idea focuses on MOODENG, an emerging cryptocurrency project aiming to revolutionize digital identity and user engagement within the Web3 ecosystem. MOODENG stands out for its mission to decentralize online identity management, offering individuals more control over their data and privacy while interacting across various decentralized applications (dApps). With increasing attention on user sovereignty, data protection, and digital reputation, MOODENG is well-positioned to capture value in a growing segment of the blockchain industry that intersects with both DeFi and social Web3 infrastructure.
As governments and users alike call for more transparency and decentralization, the fundamental vision behind MOODENG aligns with long-term trends favoring open, secure, and self-managed identity systems. Still, due to the early-stage nature of the project and the volatile landscape of the crypto sector, investments in MOODENG should be made with clear awareness of potential risks and rewards.
Disclaimer:
This trading idea is provided for educational purposes only and should not be considered financial advice. Cryptocurrency markets are highly volatile and speculative. Investing in MOODENG, like any digital asset, involves the risk of partial or total capital loss. Always conduct your own research, understand your financial situation, and consult with a financial advisor before making investment decisions. Past performance is not a guarantee of future results.

USDCAD LONG DAILY FORECAST Q3 D11 W28 Y25USDCAD LONG DAILY FORECAST Q3 D11 W28 Y25
It’s Fun Coupon Friday! 💸🔥
Professional Risk Managers👋
Welcome back to another FRGNT chart update📈
Diving into some Forex setups using predominantly higher time frame order blocks alongside confirmation breaks of structure.
Let’s see what price action is telling us today! 👀
💡Here are some trade confluences📝
✅Daily Order block identified
✅4H Order Block identified
✅1H Order Block identified
🔑 Remember, to participate in trading comes always with a degree of risk, therefore as professional risk managers it remains vital that we stick to our risk management plan as well as our trading strategies.
📈The rest, we leave to the balance of probabilities.
💡Fail to plan. Plan to fail.
🏆It has always been that simple.
❤️Good luck with your trading journey, I shall see you at the very top.
🎯Trade consistent, FRGNT X

Buy Trade Strategy for JASMY: Betting on Data Privacy in IoTDescription:
This trading idea highlights JASMY, a cryptocurrency that combines blockchain technology with the Internet of Things (IoT) to give users full control over their personal data. As concerns around digital privacy continue to grow, JASMY positions itself as a key player by offering decentralized data storage solutions where users can securely manage and monetize their information. The project is backed by a team of former Sony executives, adding credibility and experience to its development roadmap. With Japan’s increasing support for Web3 innovation and IoT adoption, JASMY has strong long-term potential for growth.
Still, like all cryptocurrencies, JASMY is subject to high volatility and speculative interest. Market trends, global regulations, and investor sentiment can drastically influence its price. For this reason, investors should remain cautious and ensure proper risk management when trading.
Disclaimer:
This trading idea is for educational purposes only and does not constitute financial advice. Trading cryptocurrencies like JASMY involves substantial risk, including the possible loss of your entire capital. Always do your own research, evaluate your financial position, and consider speaking with a licensed advisor before making any investment decisions. Past performance does not guarantee future results.

Bitcoin Breaks Out — Major Momentum ShiftBTC/USDT has officially broken out of the descending channel it was consolidating in for over a month. The breakout was strong, clearing the horizontal resistance at $111,862, flipping it into support.
Chart Structure:
Descending channel broken to the upside
Horizontal resistance is flipped to support
Volume confirmed breakout momentum
Key Levels:
Support: $111,862 → Newly flipped support
Resistance Zones Ahead:
$116,818
$122,342
Upside Targets:
Immediate: $116,818
Extended: $122,342
Caution: Avoid FOMO. Wait for a retest near $111,800–$112,200 to confirm breakout strength.
Bias: Bullish
Timeframe: 4H
Wait for confirmation before fresh entries.
DYOR | Not financial advice
#BTC #Bitcoin

Buy Trade Strategy for SEI: Backing High-Performance Layer 1 Description:
This trading idea highlights SEI, a purpose-built Layer 1 blockchain optimized for trading and decentralized finance applications. SEI stands out in the crowded blockchain space thanks to its high throughput, low latency, and parallelized transaction processing, which are essential for the next generation of DeFi and on-chain trading platforms. With growing developer interest, ecosystem expansion, and strategic integrations, SEI is positioning itself as a foundational layer for scalable financial applications.
Its focus on performance and specialization makes SEI a strong contender for long-term growth, especially as institutional and retail demand for faster, more efficient blockchain infrastructure continues to rise. However, like all cryptocurrencies, SEI’s price and adoption remain influenced by market dynamics, regulatory factors, and competition in the Layer 1 sector.
Disclaimer:
This trading idea is for educational purposes only and does not represent financial advice. Cryptocurrency investments, including SEI, are highly speculative and come with substantial risk, including the potential for a complete loss of capital. Always conduct your own research, evaluate your risk tolerance, and consult with a financial advisor before making any investment decisions. Past performance is not indicative of future results.

Buy Trade Strategy for FET: Backing the Future of AI & BlockchaiDescription:
This trading idea highlights FET (Fetch.ai), a cryptocurrency powering a decentralized network that merges artificial intelligence and blockchain to create autonomous economic agents. These agents are designed to optimize services such as transportation, supply chain, and smart city infrastructure. FET is at the forefront of this innovative fusion, aiming to decentralize machine learning while reducing inefficiencies in data-driven industries. Backed by strong development momentum, strategic partnerships, and increasing relevance of AI technology, FET presents a compelling long-term use case in a rapidly evolving digital economy.
Still, it's important to understand that the crypto market remains highly volatile. News related to regulation, tech adoption, and market sentiment can rapidly shift valuations. Projects like FET, though fundamentally strong, are not immune to speculative pressure and risk.
Disclaimer:
This trading idea is for educational purposes only and should not be considered financial advice. Investing in cryptocurrencies like FET involves a high level of risk, including the potential for total capital loss. Always conduct your own due diligence, assess your financial condition, and consult a licensed financial advisor before making any investment decisions. Past performance is not indicative of future results.

SHIB NEXT TARGET#SHIB
Shiba Inu is forming a descending channel pattern on the daily timeframe🔍
The price is consolidating above the midline support and is currently testing the MA 50💁♂️
Breaking above this MA could drive the price toward targets at $0.00001500, $0.00001750, $0.00002050, and $0.00002500🎯

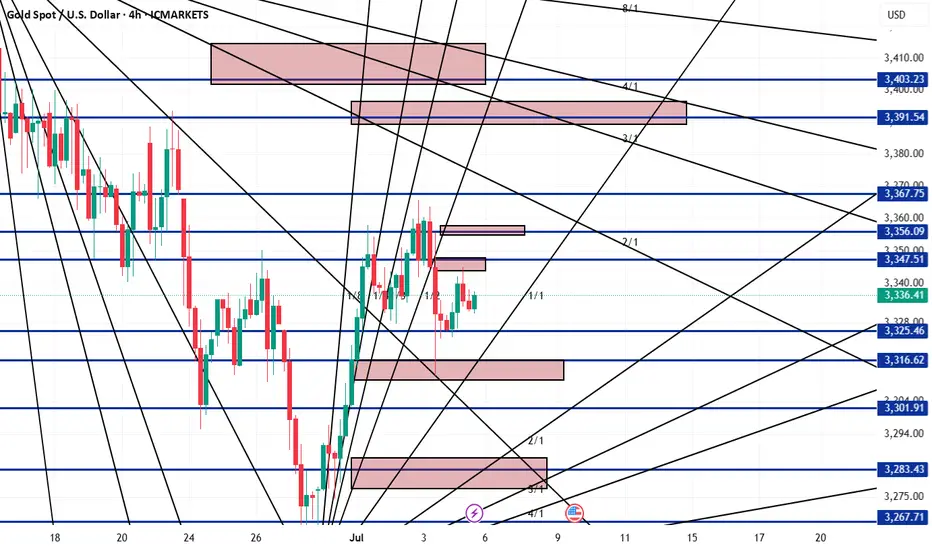
GOLD Analysis 7/7/2025Based on gold analysis using digital analysis , Gold Analysis on 4H frame
Selling Zones :
3389 - 3397
3401 - 3415
buying zones
3286 - 3277
3234 - 3222
Buy Trade Strategy for CFG: Unlocking Real-World Asset FinanceDescription:
This trading idea is based on CFG (Centrifuge), a cryptocurrency that powers a protocol bridging real-world assets (RWAs) with decentralized finance (DeFi). CFG enables businesses to tokenize tangible assets—such as invoices, real estate, or royalties—and use them as collateral to access liquidity directly on-chain. This innovation offers a unique solution for integrating traditional finance with blockchain technology, opening up new opportunities for both institutional and retail investors. With growing interest in RWAs across the crypto space, Centrifuge’s real-world applications and partnerships with major DeFi players enhance its long-term value proposition.
Despite its strong fundamentals, the crypto market is inherently volatile and subject to factors such as regulation, technological developments, and shifts in investor sentiment. As such, investing in CFG should be approached with careful risk management.
Disclaimer:
This trading idea is for educational purposes only and does not constitute financial advice. Investing in cryptocurrencies like CFG involves substantial risks, including the possibility of a total loss of capital. Always do your own research, assess your financial situation, and consult with a qualified advisor before making any investment decisions. Past performance is not indicative of future results.

XAU/USD 1H Outlook
FVG Fill (3320–3318)
Price is expected to drop into the unfilled Fair Value Gap between 3320 and 3318.
London/NY Liquidity Hunt
After filling the FVG, look for a swift bullish impulse during the London and New York sessions to trigger stop-runs and collect liquidity.
Downward Correction to 3305 & 3298
Once the liquidity grab completes, expect a retracement:
First target: 3305
On a break below 3305, next target is the unfilled FVG at 3298
Summary:
Drop → FVG fill (3320–3318) → Bullish liquidity hunt (London/NY) → Retracement toward 3305 (then 3298)

SELL BTCUSD NOW🚨 TRADE ALERT:
SELL BTCUSD NOW 💥📉
🔻 Market showing bearish signs.
🎯 Set your TP (Take Profit) levels wisely.
🛡️ Use SL (Stop Loss) to manage risk.
📊 Confirm with your strategy before entry.

S&P 500 (SPX) – Gann & Market Timing Outlook!We're currently leaning towards a bullish melt-up scenario into August 2025, supported by both price structure and Gann time analysis.
🔹 Key Gann Time Clusters:
11th July 2025
14th July 2025
These dates may act as pivotal turning points. The ideal scenario for bulls would be a short-term pullback into the 15th–16th July window, which could then confirm the next major leg up.
📈 Price action is riding strongly above the 1/1 and 2/1 Gann angles – a clear sign of accumulation and strength. The setup aligns well with a continued rally targeting August 2025 as a significant cycle top before any serious correction unfolds.
🎯 Watch the coming days closely. If we get a healthy dip, it may be your best buy-the-dip opportunity ahead of a major move.

SOX INDEX MAJOR TOP by 7/11/7/14 Spiral Turn The chart posted is that of the SOX index NOT SMH The spirals are focused on this friday and monday Today I moved to puts in SMH I am waiting on friday to short SOXBut I have moved into puts in SMH as we hit target 288/290 Best of trades WAVETIMER

Gold terminal fluctuation range: 3300-3330Gold terminal fluctuation range: 3300-3330
Analysis of main influencing factors
(1) Trade frictions escalate, and safe-haven demand heats up
The Trump administration announced that it will impose tariffs on eight countries (Brazil 50%, Libya/Iraq/Algeria/Sri Lanka 30%, Brunei/Moldova 25%, Philippines 20%), which will take effect on August 1.
The EU is accelerating negotiations with the US to avoid raising auto tariffs on August 1 (EU automakers are currently facing 25% tariff pressure).
(2) Fed policy divergence, interest rate cut expectations fluctuate
The minutes of the June Fed meeting showed that most officials supported a rate cut this year, but ruled out the possibility of action in July. Some officials were concerned about inflationary pressure caused by tariffs.
The market expects the central bank to cut interest rates for the first time in September, with a cumulative rate cut of 50 basis points by the end of the year, but stronger-than-expected employment data curbed expectations of aggressive easing.
Technical analysis:
Key support levels: $3280-3282 (this week's low), $3250 (trend line support).
Key resistance levels: $3315-3330, $3345-3360.
Short-term trend:
If it breaks through $3345, it may challenge $3400;
If it falls below $3280, it may fall to $3250.
Pay attention to today's US initial jobless claims data and speeches by Fed officials.
Pay attention to the long-short battle of $3320 and the breakthrough of $3345.
Short-selling strategy: (as long as the gold price is below $3330, you can short at a high level)
Sell: 3325-3330
Stop loss: 3340
Target: 3315-3300-3280
Long-term strategy:
As long as the gold price is above $3300, going long at a low price is an acceptable and stable profit strategy.
Stop loss: 3295
GBPUSD I Daily CLS I KL - FVG I Model 1Yo Market Warriors ⚔️
Fresh outlook drop — if you’ve been riding with me, you already know:
🎯My system is 100% mechanical. No emotions. No trend lines. No subjective guessing. Just precision, structure, and sniper entries.
🧠 What’s CLS?
It’s the real smart money. The invisible hand behind $7T/day — banks, algos, central players.
📍Model 1:
HTF bias based on the daily and weekly candles closes,
Wait for CLS candle to be created and manipulated. Switch to correct LTF and spot CIOD. Enter and target 50% of the CLS candle.
For high probability include Dealing Ranges, Weekly Profiles and CLS Timing.
Trading is like a sport. If you consistently practice you can learn it.
“Adapt what is useful. Reject whats useless and add whats is specifically yours.”
David Perk aka Dave FX Hunter
💬 Don't hesitate to ask any questions or share your opinions

Gold: Market analysis and strategy for July 10.Gold technical analysis
Daily chart resistance level 3345, support level 3245
Four-hour chart resistance level 3340, support level 3285
One-hour chart resistance level 3330, support level 3310.
Yesterday, gold bottomed out and rebounded, standing above 3310, breaking the previous downward rhythm. The breakthrough of the previous opening means that gold is likely to continue to rise. The current market is bullish above 3310. You can buy around 3310. The upper resistance is 3340/45 area. The gold price runs in this area. If the top signal appears at a small level, you can sell.
In terms of intraday operations, it is recommended to sell in the 3340-45 range after rising, and buy when it falls back to 3310. It runs in a narrow range and can be scalped.
SELL: 3343 near
BUY: 3310near

Bullish on BANKINDIA- Expected Cup and handle pattern
- Expected level 125, 150 level on or before 29 sep'25
- Invalidate this pattern if closed below 110 level.
- Chart have to respect TL.

US30: Move Up Expected! Long!
My dear friends,
Today we will analyse US30 together☺️
The in-trend continuation seems likely as the current long-term trend appears to be strong, and price is holding above a key level of 44,393.91 So a bullish continuation seems plausible, targeting the next high. We should enter on confirmation, and place a stop-loss beyond the recent swing level.
❤️Sending you lots of Love and Hugs❤️

GOLD: Local Bullish Bias! Long!
My dear friends,
Today we will analyse GOLD together☺️
The market is at an inflection zone and price has now reached an area around 3,324.79 where previous reversals or breakouts have occurred.And a price reaction that we are seeing on multiple timeframes here could signal the next move up so we can enter on confirmation, and target the next key level of 3,330.13.Stop-loss is recommended beyond the inflection zone.
❤️Sending you lots of Love and Hugs❤️

EURUSD: Absolute Price Collapse Ahead! Short!
My dear friends,
Today we will analyse EURUSD together☺️
The price is near a wide key level
and the pair is approaching a significant decision level of 1.17309 Therefore, a strong bearish reaction here could determine the next move down.We will watch for a confirmation candle, and then target the next key level of 1.17241..Recommend Stop-loss is beyond the current level.
❤️Sending you lots of Love and Hugs❤️

July 7 Bitcoin Bybit chart analysisHello
This is Bitcoin Guide.
If you "follow"
You can receive real-time movement paths and comment notifications on major sections.
If my analysis was helpful,
Please click the booster button at the bottom.
Here is the Bitcoin 30-minute chart.
There is no separate Nasdaq indicator announcement today.
I think the Nasdaq lower gap section retracement will be the focus.
Recently, sideways movement or adjustments have been coming out before the trend,
So I proceeded safely in preparation for variables.
*When the blue finger moves
Bidirectional neutral
Short->long switching or 2nd section long waiting strategy
1. $109,380 short position entry section / cut-off price when orange resistance line is broken
2. $108,997.8 long position switching / cut-off price when purple support line is broken
3. $109,610.9 long position 1st target -> Top 2nd target -> Good 3rd target
It seems important whether the purple support line is broken from the current position. If the first section at the top touches 108,997.8 dollars and comes down,
it may become a vertical decline section.
If it comes down right away, it is a long-waiting strategy in the final second section,
and if it deviates from the bottom section today
(6+12 pattern)
because it is a full candle when the gap section is touched,
it may fall to 107,484 dollars indicated at the very bottom.
I have important work to do tomorrow,
so I will take a day off and come back on Wednesday.
Please use my analysis so far for reference and
I hope you operate safely with principle trading and stop loss prices.
Thank you.
