Big CorrectionThe S&P index.
The chart shows the potential end of the final rally from the 2009 low.
Currently, with this rally from the recent 4,800 low, we are still in a correction period that will end in late October (highs and lows are irrelevant), & We have a date coming up in August so let's see what happens there.
After this period, we will have a rally combined with uncertainty and unjustified speculative movements (bubble) that could take us to the final peak, which I expect in 2026.
This remains a possibility, but don't base your trades on it. However, caution is often good.
Gann

U.S. Pensions Enter Crypto Amid Quantum Threat to BitcoinThis week, U.S. President Donald Trump signed an executive order allowing retirement 401(k) plans to invest in cryptocurrencies, as well as private equity and real estate. The move opens the door for digital assets to tap into the $12 trillion U.S. retirement savings market.
A Watershed Moment for Institutions
Integrating cryptocurrencies into retirement plans could be a historic step toward recognizing digital assets as a legitimate asset class. Younger investors, in particular, stand to benefit from exposure to high-growth, long-term instruments. However, financial advisors caution that cryptocurrencies remain highly volatile and should be part of a diversified investment strategy.
Risks and Opportunities
While expanding crypto access through pension plans offers significant upside, it also raises questions around regulation, investor protection, and fee transparency. Past market downturns have shown that excessive exposure to volatile assets can harm savings during periods of instability.
The Quantum Threat to Bitcoin
Parallel to the pension plan news, experts are increasingly discussing the potential threat of quantum computing. According to Barron’s, by the mid-2030s, technological advances could compromise the cryptographic security of older Bitcoin addresses. While approximately 75% of BTC is already stored in more modern, secure wallets, the industry is accelerating the development of quantum-resistant protocols.
Defensive Strategies
Blockchain developers — including the Bitcoin Core and Ethereum Foundation teams — are testing post-quantum cryptography algorithms to ensure long-term security. The objective is to stay ahead of technological breakthroughs that could otherwise undermine digital asset safety.
Conclusion
The U.S. decision to allow crypto investments in pension plans is a milestone for the industry, signaling maturity — but it also presents new regulatory challenges. Meanwhile, the quantum computing threat serves as a reminder that the crypto sector must invest not only in growth, but also in securing its foundational infrastructure.

USOIL: The Market Is Looking Up! Long!
My dear friends,
Today we will analyse USOIL together☺️
The market is at an inflection zone and price has now reached an area around 63.337 where previous reversals or breakouts have occurred.And a price reaction that we are seeing on multiple timeframes here could signal the next move up so we can enter on confirmation, and target the next key level of 63.685.Stop-loss is recommended beyond the inflection zone.
❤️Sending you lots of Love and Hugs❤️

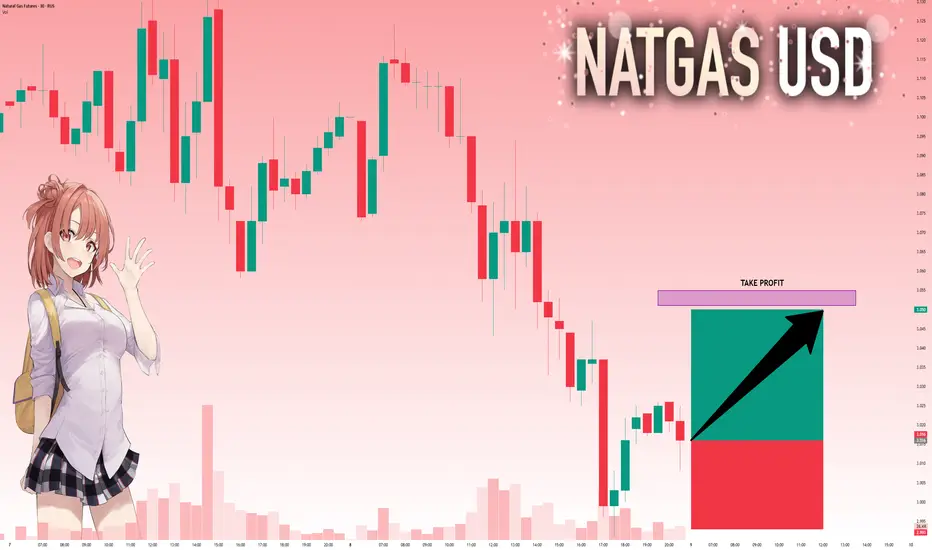
NG1!: Strong Bullish Sentiment! Long!
My dear friends,
Today we will analyse NG1!together☺️
The price is near a wide key level
and the pair is approaching a significant decision level of 3.016 Therefore, a strong bullish reaction here could determine the next move up.We will watch for a confirmation candle, and then target the next key level of 3.051.Recommend Stop-loss is beyond the current level.
❤️Sending you lots of Love and Hugs❤️
NI225: Bears Are Winning! Short!
My dear friends,
Today we will analyse NI225 together☺️
The recent price action suggests a shift in mid-term momentum. A break below the current local range around 41,820.41 will confirm the new direction downwards with the target being the next key level of 41,469.36 and a reconvened placement of a stop-loss beyond the range.
❤️Sending you lots of Love and Hugs❤️

ETHUSD: Strategic Outlook. 🚀 Ethereum – Strategic Outlook 🚀
CRYPTOCAP:ETH is showing strong structural momentum, with price action now firmly in the “Bulls in Charge” zone. My near-term target remains around $5K, but technical projections show potential expansions toward $6.9K, $10.5K, and even $13K under optimal adoption and market conditions.
Key Levels:
🟢 Bulls in Charge: ~$4.2K+
🎯 Target for Bulls: $5K–$6.9K
🔴 Target for Bears: ~$3.5K (support zone)
🏁 Ultimate Target (for now): $10.5K+
This projection accounts for:
📈 Elliott Wave structure mapping
🔍 Fibonacci extensions
🛠 Smart Money Concepts (BOS / CHoCH)
🔄 Market cycle positioning
The path is never linear — macro factors, adoption rates, and utility expansion will ultimately dictate Ethereum’s trajectory. Still, this cycle could be transformative for ETH’s role in value exchange, DeFi infrastructure, and Web3 adoption.
💡 Whether we see $5K soon or push into five-digit territory later, risk management remains key.
#Ethereum #Crypto #Trading #Blockchain #DeFi #Investment #TechnicalAnalysis

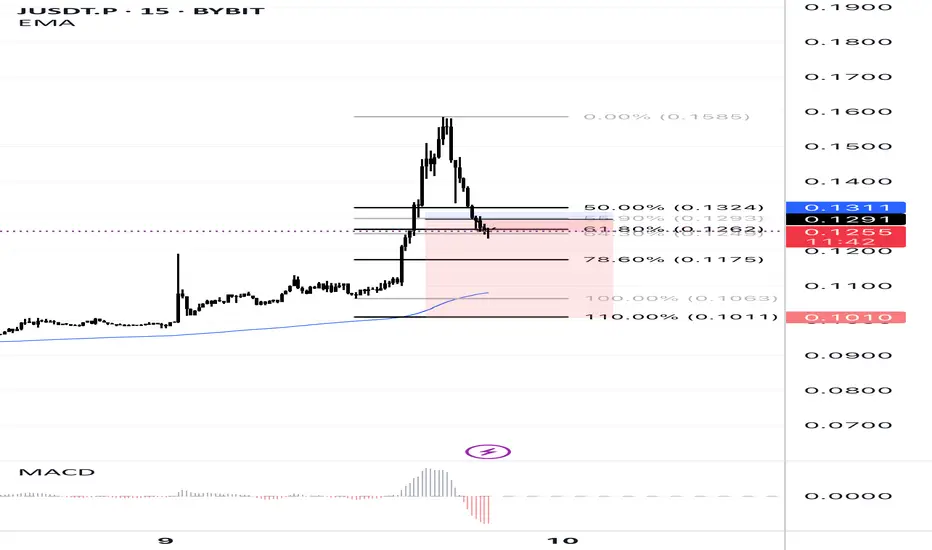
JUSDT.P 15m - Fibonacci Retracement & EMA AnalysisThis 15-minute chart of JUSDT.P highlights a sharp price spike followed by a retracement. Key Fibonacci levels (50%, 61.8%, 78.6%) are marked to identify potential support zones. The price is currently testing the 61.8% retracement level, with the EMA acting as dynamic support. MACD shows bearish momentum after the recent peak, indicating a possible continuation of the retracement or consolidation phase. Watch for price action around the 0.1260 - 0.1320 range for potential reversal or breakdown.
EURUSD Swing Outlook-Update/Market forecast! EU Swing Analysis H8-H4 Timeframe
Overall trend is bullish, on Daily> timeframe price has broken below the support trend line
Which indicates bearish corrective phase has started.
Current PA
Trend is bearish
Phase is corrective
Price has tapped into my 70.5-79.5% Fib level, in premium levels. I am looking for shorts
targeting weak low.
Price has already rejected and gave us a bearish displacemenet-clear on 6H timeframe
and a retest entry model.
Next week i am looking for price to extend the sells
(I know a lot of people are looking for price to sweep the high and mitigate the OB) but my entry criteria have been met.

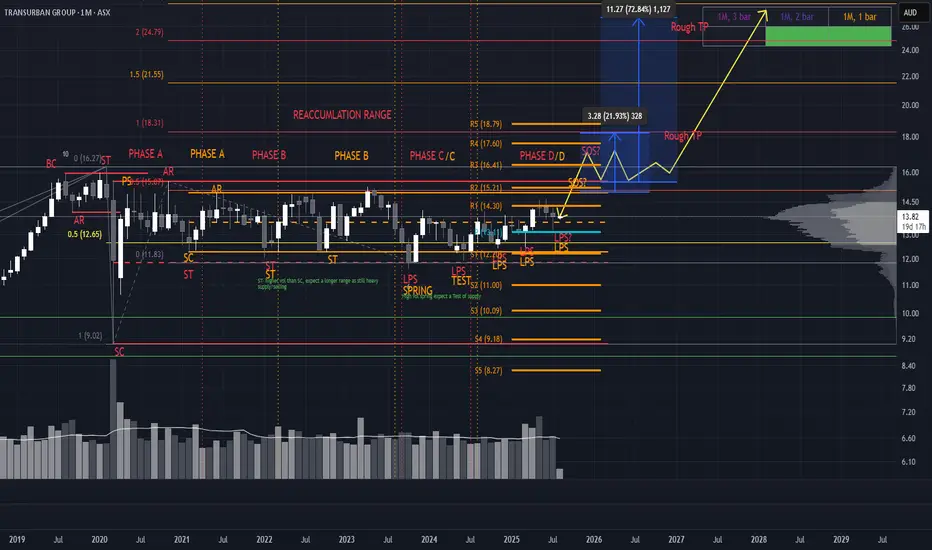
Two Ranges, One Breakout: TCL’s Wyckoff-Gann ConfluenceCurrently tracking two distinct Wyckoff ranges on TCL, each color-coded for clarity. The structure is clean despite a few lines—each range tells a story.
Accumulation Zones
Key buying opportunities are emerging at the LPS (Last Point of Support), marked by higher lows. These are classic signs of strength and absorption.
Resistance & Breakout Potential
Expect notable resistance around $15.55, but a breakout is likely. We’re approaching a Gann 4th-time breakout setup, which historically carries strong momentum. If price reaches this zone with expanding volume and wide candle spreads, it adds conviction for a Sign of Strength (SOS) and a potential pullback to retest.
Targets & Confluence For take-profit zones, I’m watching:
Yearly pivots
Range extensions from both Wyckoff structures (100%, 150%, 200%)
Gann extensions for harmonic targets
This setup blends structure, volume dynamics, and time-price symmetry. If the breakout confirms, TCL could offer a textbook Phase E markup.
*please note no time analysis is done, just looking at pathing
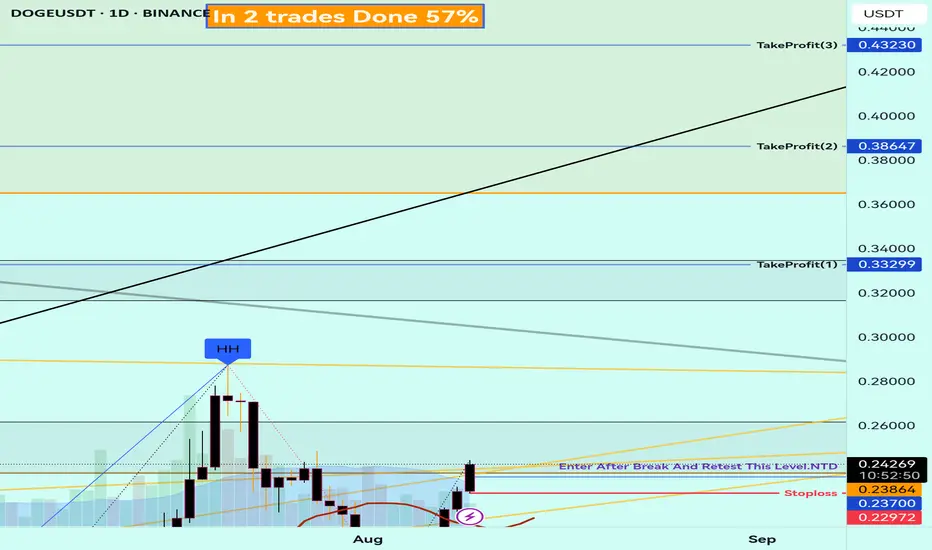
Buy Trade Strategy for DOGE: Leveraging Community and Utility Description:
This trading idea highlights DOGE (Dogecoin), a cryptocurrency that has evolved from its meme origins into a widely recognized digital asset with growing real-world use cases. Supported by one of the most active and loyal communities in the crypto space, DOGE benefits from high liquidity, mainstream awareness, and increasing adoption for microtransactions and payments. Backed by influential endorsements and a strong social media presence, DOGE continues to attract retail and institutional interest, making it a unique player in the broader cryptocurrency market.
That said, the value of DOGE remains highly sensitive to market sentiment, media coverage, and broader macroeconomic trends. Its price can experience significant volatility in short periods, meaning careful risk management is essential for anyone considering an investment.
Disclaimer:
This trading idea is for educational purposes only and should not be considered financial advice. Trading cryptocurrencies like DOGE carries substantial risks, including the possibility of losing your entire investment. Always conduct your own research, evaluate your financial position, and consult with a qualified financial advisor before making any trading or investment decisions. Past performance is not indicative of future results.
Al Yamamah Steel – Buy Plan Al Yamamah Steel – Buy Plan 🚀
Entry:
Buy on confirmed breakout above the recent consolidation range.
Ideal entry if price retests the breakout level and holds strong.
Stop Loss:
Place stop loss just below the breakout zone to protect against false moves.
Targets:
First target at the next resistance level.
Final target at the previous major swing high for maximum potential gain.
Risk Management:
Risk only a small portion of total capital.
Add positions gradually if price continues to hold above the breakout zone.
Bias:
Price action suggests bullish continuation toward previous highs, with potential for extended rally if momentum remains strong.

BTCUSD NEW OUTLOOKBtcusd sell from117,000
Target1 115,500
Target2 114,500
Target3 113,000
Stop Lose 118,500
TRADE AT YOUR OWN RISK

Buy Trade Strategy for OP: Driving Ethereum Layer-2 ScalabilityDescription:
This trading idea focuses on OP, the native token of Optimism, a leading Ethereum Layer-2 scaling solution designed to significantly reduce transaction fees and increase throughput. By utilizing optimistic rollups, OP enhances Ethereum’s performance while maintaining its security and decentralization. The token serves multiple purposes, including governance, ecosystem funding, and incentivizing network participation. With Ethereum’s network congestion and high gas fees driving demand for scalable solutions, Optimism’s growth potential positions OP as a strong contender in the Layer-2 race.
Still, the cryptocurrency market is highly volatile, and OP is not immune to sudden price swings caused by market sentiment, regulatory updates, or technological shifts. Proper risk management and awareness of potential challenges are essential for any investment in this asset.
Disclaimer:
This trading idea is for educational purposes only and does not constitute financial advice. Trading cryptocurrencies like OP carries substantial risk, including the possibility of losing your entire investment. Always conduct thorough research, assess your financial situation, and consult with a qualified financial advisor before making investment decisions. Past performance is not indicative of future results.

6 is not far from 9 and already good enough hereClose to another decision point level. Watching reaction is a must. This is a chart i forgot about but it seems it works surprisingly well.
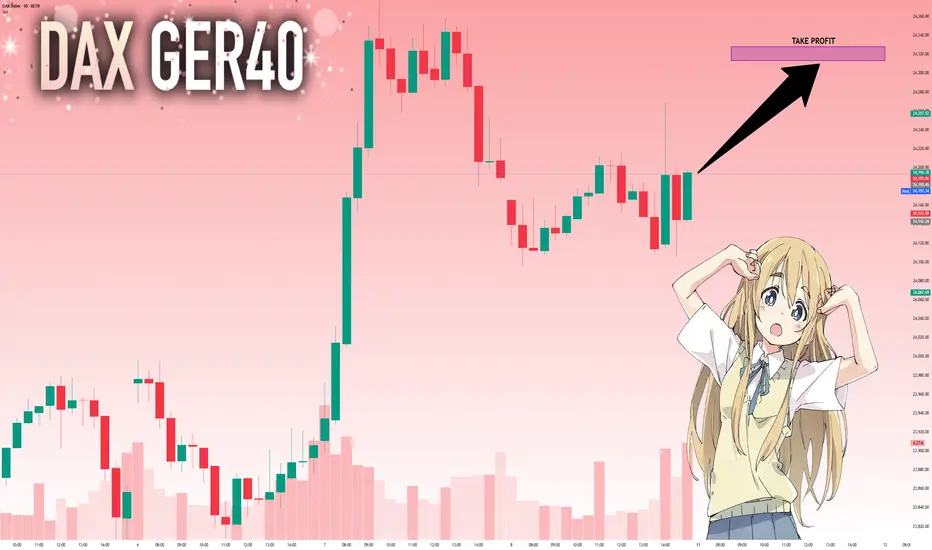
DAX: Next Move Is Up! Long!
My dear friends,
Today we will analyse DAX together☺️
The in-trend continuation seems likely as the current long-term trend appears to be strong, and price is holding above a key level of 24,194.78 So a bullish continuation seems plausible, targeting the next high. We should enter on confirmation, and place a stop-loss beyond the recent swing level.
❤️Sending you lots of Love and Hugs❤️
SILVER: Target Is Up! Long!
My dear friends,
Today we will analyse SILVER together☺️
The market is at an inflection zone and price has now reached an area around 38.330 where previous reversals or breakouts have occurred.And a price reaction that we are seeing on multiple timeframes here could signal the next move up so we can enter on confirmation, and target the next key level of 38.432.Stop-loss is recommended beyond the inflection zone.
❤️Sending you lots of Love and Hugs❤️

GOLD: Move Down Expected! Short!
My dear friends,
Today we will analyse GOLD together☺️
The price is near a wide key level
and the pair is approaching a significant decision level of 3,392.87 Therefore, a strong bearish reaction here could determine the next move down.We will watch for a confirmation candle, and then target the next key level of 3,383.49.Recommend Stop-loss is beyond the current level.
❤️Sending you lots of Love and Hugs❤️

EURUSD: Local Bearish Bias! Short!
My dear friends,
Today we will analyse EURUSD together☺️
The recent price action suggests a shift in mid-term momentum. A break below the current local range around 1.16638 will confirm the new direction downwards with the target being the next key level of 1.16530 and a reconvened placement of a stop-loss beyond the range.
❤️Sending you lots of Love and Hugs❤️

EURJPY to hit 172.250 Market Correction EURJPY Long trade, with my back testing of this strategy, EURJPY will hit 172.250
This is good trade.
Don't overload your risk like Greedy gambler!!!
Be Disciplined Trader, what what you can afford.
Use proper risk management
Looks like good trade.
Lets monitor.
Use proper risk management.
Disclaimer: only idea, not advice

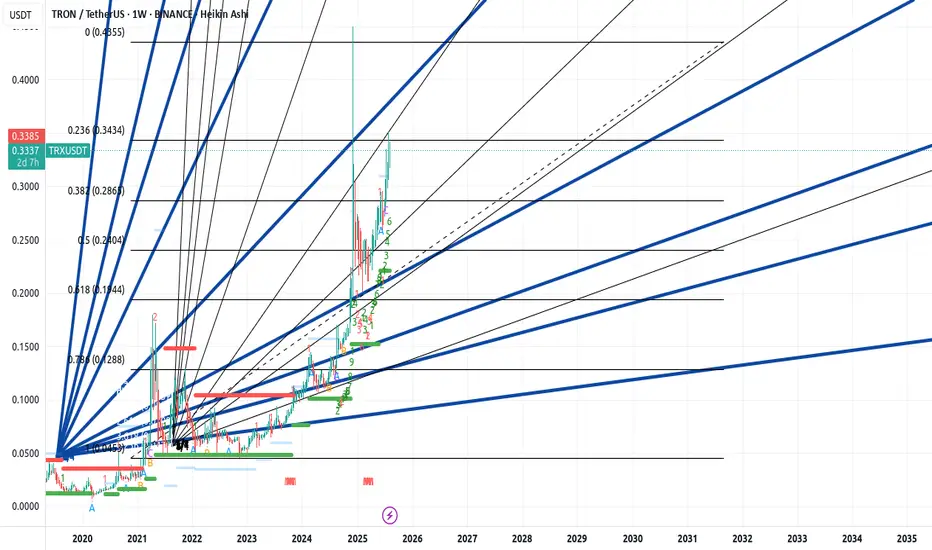
GRT Main trend. 23 02 2025Logarithm. Main trend. Time frame 1 week (no need for less). Hype will be when they promote everything related to artificial intelligence. It may go against the general trend in this regard.
But, at the moment, behind the market, which is logical. I imposed dynamic support/resistance zones of the Gann fan for orientation with the intersection of ordinary key levels (as everyone sees). I showed formations that can be formed and key reversal zones, percentages to them.
Previous closed trading idea +311% / +890%
1️⃣exactly in the designated zones of the planned first “hamster pump” +311%
2️⃣and the maximum pump (planned dump zone) 700-900%
GRT/USDT Main trend. Descending wedge. 8 02 2023
Local trading situation now.
Locally, after collecting long stop-loss at a large % (-27), this zone is held. If the market as a whole is positive, then this zone with 3 trend support points will be the main support for the development of the upward trend.
If this zone is broken, and the price consolidates below the “neck” level, then a decline to the 0.78 zone, that is, the formation of a descending wedge in the secondary trend. There will be a “double bottom” globally. Then, a breakthrough of the wedge resistance, and aggressive pumping under the hype of all that sort of thing.
Scam. Unlikely . Lower declines (implementation of "head and shoulders" without a squeeze) — the likelihood of a scam, that is, tales of hacking and "closure of the project". What is unlikely is how the project is traded in the US on Coinbase, and for this there are consequences for the creators.

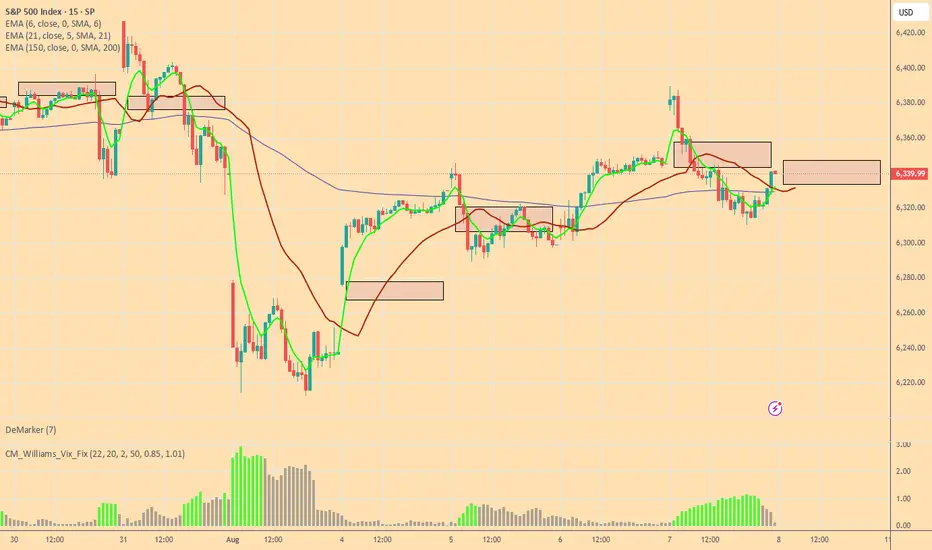
Bulls and Bears zone for 08-08-2025ETH session has rallied to 61.8 Fibonacci level of yesterday's RTH session. Any test of ETH session High could provide direction for the day.
Level to watch: 6384 --- 6386
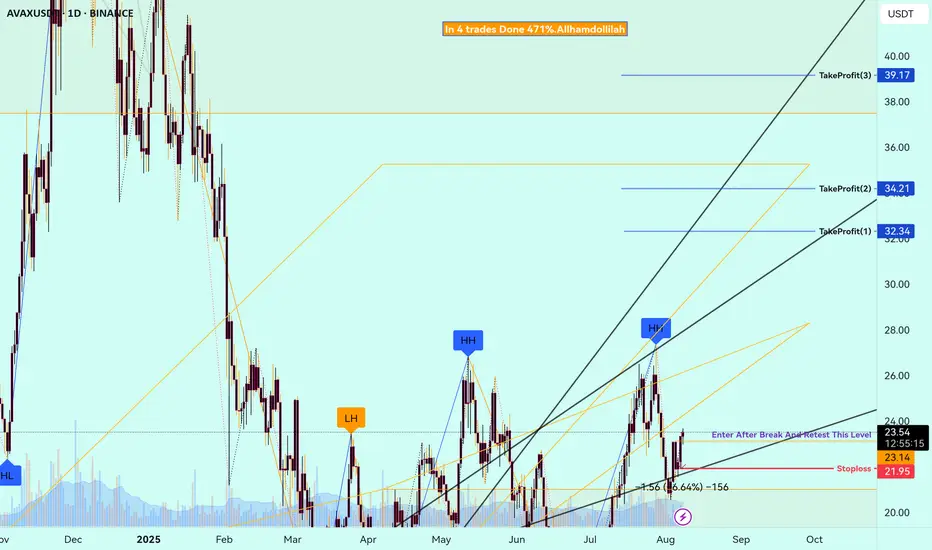
Buy Trade Strategy for AVAX: Tapping into High-Speed DeFiDescription:
This trading idea highlights AVAX, the native token of the Avalanche blockchain, known for its high-speed transactions, low fees, and scalable infrastructure. AVAX powers a robust ecosystem that supports decentralized finance (DeFi), NFTs, and Web3 applications, making it a strong contender in the competitive smart contract platform space. With its unique consensus mechanism and growing list of partnerships, Avalanche has attracted developers and users seeking efficient and eco-friendly blockchain solutions. The increasing adoption of AVAX in DeFi protocols, cross-chain interoperability, and institutional interest reinforces its long-term growth potential.
Still, the cryptocurrency market remains highly volatile, with AVAX’s price influenced by market sentiment, regulatory shifts, and broader economic conditions. Proper risk management and awareness of potential downsides are essential when considering positions in AVAX.
Disclaimer:
This trading idea is for educational purposes only and should not be taken as financial advice. Trading cryptocurrencies like AVAX carries substantial risks, including the possibility of losing your entire investment. Always conduct independent research, evaluate your risk tolerance, and consult with a licensed financial advisor before investing. Past performance does not guarantee future results.