7/9: Focus on Selling Gold on ReboundsGood evening, everyone!
Apologies for the late update today—I had some matters to attend to. I hope your trades are going smoothly.
Yesterday, gold found support around 3284 and continued to rebound during today’s session, reaching as high as 3330. The key resistance at 3321 has now been broken and is currently acting as a short-term support level. However, based on the current price structure, this level is likely to be retested multiple times, and some consolidation may follow.
The next major resistance lies between 3337 and 3343. In the absence of strong bullish momentum, the preferred short-term strategy remains selling on rebounds, especially near resistance zones.
⚠️ Additionally, the U.S. Initial Jobless Claims data will be released during the New York session tonight, which may cause increased volatility and potentially whipsaw price action. Be cautious with position sizing, and avoid emotional trades or chasing price action during news releases. Patience and discipline will be key.
Gann

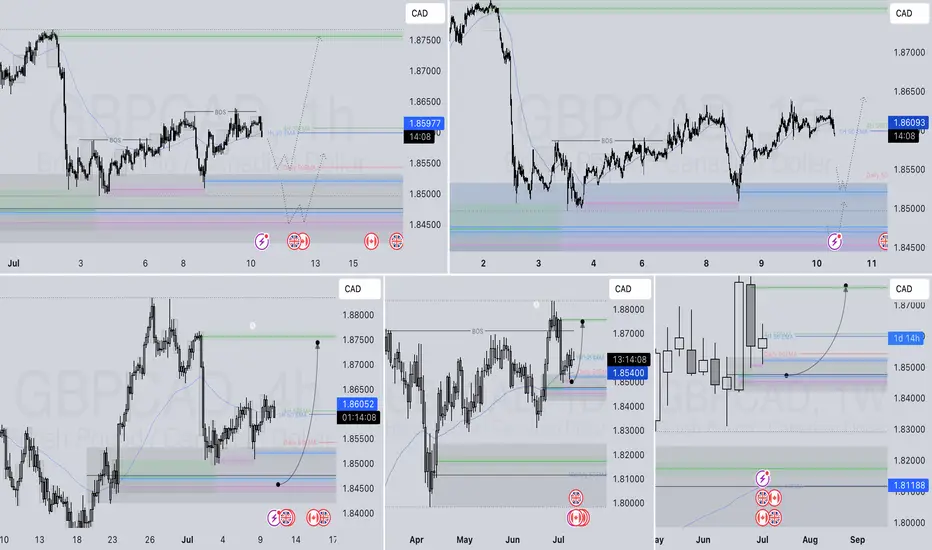
GBPCAD LONG FORECAST Q3 D10 W28 Y25GBPCAD LONG FORECAST Q3 D10 W28 Y25
Professional Risk Managers👋
Welcome back to another FRGNT chart update📈
Diving into some Forex setups using predominantly higher time frame order blocks alongside confirmation breaks of structure.
Let’s see what price action is telling us today! 👀
💡Here are some trade confluences📝
✅Daily Order block identified
✅4H Order Block identified
✅1H Order Block identified
🔑 Remember, to participate in trading comes always with a degree of risk, therefore as professional risk managers it remains vital that we stick to our risk management plan as well as our trading strategies.
📈The rest, we leave to the balance of probabilities.
💡Fail to plan. Plan to fail.
🏆It has always been that simple.
❤️Good luck with your trading journey, I shall see you at the very top.
🎯Trade consistent, FRGNT X
AUDJPY SHORT FORECAST Q3 D10 W28 Y25AUDJPY SHORT FORECAST Q3 D10 W28 Y25
Professional Risk Managers👋
Welcome back to another FRGNT chart update📈
Diving into some Forex setups using predominantly higher time frame order blocks alongside confirmation breaks of structure.
Let’s see what price action is telling us today! 👀
🔑 Remember, to participate in trading comes always with a degree of risk, therefore as professional risk managers it remains vital that we stick to our risk management plan as well as our trading strategies.
📈The rest, we leave to the balance of probabilities.
💡Fail to plan. Plan to fail.
🏆It has always been that simple.
❤️Good luck with your trading journey, I shall see you at the very top.
🎯Trade consistent, FRGNT X

AUDCAD SHORT DAILY FORECAST Q3 D10 W28 Y25AUDCAD SHORT DAILY FORECAST Q3 D10 W28 Y25
Professional Risk Managers👋
Welcome back to another FRGNT chart update📈
Diving into some Forex setups using predominantly higher time frame order blocks alongside confirmation breaks of structure.
Let’s see what price action is telling us today! 👀
💡Here are some trade confluences📝
✅Daily Order block identified
✅4H Order Block identified
✅1H Order Block identified
🔑 Remember, to participate in trading comes always with a degree of risk, therefore as professional risk managers it remains vital that we stick to our risk management plan as well as our trading strategies.
📈The rest, we leave to the balance of probabilities.
💡Fail to plan. Plan to fail.
🏆It has always been that simple.
❤️Good luck with your trading journey, I shall see you at the very top.
🎯Trade consistent, FRGNT X

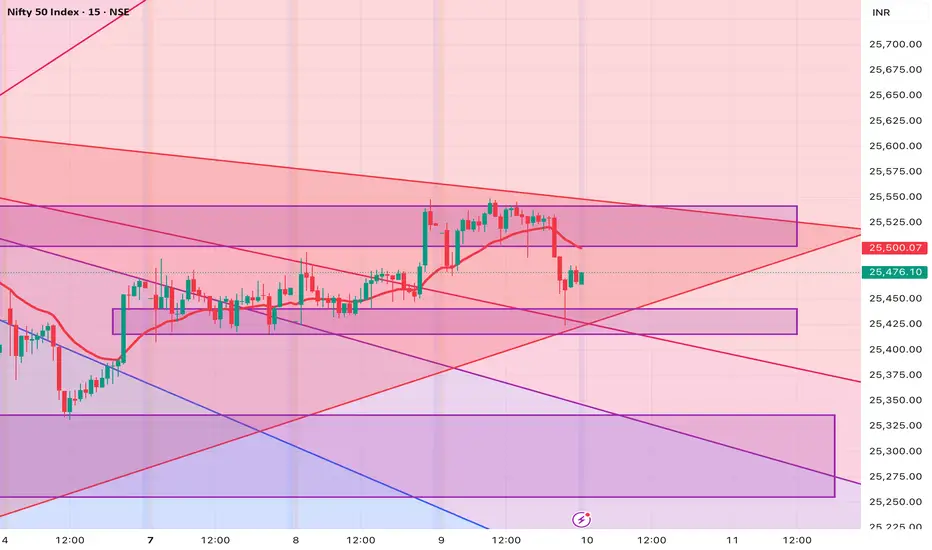
Levels for Nifty - 10 July 2025As the market was in the range of 25548-25425 i.e. traded within the support and resistance, one can plan long/ short:
1. Long once 25560 is broken for target of 25580 and second target of 25610.
2. Short only after the strong support zone of 25415 is broken for target of 25370 and second target of 25336. Do keep in mind of the trendline which will act as support
3. No trading zone with be todays range of 25548-25425
EURJPY SHORT DAILY FORECAST Q3 D10 W28 Y25EURJPY SHORT DAILY FORECAST Q3 D10 W28 Y25
Professional Risk Managers👋
Welcome back to another FRGNT chart update📈
Diving into some Forex setups using predominantly higher time frame order blocks alongside confirmation breaks of structure.
Let’s see what price action is telling us today! 👀
💡Here are some trade confluences📝
✅Daily Order block identified
✅4H Order Block identified
✅1H Order Block identified
🔑 Remember, to participate in trading comes always with a degree of risk, therefore as professional risk managers it remains vital that we stick to our risk management plan as well as our trading strategies.
📈The rest, we leave to the balance of probabilities.
💡Fail to plan. Plan to fail.
🏆It has always been that simple.
❤️Good luck with your trading journey, I shall see you at the very top.
🎯Trade consistent, FRGNT X

AUDUSD SHORT FORECAST Q3 D10 W28 Y25AUDUSD SHORT FORECAST Q3 D10 W28 Y25
Professional Risk Managers👋
Welcome back to another FRGNT chart update📈
Diving into some Forex setups using predominantly higher time frame order blocks alongside confirmation breaks of structure.
Let’s see what price action is telling us today! 👀
💡Here are some trade confluences📝
✅Daily Order block identified
✅4H Order Block identified
✅1H Order Block identified
🔑 Remember, to participate in trading comes always with a degree of risk, therefore as professional risk managers it remains vital that we stick to our risk management plan as well as our trading strategies.
📈The rest, we leave to the balance of probabilities.
💡Fail to plan. Plan to fail.
🏆It has always been that simple.
❤️Good luck with your trading journey, I shall see you at the very top.
🎯Trade consistent, FRGNT X

USDCAD LONG DAILY FORECAST Q3 D10 W28 Y25USDCAD LONG DAILY FORECAST Q3 D10 W28 Y25
Professional Risk Managers👋
Welcome back to another FRGNT chart update📈
Diving into some Forex setups using predominantly higher time frame order blocks alongside confirmation breaks of structure.
Let’s see what price action is telling us today! 👀
💡Here are some trade confluences📝
✅Daily Order block identified
✅4H Order Block identified
✅1H Order Block identified
🔑 Remember, to participate in trading comes always with a degree of risk, therefore as professional risk managers it remains vital that we stick to our risk management plan as well as our trading strategies.
📈The rest, we leave to the balance of probabilities.
💡Fail to plan. Plan to fail.
🏆It has always been that simple.
❤️Good luck with your trading journey, I shall see you at the very top.
🎯Trade consistent, FRGNT X

EURGBP SHORT DAILY FORECAST Q3 D10 W28 Y25EURGBP SHORT DAILY FORECAST Q3 D10 W28 Y25
Professional Risk Managers👋
Welcome back to another FRGNT chart update📈
Diving into some Forex setups using predominantly higher time frame order blocks alongside confirmation breaks of structure.
Let’s see what price action is telling us today! 👀
💡Here are some trade confluences📝
✅Daily Order block identified
✅4H Order Block identified
✅1H Order Block identified
🔑 Remember, to participate in trading comes always with a degree of risk, therefore as professional risk managers it remains vital that we stick to our risk management plan as well as our trading strategies.
📈The rest, we leave to the balance of probabilities.
💡Fail to plan. Plan to fail.
🏆It has always been that simple.
❤️Good luck with your trading journey, I shall see you at the very top.
🎯Trade consistent, FRGNT X

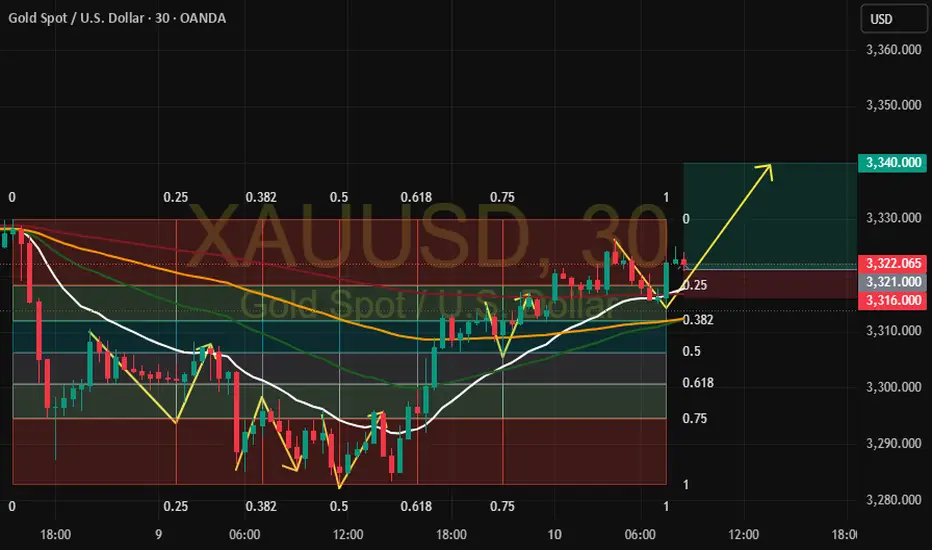
XAUUSD Bullish Setup (30m) 📊 **XAUUSD Bullish Setup (30m)** 🟡
Gold is showing a potential bullish continuation after breaking structure and retesting the lower Gann box range.
🟩 **The price is currently holding within the Gann Box**, respecting both time and price symmetry, and bouncing off the **0.382 Fibonacci level** — indicating a healthy correction in an uptrend.
📌 The confluence between:
* Fibonacci retracement
* Gann box support
* EMA dynamic support
...could provide the fuel for the next bullish impulse.
🔹 **Entry Zone**: 3,321
🔹 **Stop**: 3,316
🔹 **Target 1** 🎯: 3,340
🔹 **Target 2** 🎯: 3,360
🔹 **Risk-Reward**: Up to 1:8 ✅
🧠 Key confirmations:
* Bullish price action inside Gann box
* Holding above dynamic support (white EMA)
* Time symmetry favors bullish momentum
🚨 Wait for a bullish candle close within the upper half of the Gann box to confirm breakout continuation.
#BTCUSDTbearish side of the btc is slow, as the volume of sell is not that high...…any strategy doesn't fit the lower low, i am seeing btc to the 132k.
anyone overthere with a new different strategy regarding btc?

ADA/USDT – Mid-Term Technical Analysis
Cardano has just bounced from a key FIBO support zone (0.618–0.786), suggesting that the correction may have bottomed out and a bullish reversal is in play.
📍 Current Price: $0.6235
🎯 Target 1: $0.9989
🎯 Target 2: $1.2164
🎯 Target 3: $1.3795

$SUI/USDT Technical Analysis
Major Bounce from FIBO ZONE 📈
SUI has just bounced off the golden Fibonacci retracement zone (0.618–0.786), confirming it as strong dynamic support. This move comes after a healthy correction from previous highs.
📍 Current Price: $3.0816
🎯 Target 1: $4.8865
🎯 Target 2: $7.4445
🛡 Invalidation Level: Weekly close below $2.40 may signal weakness

Extremely bullish on gold I am long Gold, 1hr breaker after attacking sellside mutiple times, dxy is correcting right now as well. its wednesday so we could see mid week reversal, we also have equal highs. We are also inversing a 1hr fvg (RED) which adds confluence with the breaker. solid setup, invalidation is 3303 and tp is 3372.

Buy Trade Strategy for WIF: Riding the Meme Coin Momentum ShiftDescription:
This trading idea highlights WIF (Dogwifhat), a meme-based cryptocurrency that has gained widespread attention within the crypto community for its viral branding, strong community support, and notable price movements. Unlike traditional projects, WIF thrives on cultural influence and social engagement, positioning itself within a growing trend of community-driven meme coins that often outperform expectations during market upswings. Its recent listings on major exchanges and rapid increase in trading volume underscore the speculative appeal and momentum behind the token.
Despite its popularity, it’s important to remember that meme coins like WIF carry heightened risks due to their reliance on hype, sentiment, and social media trends rather than fundamental utility or long-term development. Market sentiment can shift quickly, and price volatility is often extreme.
Disclaimer:
This trading idea is for educational purposes only and should not be considered financial advice. Meme coins such as WIF are highly speculative assets and involve a significant risk of capital loss. Always do your own research, assess your financial position carefully, and consult with a qualified advisor before making any investment decisions. Past performance is not indicative of future results.

XAUUSDXAUUSD in short/ Mid term we gonna go to 3500.
Longterm its 5K, like i already mention in 2022

Buy Trade Strategy for PEPE: Riding Meme Culture and Market HypeDescription:
This trading idea focuses on PEPE, a meme-based cryptocurrency that has quickly captured the attention of the crypto community. Inspired by internet culture and designed to harness the viral power of memes, PEPE has benefited from massive online engagement, rapid trading volume growth, and strong community-driven momentum. While it may not offer traditional utility like other tokens, its success lies in speculation, visibility, and the strength of its digital identity — characteristics that have driven short-term rallies in similar tokens like DOGE and SHIBA.
Nonetheless, it's important to understand that meme coins like PEPE are highly speculative and volatile. Their prices are heavily influenced by social media trends, influencer activity, and general market sentiment, rather than long-term fundamentals or real-world utility. Therefore, while potential gains can be attractive, the risks are equally significant and require careful consideration.
Disclaimer:
This trading idea is for educational purposes only and should not be taken as financial advice. Cryptocurrencies — particularly meme coins like PEPE — involve a high level of risk, including the possible loss of your entire investment. Always conduct your own research, evaluate your financial situation, and speak to a licensed financial advisor before making any trading decisions. Past performance is not a guarantee of future results.

Buy Trade Strategy for ETHFI: Tapping Into the Future of ETH Title:
Buy Trade Strategy for ETHFI: Tapping Into the Future of Ethereum Restaking
Description:
This trading idea is centered on ETHFI, the governance token of the EtherFi protocol, a rising player in the Ethereum liquid restaking ecosystem. ETHFI empowers users to participate in the decentralized governance of EtherFi while benefiting from innovative staking models that unlock liquidity for staked ETH. As Ethereum continues to evolve post-merge, protocols like EtherFi aim to maximize staking efficiency and accessibility, making ETHFI an integral part of the Ethereum restaking narrative. Its unique position in this emerging sector, coupled with increasing adoption and ecosystem development, suggests strong long-term potential.
Nevertheless, the crypto market remains highly volatile, and investments in tokens like ETHFI carry inherent risks influenced by regulatory decisions, protocol upgrades, and broader market dynamics. Prudent risk management and informed decision-making are crucial when engaging with early-stage governance assets.
Disclaimer:
This trading idea is for educational purposes only and should not be considered financial advice. Cryptocurrencies, including ETHFI, involve a high degree of risk and may result in total loss of capital. Always conduct your own research, consider your financial situation, and consult a licensed financial advisor before making any investment decisions. Past performance is not a reliable indicator of future results.


S&P 500 Technical Analysis – Potential Correction AheadThe S&P 500 is approaching critical historical resistance levels, just as economic headwinds begin to resurface — particularly the expiration of tariff ceasefire agreements and renewed trade tensions. These overlapping factors could signal an upcoming technical correction.
🔹 From a technical standpoint:
The index is forming a classic multiple-top pattern, typically associated with weakening bullish momentum and potential trend reversals.
However, we remain cautious and will only consider a bearish scenario if the 6200 support level is broken on a daily close.
📉 Proposed Trading Plan:
• Short entry: Only if the daily close is below 6200
• Stop-loss: Daily close above the last top
• Targets in order:
• 5800
• 5500
• 5250
⚠️ Note: Despite the bearish setup, we do not recommend rushing into selling without confirmation of support break.

SELL GBPUSD🚨 Trade Alert 🚨
📉 SELL GBPUSD NOW!
🔻 Market hitting key resistance level – expect bearish momentum.
🎯 Target: | 🛑 Stop Loss:
💹 Risk management is key – stay sharp!
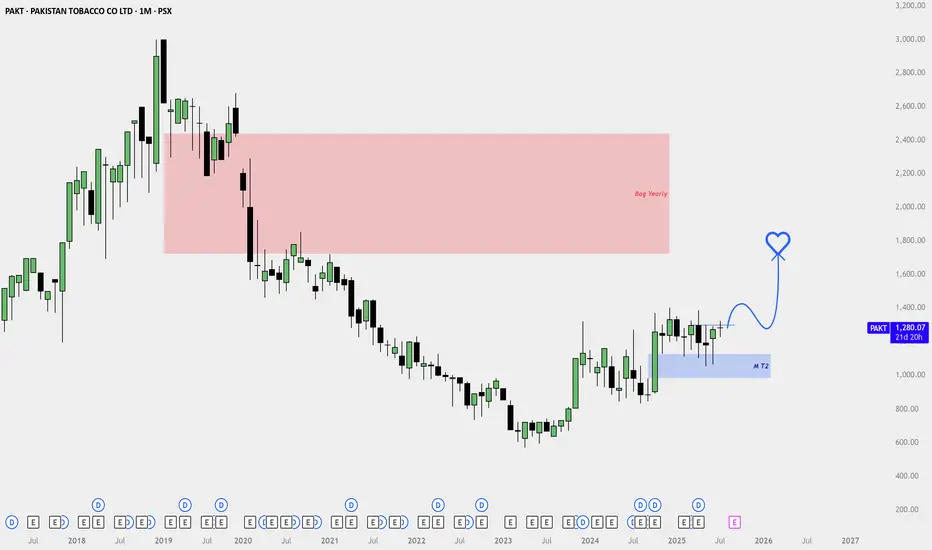
PAKT Monthly Buy Setup – Bullish Reversal Toward Higher Imbalanc🟢 Directional Bias: Bullish (Long-Term Reversal in Play)
Price is emerging from a multi-year downtrend and has now formed a clear higher low and higher high structure.
The monthly candle has shown strength after reacting from a well-defined monthly fair value gap (M T2), indicating institutional interest and demand.
📍 Key Levels
Demand Zone (Entry Area): Monthly fair value gap (M T2)
Current Price: Trading above recent consolidation
Target Area: Higher timeframe imbalance (Bag Yearly)
Resistance Before Target: Slight hurdle just above current breakout zone (may cause short-term pullback)
📈 Price Action Analysis
Price tapped into the monthly FVG and formed a base (accumulation structure).
A breakout candle is now forming above recent highs, which suggests continuation.
Expect a potential minor pullback/retest before rallying toward the higher imbalance zone.
📌 Entry Idea
Entry: Look for dips back into the breakout zone to build long exposure
Stop Loss: Just below the demand zone
Target: Higher imbalance zone
Risk-Reward: Favors swing buyers holding long-term
🧠 Context Note
This is a monthly timeframe swing trade idea, so patience is key.
Ideal for investors or position traders holding for several months.
Watch for strong monthly closes above current structure for added confirmation.
Silver Bear together with equity crash (SPX/NDX/DAX)Ride the wave down on your surf board. Fresnille will kneel a 20 % where tech firms might go down 40-50% (e.g. Apple)
