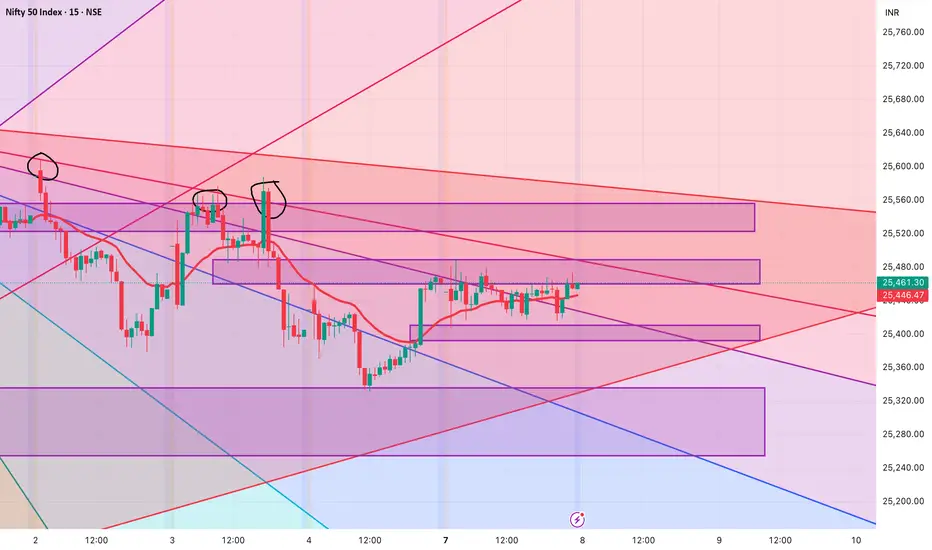
Levels for Nifty tomorrow - 08 July 2025
Please watch out for levels in Nifty for 08 July 2025
1. Long after 25490 for target of 25522 -25555.
2. Short after 25390 for target of 25337 and if this is broken with volume we can look for 25253.
3. 25490-25392 are the no trade/ sideways zone
Also we have see the rejection from the trendline above, so kindly watchout incase of gap-up
Gann
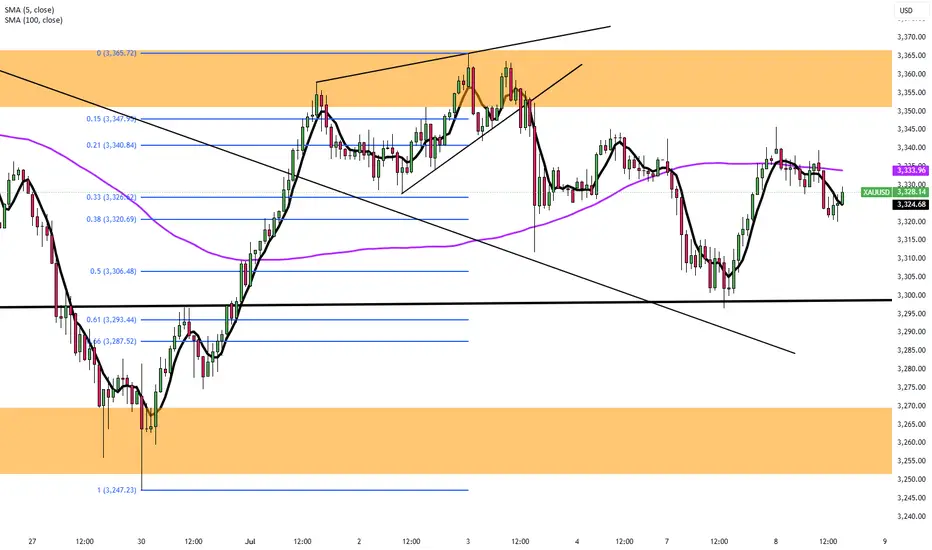
Gold Rebounds Toward $3,350Gold (XAU/USD) rebounded from a five-day low of $3,297, climbing toward $3,350 after Trump announced 25% tariffs on Japan and South Korea effective August 1, with 12 more countries receiving similar tariff warnings ranging between 25% and 40%. The rising risk of a global trade war fueled safe-haven demand, though gold’s gains were capped by simultaneous US Dollar strength.
Resistance is at $3,365, while support holds at $3,300.
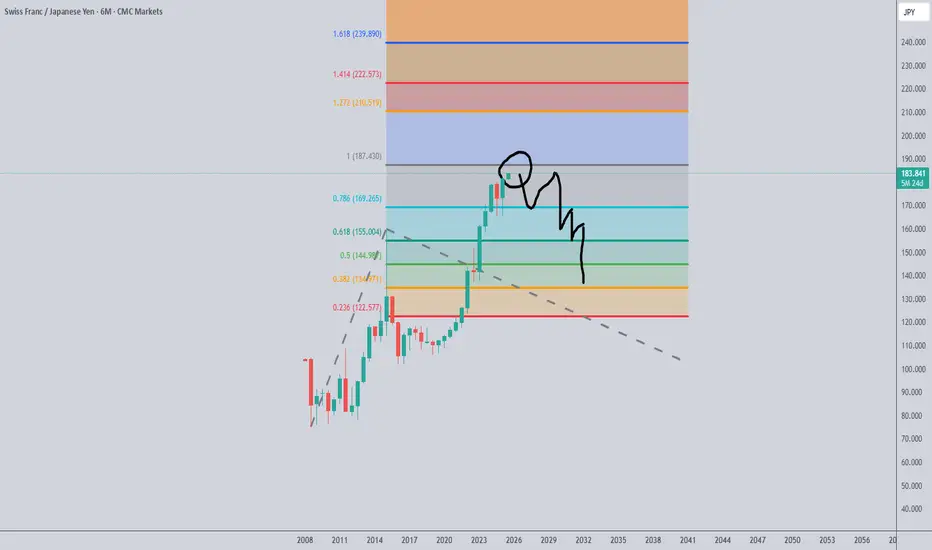
CHFJPY The 1.0 Fibonacci level could be a potential reversal zonThe 1.0 Fibonacci level could be a potential reversal zone for CHFJPY.
Gold LongWaiting for the 4h order block to get hit . From there i will strike with a nice long position.
Let us wait for ny session.
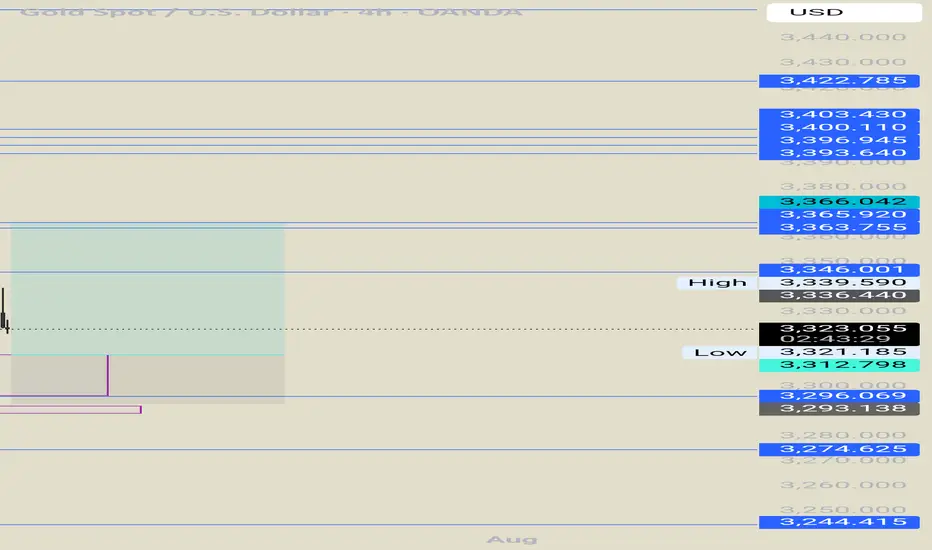
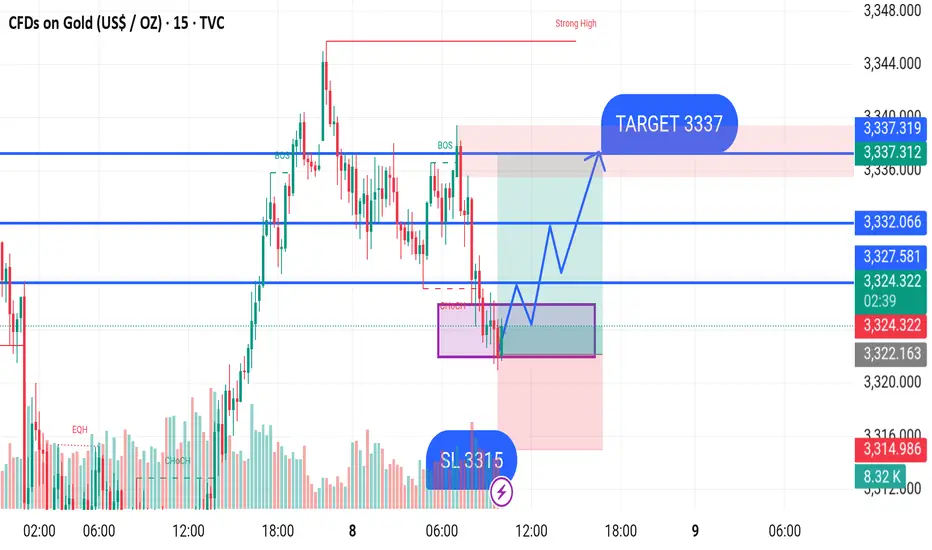
GOLD Gold (XAU/USD) 15-Min Chart Analysis – July 8, 2025
Price is currently trading around 3,323, inside a key demand/support zone (3,315–3,318) marked in purple. A Change of Character (CHoCH) suggests a potential shift in momentum from bearish to bullish.
Following a Break of Structure (BOS) to the downside, the market is expected to find support at this level, with buyers likely stepping in.
Trade Plan:
Buy Entry Zone: 3,318 – 3,320
Stop Loss (SL): 3,315 (below demand zone)
Take Profit (TP):
First Resistance: 3,327
Second Resistance: 3,332
Final Target: 3,337
If bullish momentum confirms, price is expected to rise through key resistance levels toward the final target at 3,337.
GOLD
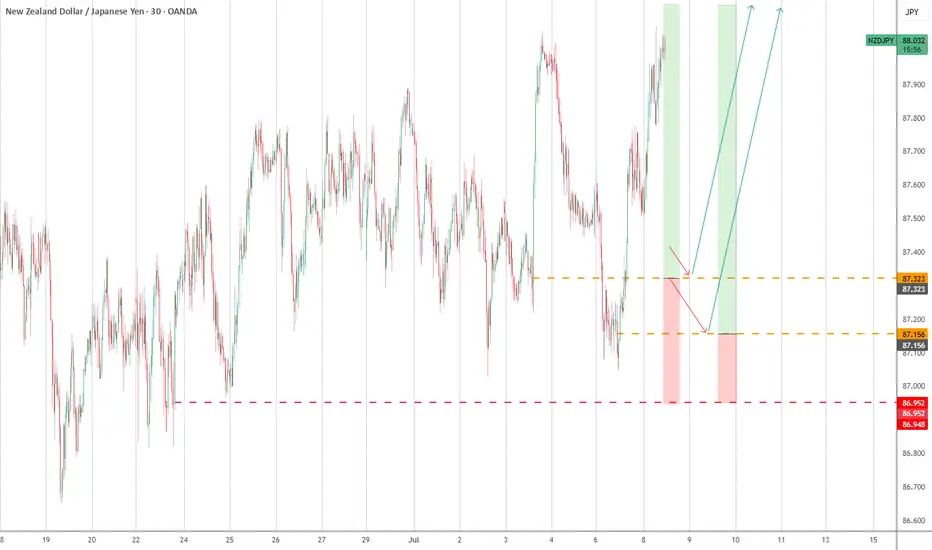
nzdjpy📈 The trend is clearly bullish, with the week starting strong and Friday closing above the 22-period daily moving average.
Now it’s just a matter of waiting for a correction to enter at a more interesting price zone. Personally, I believe the price has a high probability of visiting the two marked areas — roughly a 75% and 60% chance, respectively.
If you're looking to manage a tighter stop-loss and aim for a risk-to-reward ratio around 1:5, this setup could be for you. 🔍
⚠️ Always remember: risk no more than 0.5% of your account per trade.
#NZDJPY #SwingTrade #Forex #RiskManagement #TradingView
XAUUSD: Market Analysis and Strategy for July 8Gold technical analysis
Daily chart resistance 3360, support below 3284
Four-hour chart resistance 3350, support below 3300
One-hour chart resistance 3344, support below 3314
Analysis of gold news: Last week, as the market continued to increase its bets on the Fed's dovish stance, gold rose steadily after rebounding from a major trend line. However, after the release of the stronger-than-expected US non-farm payrolls report (NFP), market expectations for interest rates turned hawkish again, and the gold rally reversed. This week, the focus will be on the Fed's minutes and the expiration of the tariff exemption on July 9, and whether it will send a signal of possible interest rate cuts in the future. Is it an extension of the tariff exemption agreement or a return to the tariff rate when the tariff took effect on April 2. To judge the further direction of the market. If the minutes are dovish, it means that policymakers are cautious about the economic outlook, the US dollar may face correction pressure, and gold prices will be supported to rebound and strengthen. On the contrary, if the need to maintain high interest rates is emphasized, it is expected to boost the strength of the US dollar and suppress the decline in gold prices. However, it is not expected to change the trend of gold prices in the near and short term.
Gold operation suggestions: From the current trend analysis, the support below focuses on the four-hour level near 3314, and the upper pressure focuses on the 3339-3350 range. The short-term long and short strength dividing line is 3314. If the four-hour level stabilizes above this position, continue to buy at a low level.
Buy: 3314near SL: 3309
Buy: 3350near SL: 3345

XAUUSDHello traders,
Today we're taking advantage of a great buying opportunity on the XAUUSD pair. This setup is ideal for both medium- and long-term positions. I anticipate that the price will rise toward the 3392.82 USD level in the coming weeks.
That’s why I’ve positioned this trade as a medium-term opportunity.

GBPUSD LONG FORECAST Q3 D8 W28 Y25GBPUSD LONG FORECAST Q3 D8 W28 Y25
Professional Risk Managers👋
Welcome back to another FRGNT chart update📈
Diving into some Forex setups using predominantly higher time frame order blocks alongside confirmation breaks of structure.
Let’s see what price action is telling us today!
💡Here are some trade confluences📝
✅Daily order block
✅1H Order block
✅Intraday breaks of structure
✅4H Order block
🔑 Remember, to participate in trading comes always with a degree of risk, therefore as professional risk managers it remains vital that we stick to our risk management plan as well as our trading strategies.
📈The rest, we leave to the balance of probabilities.
💡Fail to plan. Plan to fail.
🏆It has always been that simple.
❤️Good luck with your trading journey, I shall see you at the very top.
🎯Trade consistent, FRGNT X

USDCAD LONG DAILY FORECAST Q3 D8 W28 Y25USDCAD LONG DAILY FORECAST Q3 D8 W28 Y25
Professional Risk Managers👋
Welcome back to another FRGNT chart update📈
Diving into some Forex setups using predominantly higher time frame order blocks alongside confirmation breaks of structure.
Let’s see what price action is telling us today! 👀
💡Here are some trade confluences📝
✅Daily Order block identified
✅4H Order Block identified
✅1H Order Block identified
🔑 Remember, to participate in trading comes always with a degree of risk, therefore as professional risk managers it remains vital that we stick to our risk management plan as well as our trading strategies.
📈The rest, we leave to the balance of probabilities.
💡Fail to plan. Plan to fail.
🏆It has always been that simple.
❤️Good luck with your trading journey, I shall see you at the very top.
🎯Trade consistent, FRGNT X

AUDJPY SHORT FORECAST Q3 D8 W28 Y25AUDJPY SHORT FORECAST Q3 D8 W28 Y25
Professional Risk Managers👋
Welcome back to another FRGNT chart update📈
Diving into some Forex setups using predominantly higher time frame order blocks alongside confirmation breaks of structure.
Let’s see what price action is telling us today! 👀
🔑 Remember, to participate in trading comes always with a degree of risk, therefore as professional risk managers it remains vital that we stick to our risk management plan as well as our trading strategies.
📈The rest, we leave to the balance of probabilities.
💡Fail to plan. Plan to fail.
🏆It has always been that simple.
❤️Good luck with your trading journey, I shall see you at the very top.
🎯Trade consistent, FRGNT X

USDZAR-SELL strategy 3 Hourly chart GANNThe pair has some resistance near 17.8500 area, and we are little negative for some indicators. The move lower will be minor and should not carry high expectation of large decline. I think we are building towards sharper move higher in the medium0term.
Strategy sell @ 17.7850-17.8350 and take profit near 17.6750.

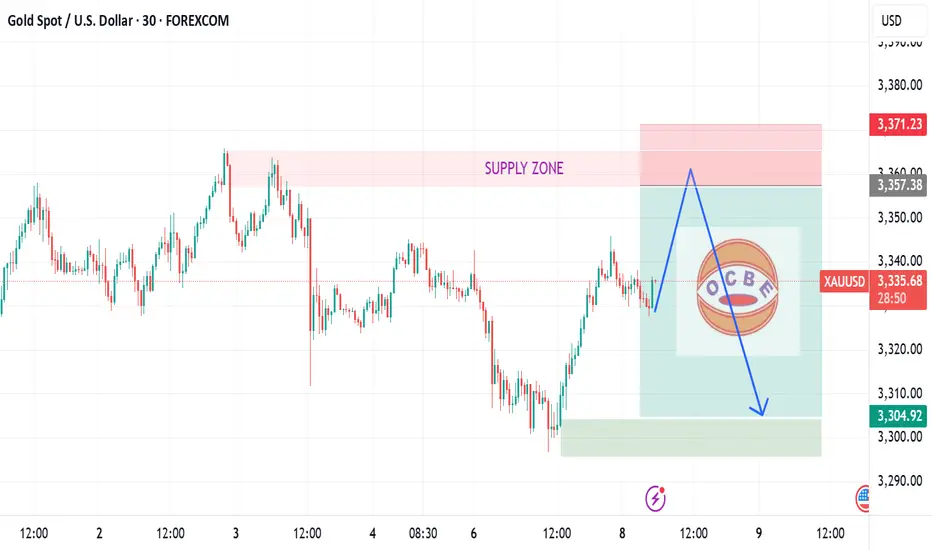
XAUUSD short movePrice is rising towards our supply zone, any bearish reaction cloud lead price to fall.
bullish on adaWe are at the bottom of the range for cardano, i would bot being trying to short at these levels. Howver i dont like that we left equal lows, so I am waiting for a obvious sweep of the lows and a discplacement leg on the 1he or 4hr

bearish on oilequal lows on crude oil, but with dxy looking bullish, i feel like it would be a little problamatic trying to find a smooth ride lower. The price action is thier tho, i would defietly not be trying to long when we have eqaul lows.

Mixed market for GOLDHard to frame an idea for gold because the dxy looks strong and gold looks strong as well, indicating to me a mixed market. Sitting on the sidelines for gold is probably the better bet right now because we just had a sweep of buyside liquidty and tapped back into a daily fvg. Notice the candles, and how they didnt close above the swing high. So because gold looks bullish and dxy looks bullish, im not interested in gold for tuesday trading. But if i had to pikc, we continue up for gold and attacck that buyside/ eqaul highs

XAUUSD Bullish and bearish. Which one first?
📉 Gold and NDX: Seasonal Patterns and Short-Term Outlook
Historically, gold tends to show weakness during the first three weeks of July, often setting the stage for one last leg up before institutional selling kicks in on U.S. equities. Based on seasonal patterns, this aligns with a typically bullish phase for the Nasdaq (NDX), which often extends until around July 24, with the usual volatility along the way.
From there, gold tends to recover, historically offering a 3–5% return into mid-September. Keep in mind, this is purely based on statistics—always do your own analysis.
🔎 This week’s short-term setup:
We may see a push higher in gold later today and into tomorrow, followed by potential downside during the second half of the week. While there might be brief upside opportunities, I won’t be taking any long positions—only looking to sell rallies—since the short-term trend remains more bearish than bullish.
Stay sharp and trade safe. 📊

Britania Notable Fluctuations In the last few days, Britannia's stock has experienced notable fluctuations, driven by market sentiment and recent earnings reports.
Following a positive outlook from analysts, the stock saw a brief rally, fueled by strong consumer demand and effective cost management strategies.
However, profit-taking and broader market trends led to slight pullbacks.
Overall, the stock remains a focus for investors watching for further developments in the FMCG sector and its ongoing recovery post-pandemic.
Buy at 5869
SL 1:- 5848
SL 2:- 5827
TGT1 :- 5910
TGT2:- 5980

Tuesday Outlook on Gold (XAU/USD)
After Monday’s move into the 4H Fair Value Gap and rejection near the trendline and Asia High, I’m expecting a corrective move to start Tuesday.
I’m currently watching two possible downside targets:
🔸 Scenario 1: A short-term drop into the upper part of the 4H FVG (around 3320–3310) – this zone could act as intraday demand and cause a quick bounce.
🔸 Scenario 2: A deeper retracement toward the unfilled imbalance around 3290–3280, lining up with the London Low and completing the 4H FVG.
This would be a more significant liquidity sweep before a potential bullish reaction.
From both zones, I’ll be looking for price action to confirm a possible long setup back toward the trendline and above.
Let’s see how Tuesday plays out.


AUDJPY SHORT FORECAST Q3 W28 Y25AUDJPY SHORT FORECAST Q3 W28 Y25
Professional Risk Managers👋
Welcome back to another FRGNT chart update📈
Diving into some Forex setups using predominantly higher time frame order blocks alongside confirmation breaks of structure.
Let’s see what price action is telling us today! 👀
💡Here are some trade confluences📝
✅Weekly Order Block Identified
✅Daily Order block identified
✅4H Order Block identified
✅15' Order block identified
🔑 Remember, to participate in trading comes always with a degree of risk, therefore as professional risk managers it remains vital that we stick to our risk management plan as well as our trading strategies.
📈The rest, we leave to the balance of probabilities.
💡Fail to plan. Plan to fail.
🏆It has always been that simple.
❤️Good luck with your trading journey, I shall see you at the very top.
🎯Trade consistent, FRGNT X

AUDUSD SHORT & LONG FORECAST Q3 W28 Y25AUDUSD SHORT & LONG FORECAST Q3 W28 Y25
Professional Risk Managers👋
Welcome back to another FRGNT chart update📈
Diving into some Forex setups using predominantly higher time frame order blocks alongside confirmation breaks of structure.
Let’s see what price action is telling us today! 👀
💡Here are some trade confluences📝
✅Daily Order block identified
✅4H Order Block identified
✅1H Order Block identified
🔑 Remember, to participate in trading comes always with a degree of risk, therefore as professional risk managers it remains vital that we stick to our risk management plan as well as our trading strategies.
📈The rest, we leave to the balance of probabilities.
💡Fail to plan. Plan to fail.
🏆It has always been that simple.
❤️Good luck with your trading journey, I shall see you at the very top.
🎯Trade consistent, FRGNT X

GBPCAD LONG FORECAST Q3 W28 Y25GBPCAD LONG FORECAST Q3 W28 Y25
Professional Risk Managers👋
Welcome back to another FRGNT chart update📈
Diving into some Forex setups using predominantly higher time frame order blocks alongside confirmation breaks of structure.
Let’s see what price action is telling us today! 👀
💡Here are some trade confluences📝
✅Daily Order block identified
✅4H Order Block identified
✅1H Order Block identified
🔑 Remember, to participate in trading comes always with a degree of risk, therefore as professional risk managers it remains vital that we stick to our risk management plan as well as our trading strategies.
📈The rest, we leave to the balance of probabilities.
💡Fail to plan. Plan to fail.
🏆It has always been that simple.
❤️Good luck with your trading journey, I shall see you at the very top.
🎯Trade consistent, FRGNT X
