GOLD: Strong Bullish Sentiment! Long!
My dear friends,
Today we will analyse GOLD together☺️
The price is near a wide key level
and the pair is approaching a significant decision level of 3,317.31 Therefore, a strong bullish reaction here could determine the next move up.We will watch for a confirmation candle, and then target the next key level of 3,309.44.Recommend Stop-loss is beyond the current level.
❤️Sending you lots of Love and Hugs❤️
Gann

EURUSD Buyers In Panic! SELL!
My dear friends,
My technical analysis for EURUSD is below:
The market is trading on 1.1775 pivot level.
Bias - Bearish
Technical Indicators: Both Super Trend & Pivot HL indicate a highly probable Bearish continuation.
Target - 1.1648
Recommended Stop Loss - 1.1840
About Used Indicators:
A pivot point is a technical analysis indicator, or calculations, used to determine the overall trend of the market over different time frames.
Disclosure: I am part of Trade Nation's Influencer program and receive a monthly fee for using their TradingView charts in my analysis.
———————————
WISH YOU ALL LUCK

DXY: Bears Are Winning! Short!
My dear friends,
Today we will analyse DXY together☺️
The recent price action suggests a shift in mid-term momentum. A break below the current local range around 96.860 will confirm the new direction downwards with the target being the next key level of 96.760.and a reconvened placement of a stop-loss beyond the range.
❤️Sending you lots of Love and Hugs❤️

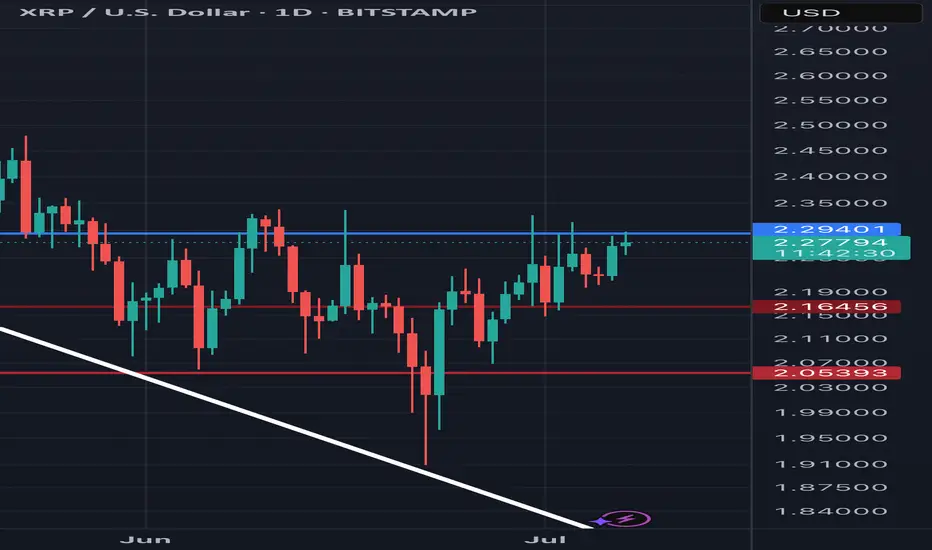
Xrp2.29 is the biggest line we have to cross once broken with some influence the finally push is set .imo
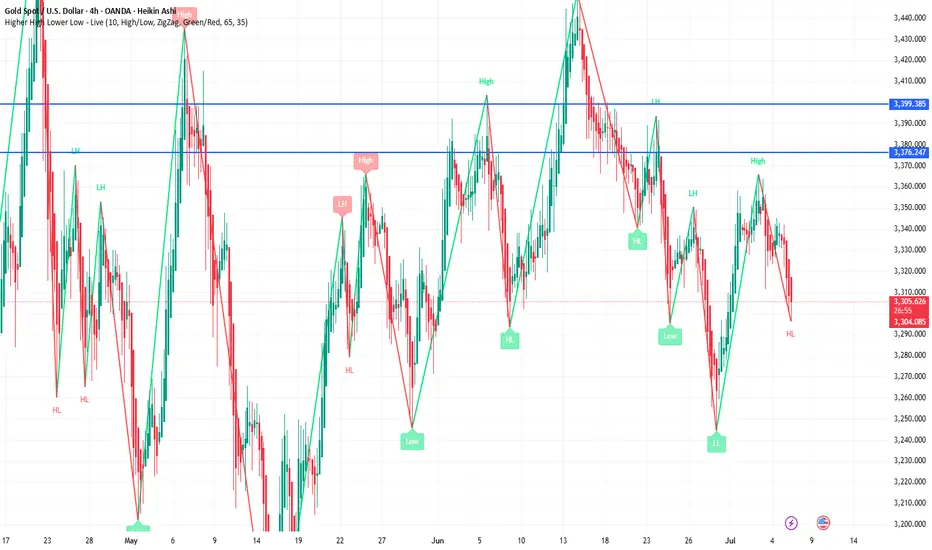
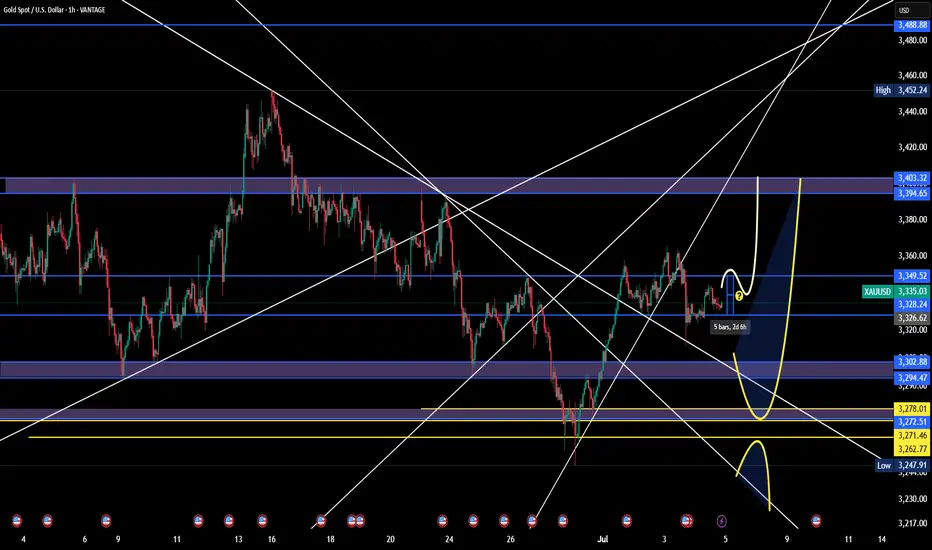
XAUUSD: Market analysis and strategy on July 7Gold technical analysis
Daily chart resistance 3360, support 3270
4-hour chart resistance 3345, support 3280
1-hour chart resistance 3325, support 3300.
3300 is now the short-term long-short dividing line. If it falls below, it will enter a new shock zone. Please pay attention to the 3300 support level before the NY market today! (The resistance level is 3320~3325). From the fundamentals, although the gold market has experienced a technical correction in the short term, gold will continue to maintain its status as a safe-haven asset under the continued uncertainty of US trade policy and complex geopolitical tensions. As Trump's tariff deadline (July 9) approaches, we should pay close attention to the development of US trade policy around August 1 (if the tariff policy is delayed to ease the demand for safe-haven assets, combined with the technical bearish information, gold will continue to find support below 3,300).
SELL: 3300
SELL: 3325

btcusd🚀 What's Next for #Bitcoin? Time’s Ticking...
Frankly, time is running out for Bitcoin to give us that final explosive leg we’ve been waiting for—the one that could take us to $145K before a correction in September, and ultimately reach $165K in early November, driven by pure FOMO.
But right now, what truly matters is the chart, and the chart is speaking loud and clear:
👉 If today's daily close holds above $107,500, and we see a dip to the $105,600 zone tomorrow or Wednesday, that could be the perfect setup to fuel the fire for an epic rally. We're talking about a run toward $112,000 and a breakout to new ATHs.
📈 Let’s be clear: If Bitcoin doesn’t close below $107,500 today, we could skip the dip entirely and go straight up. The bullish trend would remain fully intact, and I’ll be there—waiting for daddy Bitcoin to make its move.
Stay ready. This could get wild. 🧨

Technically is Bearish the chart that I shared on Sunday that prediction was according to fundamentals but now technically we are bearish ... if the until TRUMP announce the terriff may be in NY open... so our PRICE ACTION is right now bearish that sunday's chart is invalid for now

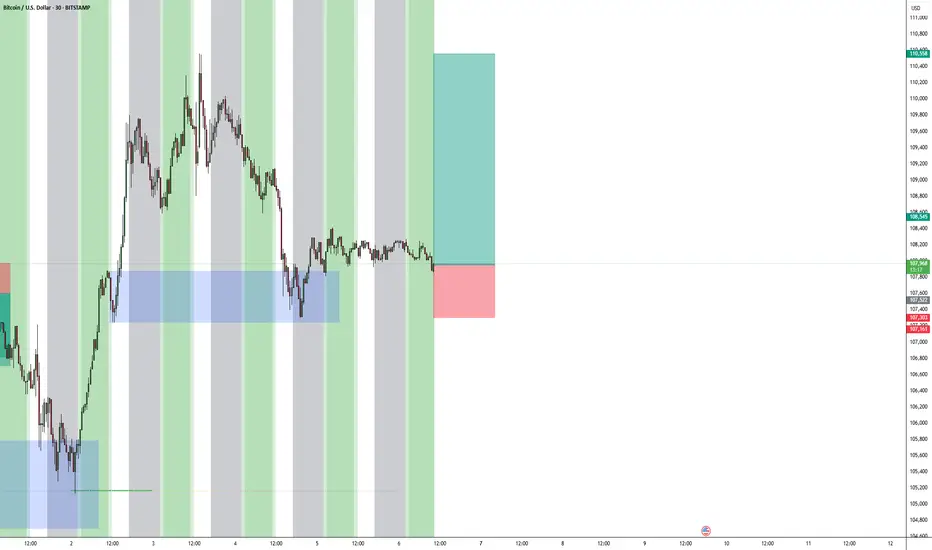
July 4 Bitcoin Bybit chart analysisHello
This is Bitcoin Guide.
If you "follow"
You can receive real-time movement paths and comment notifications on major sections.
If my analysis was helpful,
Please click the booster button at the bottom.
Here is the Bitcoin 30-minute chart.
There is no Nasdaq index announcement today.
There is a possibility that Nasdaq will fall sharply,
but even if it moves sideways, the probability of the strategy succeeding increases.
On the left, with the purple finger,
I connected the 2nd section of the long position that I entered yesterday.
*When the blue finger moves,
Bidirectional neutral
Short->Long or long waiting strategy
1. 109,638.1 dollars short position entry section / cut-off price when orange resistance line is broken
2. 108,764.4 dollars long position switching / cut-off price when green support line is broken
3. 110,273.1 dollars long position 1st target -> target price in order from Miracle
If the strategy is successful, I left a simulation with the pink finger,
so please refer to it.
Those who held long positions yesterday, please check if the purple support line is broken,
If it falls immediately from the current position or
If the pink resistance line is not broken when the 1st section at the top is touched,
It is a vertical decline section,
And if the 109,638.1 dollar short position entry section at the top is not touched,
It is a long waiting strategy at the 2nd section at the bottom.
I think it would be good to think of it as a game in the 1+4 section.
From the 2nd section breakout, I have marked the Bottom -> 3rd section at the bottom.
Up to this point, please just refer to and use my analysis,
I hope you operate safely with principle trading and stop loss prices.
Thank you for your hard work this week.

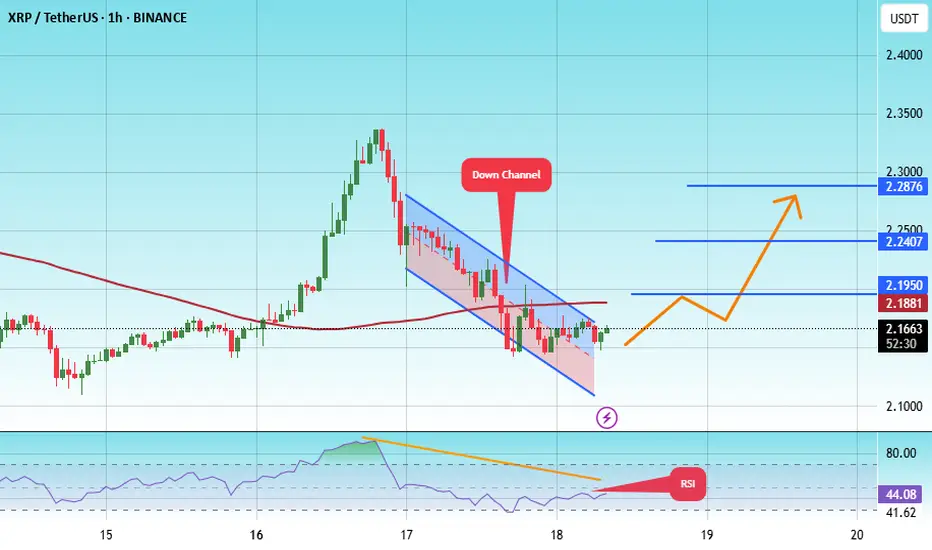
#XRP/USDT#XRP
The price is moving within a descending channel on the 1-hour frame, adhering well to it, and is heading towards a strong breakout and retest.
We are experiencing a rebound from the lower boundary of the descending channel, which is support at 2.11.
We are experiencing a downtrend on the RSI indicator that is about to be broken and retested, supporting the upward trend.
We are looking for stability above the 100 Moving Average.
Entry price: 2.16
First target: 2.20
Second target: 2.24
Third target: 2.28
AUDUSD SHORT & LONG DAILY FORECAST Q3 D7 W28 Y25AUDUSD SHORT & LONG DAILY FORECAST Q3 D7 W28 Y25
Professional Risk Managers👋
Welcome back to another FRGNT chart update📈
Diving into some Forex setups using predominantly higher time frame order blocks alongside confirmation breaks of structure.
Let’s see what price action is telling us today! 👀
💡Here are some trade confluences📝
✅Daily Order block identified
✅4H Order Block identified
✅1H Order Block identified
🔑 Remember, to participate in trading comes always with a degree of risk, therefore as professional risk managers it remains vital that we stick to our risk management plan as well as our trading strategies.
📈The rest, we leave to the balance of probabilities.
💡Fail to plan. Plan to fail.
🏆It has always been that simple.
❤️Good luck with your trading journey, I shall see you at the very top.
🎯Trade consistent, FRGNT X

GOLD-SELL strategy 3D chart GANN SQGOLD may lose its shine, as we observe a clear "negative divergence" whereby rising prices and a declining RSI. We are breaking out of a triangle formation, plus we are negative on fisher and other indicators (not shown).
Strategy SELL @ $ 3,300-3,350 and take profit near $ 2,965 for now.

USDZAR-BUY strategy 3 hourly chartThe pair was not able to move lower, and broke 17.6400 area instead. The issue was negative environment, and a descending wedge warning of move higher over-time. The move lower did not happen within the wedge. Gold also moved lower helping weakening of the ZAR.
Now the picture is near overbought state, but we should keep focus on BUY side lower. I feel maybe near 17.6750 -17.6900 is the buying zone for now.
Strategy BUY @ 17.6450-17.6900 and take profit near 17.8250 for now.

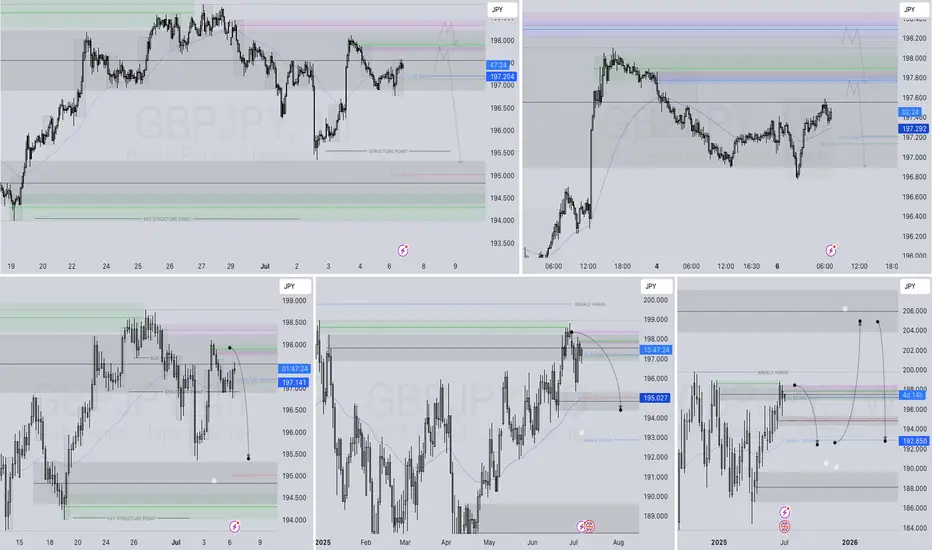
GBPJPY SHORT DAILY FORECAST Q3 D7 W28 Y25GBPJPY SHORT DAILY FORECAST Q3 D7 W28 Y25
Professional Risk Managers👋
Welcome back to another FRGNT chart update📈
Diving into some Forex setups using predominantly higher time frame order blocks alongside confirmation breaks of structure.
Let’s see what price action is telling us today! 👀
💡Here are some trade confluences📝
✅Daily Order block identified
✅4H Order Block identified
✅1H Order Block identified
🔑 Remember, to participate in trading comes always with a degree of risk, therefore as professional risk managers it remains vital that we stick to our risk management plan as well as our trading strategies.
📈The rest, we leave to the balance of probabilities.
💡Fail to plan. Plan to fail.
🏆It has always been that simple.
❤️Good luck with your trading journey, I shall see you at the very top.
🎯Trade consistent, FRGNT X
EURCHF LONG DAILY FORECAST Q3 D7 W28 Y25EURCHF LONG DAILY FORECAST Q3 D7 W28 Y25
Professional Risk Managers👋
Welcome back to another FRGNT chart update📈
Diving into some Forex setups using predominantly higher time frame order blocks alongside confirmation breaks of structure.
Let’s see what price action is telling us today! 👀
💡Here are some trade confluences📝
✅Daily Order block identified
✅4H Order Block identified
✅1H Order Block identified
🔑 Remember, to participate in trading comes always with a degree of risk, therefore as professional risk managers it remains vital that we stick to our risk management plan as well as our trading strategies.
📈The rest, we leave to the balance of probabilities.
💡Fail to plan. Plan to fail.
🏆It has always been that simple.
❤️Good luck with your trading journey, I shall see you at the very top.
🎯Trade consistent, FRGNT X

Buy Trade Strategy for BONK: Exploring Solana's Meme PowerDescription:
This trading idea highlights BONK, a meme-based cryptocurrency built on the fast and low-cost Solana blockchain. As one of the first major meme tokens in the Solana ecosystem, BONK has captured the attention of retail investors and traders, driven by a strong community, viral marketing, and integration into Solana-based dApps. Its tokenomics support deflationary mechanics and wide distribution, helping fuel adoption and engagement. BONK also benefits from Solana’s scalability, making transactions fast and cheap, an attractive feature for speculative and high-frequency trading environments.
Despite its playful branding, investing in meme tokens like BONK carries a high level of risk due to their reliance on social sentiment, market trends, and community hype. Their price movements can be extremely volatile and unpredictable, often lacking the stability of fundamentally-backed assets.
Disclaimer:
This trading idea is for educational purposes only and should not be taken as financial advice. Meme cryptocurrencies such as BONK are speculative and involve substantial risk, including the potential for total capital loss. Always do your own research, understand your risk tolerance, and seek guidance from a financial advisor before making any investment decisions. Past performance does not guarantee future results.

BTCUSDT short-term analysishi traders
Let's have a look at BTC on 4h time frame.
RSI (14): Currently at 60.40, suggesting mild bullish momentum but not overbought.
RSI Moving Average: Around 50.92, confirming recent upward momentum.
MACD bullish cross suggest more upside in a short term.
Breakout Confirmation: Price has broken above a recent horizontal resistance (near $109,236), now acting as support.
Bullish Continuation Expected
Support & Resistance:
New Support: $109,236
Resistance to Break: Around $111,742
✅ Conclusion:
This is a bullish breakout trade based on horizontal support/resistance, favorable RSI, and a clear RR setup. The trader anticipates a pullback and continuation toward $111.7K, using a tight stop just below the breakout zone to minimize risk.


USDZAR-SELL strategy 6 hourly chartThere is selling pressure within a descending wedge, which means over-time we will see recovery. For now though short-term time frames are negative and likely we may see 17.4500 test.
Strategy SELL @ 17.5500-17.5975 and take profit near 17.4500.

ETHUSD: Next Move Is Down! Short!
My dear friends,
Today we will analyse ETHUSD together☺️
The in-trend continuation seems likely as the current long-term trend appears to be strong, and price is holding below a key level of 2,514.4 So a bearish continuation seems plausible, targeting the next low. We should enter on confirmation, and place a stop-loss beyond the recent swing level.
❤️Sending you lots of Love and Hugs❤️

BTCUSD: Target Is Up! Long!
My dear friends,
Today we will analyse BTCUSD together☺️
The market is at an inflection zone and price has now reached an area around 108,067 where previous reversals or breakouts have occurred.And a price reaction that we are seeing on multiple timeframes here could signal the next move up so we can enter on confirmation, and target the next key level of 108,140. Stop-loss is recommended beyond the inflection zone.
❤️Sending you lots of Love and Hugs❤️
