GOLD: Strong Bearish Sentiment! Short!
My dear friends,
Today we will analyse GOLD together☺️
The in-trend continuation seems likely as the current long-term trend appears to be strong, and price is holding below a key level of 3,341.44 So a bearish continuation seems plausible, targeting the next low. We should enter on confirmation, and place a stop-loss beyond the recent swing level.
❤️Sending you lots of Love and Hugs❤️
Gann

XAUUSD: Market analysis and strategy on July 2Gold technical analysis
Daily chart resistance 3400, support 3250
4-hour chart resistance 3355, support 3300
1-hour chart resistance 3345, support 3325
After gold adjusted to 3247, bulls launched a counterattack. This position is the 0.618 support from 3121 to 3451. It rose by $100 in two trading days. Bulls are still strong. Although the war is sometimes tense and sometimes relieved, the global geopolitical environment and economic environment are continuously getting worse step by step. This support logic has never changed. Even if it is temporarily relieved, gold will usher in a correction, but it is only a correction. Overall, the fundamental logic of the bull market has not changed.
Gold price reached 3358 and then fell back. Today, it fell below 3336 and continued to fall. The support point below is around 3325/3310. It continues to rise after the fall. It is necessary to pay attention to the specific point where it will stop falling and stabilize during the trading session. As far as the current market is concerned, it hit 3328 today to stop falling and rebound, and temporarily held the support position of 3325. It is bullish based on this position. There are ADP data today and NFP data tomorrow. Pay attention to the impact after the data is released.
BUY:3330near
BUY:3300near

ICTTrading foreign currencies can be a challenging and potentially profitable opportunity for investors. However, before deciding to participate in the Forex market, you should carefully consider your investment objectives, level of experience, and risk appetite. Most importantly, do not invest money you cannot afford to lose.
There is considerable exposure to risk in any foreign exchange transaction. Any transaction involving currencies involves risks including, but not limited to, the potential for changing political and/or economic conditions that may substantially affect the price or liquidity of a currency. Investments in foreign exchange speculation may also be susceptible to sharp rises and falls as the relevant market values fluctuate. The leveraged nature of Forex trading means that any market movement will have an equally proportional effect on your deposited funds. This may work against you as well as for you. Not only may investors get back less than they invested, but in the case of higher risk strategies, investors may lose the entirety of their investment. It is for this reason that when speculating in such markets it is advisa

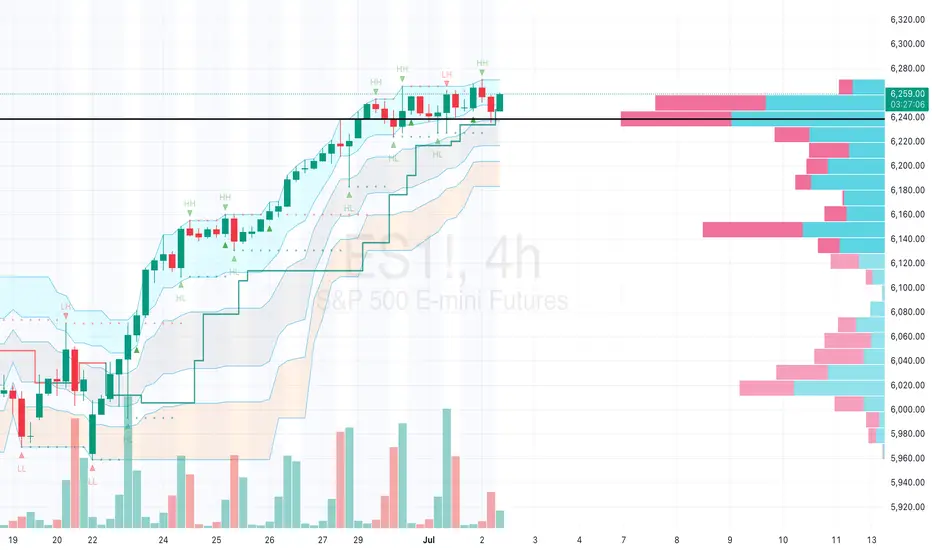
S&P 500 E-Mini Futures (ES) Market AnalysisKey Observations
The S&P 500 E-Mini Futures (ES) is currently trading at 6,240.00, with a high of 6,259.00 and a low of 6,244.75, based on the 4-hour chart provided.
The price is approaching a significant resistance level around 6,240–6,259, where recent selling pressure is evident from the volume profile.
The market has shown a strong upward trend, with higher highs (HH) and higher lows (HL) forming since the last major low near 6,020, but momentum appears to be slowing.
Technical Analysis
Price Action: The chart indicates a consolidation phase near the current level of 6,240.00, following a rally from the support zone around 6,020–6,040. The recent red candles suggest a potential reversal or pause in the uptrend.
Volume Profile: The right-hand volume profile shows high volume nodes (HVNs) between 6,180 and 6,240, with the point of control (POC) near 6,220–6,240. This indicates strong trader interest and a potential support/resistance zone. The pink bars (selling volume) dominate above 6,240, signaling rejection at higher levels.
Support and Resistance:
Support: 6,220–6,240 (POC), with a deeper support at 6,180–6,200 if the price breaks lower.
Resistance: 6,259 (recent high), with a psychological barrier at 6,300 if bullish momentum resumes.
Indicators: The chart includes Market Profile levels (e.g., HH, HL, LH, LL), suggesting a structured approach to identifying value areas. The flattening of the value area suggests a lack of directional conviction at present.
Market Context
The ES has been influenced by mixed economic data, including the June 2025 ADP employment report, which reported a loss of 33,000 jobs, signaling potential economic slowdown. This could pressure equity markets, including the S&P 500.
The upcoming Nonfarm Payrolls report on July 03, 2025, is a critical event. A weaker-than-expected result (forecasted at 110,000 jobs) could increase bearish pressure, while a strong report might push the ES toward new highs.
Recent market performance (e.g., NASDAQ 100 weakness due to Tesla news) may also be impacting the broader index, though the S&P 500 has shown relative resilience.
GBPJPY SHORT DAILY FORECAST Q3 D2 W27 Y25GBPJPY SHORT DAILY FORECAST Q3 D2 W27 Y25
Professional Risk Managers👋
Welcome back to another FRGNT chart update📈
Diving into some Forex setups using predominantly higher time frame order blocks alongside confirmation breaks of structure.
Let’s see what price action is telling us today! 👀
💡Here are some trade confluences📝
✅Daily Order block identified
✅4H Order Block identified
✅1H Order Block identified
🔑 Remember, to participate in trading comes always with a degree of risk, therefore as professional risk managers it remains vital that we stick to our risk management plan as well as our trading strategies.
📈The rest, we leave to the balance of probabilities.
💡Fail to plan. Plan to fail.
🏆It has always been that simple.
❤️Good luck with your trading journey, I shall see you at the very top.
🎯Trade consistent, FRGNT X

Bulls and Bears Zone for 07-02-2025S&P keeps going higher after new ATH high earlier this week. Markets could go higher for a while if we see any pullback.
Level to watch: 6232 ---6234

GBPUSD-SELL strategy 6 hourly chart Reg.ChannelThe pair is overbought considering the longer time frames. we are still positive on indicators short-term, so we seek a SELL level rather than rushing in.
Strategy SELL @ 1.3760-1.3790 and take profit near 1.3617.

USDZAR-BUY strategy 3 hourly chart Reg., ChannelIt feels we are in a slight buying mode today. The indicators are somewhat positive, and we have made some ground before.
Strategy BY @ 17.5875-17.6350 and take profit near 17.7875

USDCAD LONG DAILY FORECAST Q3 D2 W27 Y25USDCAD LONG DAILY FORECAST Q3 D2 W27 Y25
Professional Risk Managers👋
Welcome back to another FRGNT chart update📈
Diving into some Forex setups using predominantly higher time frame order blocks alongside confirmation breaks of structure.
Let’s see what price action is telling us today! 👀
💡Here are some trade confluences📝
✅Daily Order block identified
✅4H Order Block identified
✅1H Order Block identified
🔑 Remember, to participate in trading comes always with a degree of risk, therefore as professional risk managers it remains vital that we stick to our risk management plan as well as our trading strategies.
📈The rest, we leave to the balance of probabilities.
💡Fail to plan. Plan to fail.
🏆It has always been that simple.
❤️Good luck with your trading journey, I shall see you at the very top.
🎯Trade consistent, FRGNT X

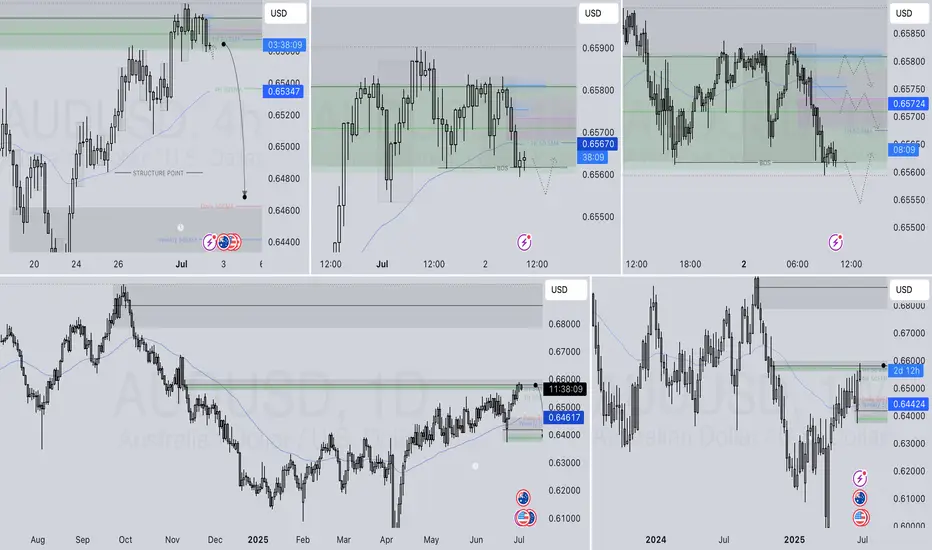
AUDUSD SHORT DAILY FORECAST Q3 D2 W27 Y25AUDUSD SHORT DAILY FORECAST Q3 D2 W27 Y25
Professional Risk Managers👋
Welcome back to another FRGNT chart update📈
Diving into some Forex setups using predominantly higher time frame order blocks alongside confirmation breaks of structure.
Let’s see what price action is telling us today! 👀
💡Here are some trade confluences📝
✅Daily Order block identified
✅4H Order Block identified
✅1H Order Block identified
🔑 Remember, to participate in trading comes always with a degree of risk, therefore as professional risk managers it remains vital that we stick to our risk management plan as well as our trading strategies.
📈The rest, we leave to the balance of probabilities.
💡Fail to plan. Plan to fail.
🏆It has always been that simple.
❤️Good luck with your trading journey, I shall see you at the very top.
🎯Trade consistent, FRGNT X
Gold prices have risen sharply. How should we trade gold?
📣Gold news:
US Senate passes Trump tax reform bill. Trump wins major victory
Trump's signature tax and spending cuts bill passed the Senate on Tuesday. Republican leaders finally convinced dissenting lawmakers after a hard fight, helping Trump win another political victory.
Trump refuses to extend July 9 tariff deadline
US President Trump reiterated on Tuesday that he has no intention of extending the 90-day suspension of reciprocal tariffs on most countries after it expires on July 9.
When asked whether he would extend the suspension of tariffs, Trump replied on Air Force One: "No, I haven't thought about it. I will write to many countries to notify them of the tariff rates they will face."
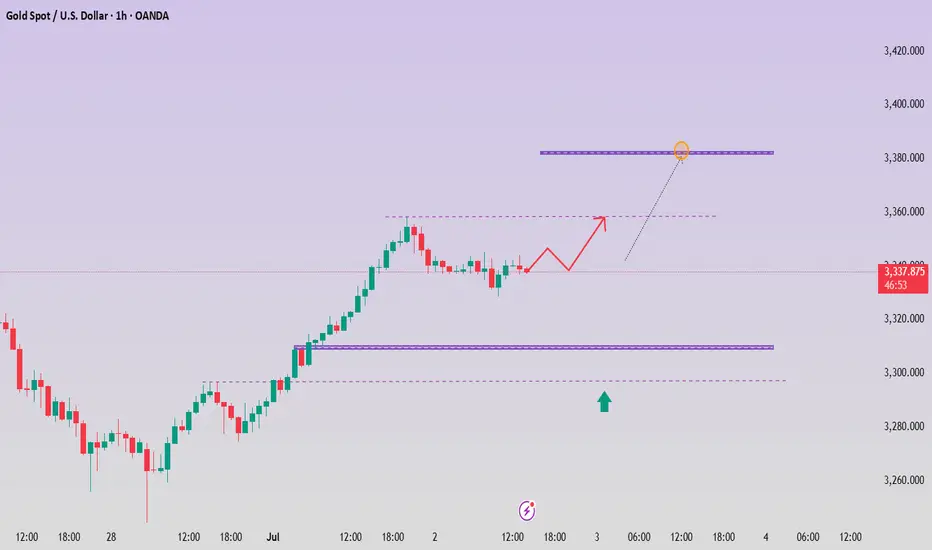
Gold (XAU/USD) struggled to extend its two-day rally, fluctuating narrowly in the Asian session on Wednesday, just below Tuesday's one-week high. The dollar's slight rebound - from its lowest level since February 2022 - put pressure on gold. Moreover, improving market sentiment continues to weaken demand for safe-haven assets such as gold, further limiting its upside.
⭐️Technical Analysis:
Trend lines are steadily picking up, and continued buying could move towards 3383 based on today's ADP-NF data
💰Set Gold Price:
💰Sell Gold Zone: 3375-3385 SL 3395
TP1: $3370
TP2: $3360
TP3: $3350
💰Buy Gold Zone: $3315-$3310 SL $3305
TP1: $3320
TP2: $3330
TP3: $3340
⭐️Technical Analysis:
Set reasonable buy orders based on technical indicators EMA 34, EMA89 and support resistance areas.
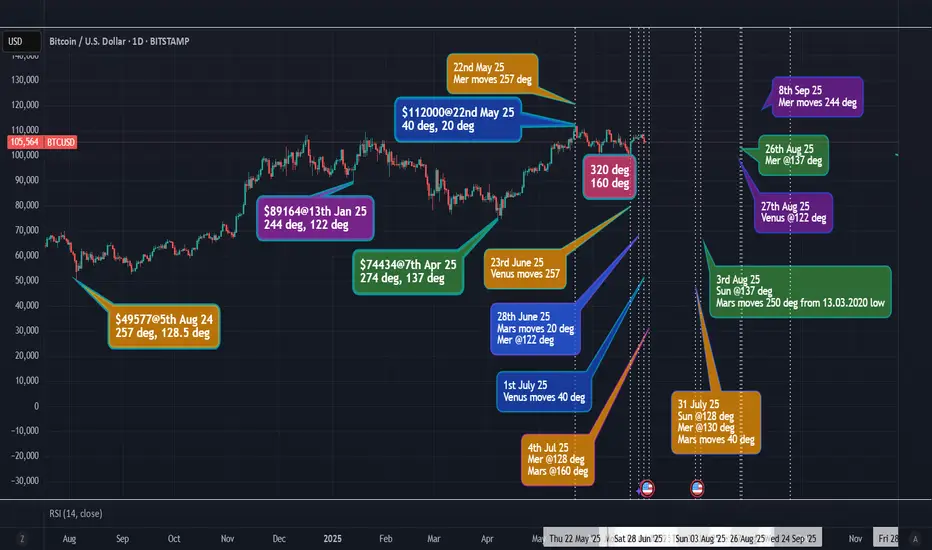
BTC - change in trend - GANN's price = planetary long/movesThis is based on GANN's price squaring planetary longitude and planetary movements. The color-coding is to match the price in degree with the expected future dates for change in trend marked on the chart.

#Ondo Finance this is a possible scenario of how #ondo could play out this cycle if all goes well…. Not financial advice DCA safely

EURAUD I Monday CLS I Model 2 I Double TOP LQHey, Market Warriors, here is another outlook on this instrument
If you’ve been following me, you already know every setup you see is built around a CLS Footprint, a Key Level, Liquidity and a specific execution model.
If you haven't followed me yet, start now.
My trading system is completely mechanical — designed to remove emotions, opinions, and impulsive decisions. No messy diagonal lines. No random drawings. Just clarity, structure, and execution.
🧩 What is CLS?
CLS is real smart money — the combined power of major investment banks and central banks moving over 6.5 trillion dollars a day. Understanding their operations is key to markets.
✅ Understanding the behavior of CLS allows you to position yourself with the giants during the market manipulations — leading to buying lows and selling highs - cleaner entries, clearer exits, and consistent profits.
📍 Model 1
is right after the manipulation of the CLS candle when CIOD occurs, and we are targeting 50% of the CLS range. H4 CLS ranges supported by HTF go straight to the opposing range.
"Adapt what is useful, reject what is useless, and add what is specifically your own."
— David Perk aka Dave FX Hunter ⚔️
👍 Hit like if you find this analysis helpful, and don't hesitate to comment with your opinions, charts or any questions.

EURGBP Market Structure Analysis on 4H and M15 Timeframes4H swing is bearish => current is pullback
M15 swing is bullish
We can look for short selling opportunities if the bottom of M15 is broken

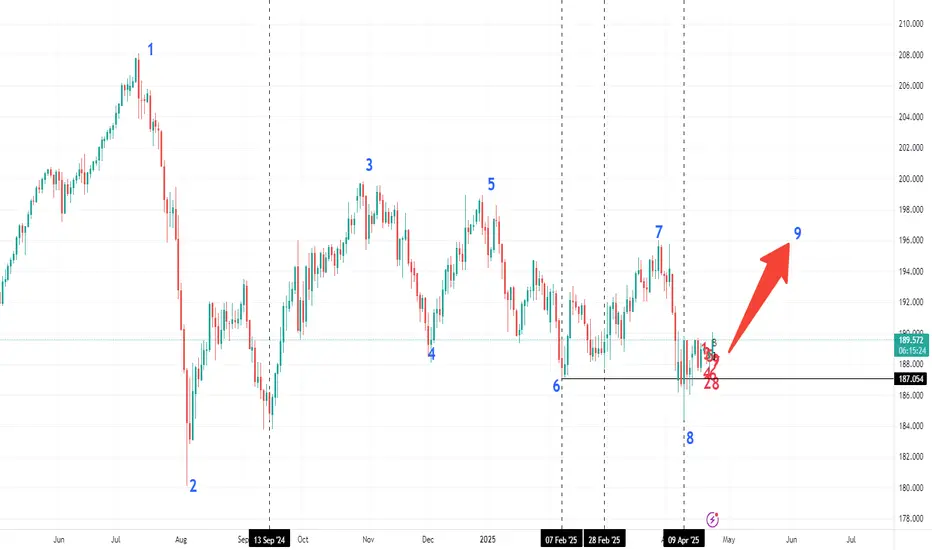
XAUUSD MONTHLY/WEEKLY ANALYSISWhat we’re seeing here on **XAUUSD (Gold Spot)** is a **classic higher-timeframe accumulation pattern** followed by **a potential explosive bullish leg**.
After a strong move up in April, we witnessed a **textbook V-reversal**, consolidation, and now — **a higher low** forming around the \$3,290 zone. That’s our key demand level. 💥
✅ If this higher low holds and price starts pushing with volume, we may be gearing up for a **multi-phase breakout** with the following potential targets:
🔹 **Target 1:** \$3,500
🔹 **Target 2:** \$3,694
🔹 **Target 3:** \$3,902
🎯 **Final Target:** \$4,101+
This isn’t just a short-term scalp setup. This is a **position trade opportunity** for those with patience and precision. The structure is clean, momentum is returning, and the levels are marked.

aapl just got great news, great stock! ATH coming?? YEA???aapl just got great news, great stock!
bullish. so very bullish
let us know!
free transparent no edit no delete
🐉We value full transparency. All wins and fails fully publicized, zero edit, zero delete, zero fakes.🐉
🐉Check out our socials for some nice insights.🐉
information created and published doesn't constitute investment advice!
NOT financial advice

EURCHF LONG DAILY FORECAST Q3 D1 W27 Y25EURCHF LONG DAILY FORECAST Q3 D1 W27 Y25
Professional Risk Managers👋
Welcome back to another FRGNT chart update📈
Diving into some Forex setups using predominantly higher time frame order blocks alongside confirmation breaks of structure.
Let’s see what price action is telling us today! 👀
💡Here are some trade confluences📝
✅Daily Order block identified
✅4H Order Block identified
✅1H Order Block identified
🔑 Remember, to participate in trading comes always with a degree of risk, therefore as professional risk managers it remains vital that we stick to our risk management plan as well as our trading strategies.
📈The rest, we leave to the balance of probabilities.
💡Fail to plan. Plan to fail.
🏆It has always been that simple.
❤️Good luck with your trading journey, I shall see you at the very top.
🎯Trade consistent, FRGNT X

US30: Bears Are Winning! Short!
My dear friends,
Today we will analyse US30 together☺️
The market is at an inflection zone and price has now reached an area around 44,041.6 where previous reversals or breakouts have occurred.And a price reaction that we are seeing on multiple timeframes here could signal the next move down so we can enter on confirmation, and target the next key level of 44,013.0..Stop-loss is recommended beyond the inflection zone.
❤️Sending you lots of Love and Hugs❤️

GOLD: Next Move Is Up! Long!
My dear friends,
Today we will analyse GOLD together☺️
The price is near a wide key level
and the pair is approaching a significant decision level of 3,346.90 Therefore, a strong bullish reaction here could determine the next move up.We will watch for a confirmation candle, and then target the next key level of 3,365.74.Recommend Stop-loss is beyond the current level.
❤️Sending you lots of Love and Hugs❤️

EURUSD: Target Is Up! Long!
My dear friends,
Today we will analyse EURUSD together☺️
The recent price action suggests a shift in mid-term momentum. A break above the current local range around 1.18033 will confirm the new direction upwards with the target being the next key level of 1.18161 and a reconvened placement of a stop-loss beyond the range.
❤️Sending you lots of Love and Hugs❤️
