ENTRY EURGBPDisclaimer:
This is merely a chart-based analytical trading idea and is not considered investment advice. Please manage your risks carefully and conduct your own research before making any trading decisions.
Gann
US500 Short Setup: Bearish Momentum Toward 6205Currently holding a short position on the US500 from the 6358 level, based on Smart Money Concepts. Price has tapped into a premium zone within a higher time frame supply area, showing clear signs of distribution. Liquidity has been swept above recent highs, and a shift in market structure confirms bearish intent. I’m targeting the 6205 level, expecting a rapid downside move in the very short term as smart money drives price toward discounted levels.

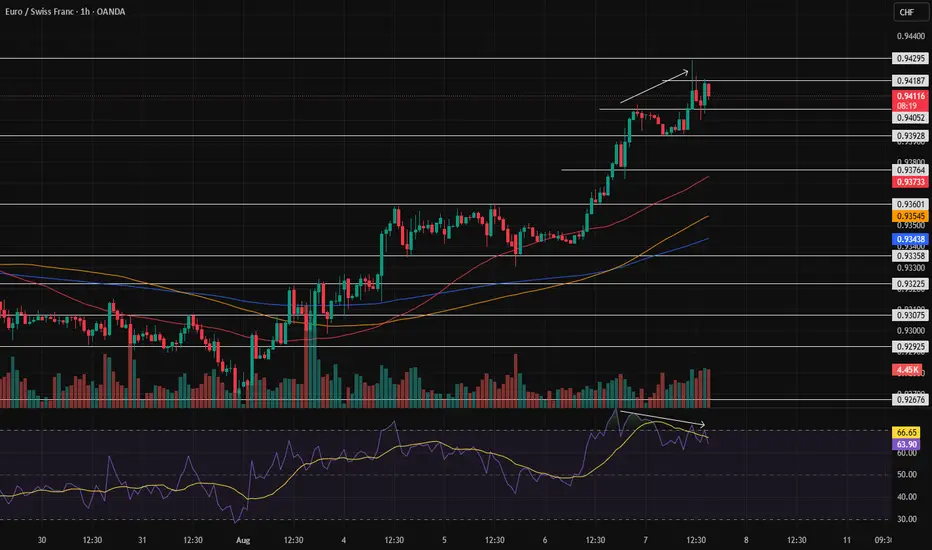
EURCHF – DAILY FORECAST Q3 | W32 | D8 | Y25📊 EURCHF – DAILY FORECAST
Q3 | W32 | D8 | Y25
Daily Forecast 🔍📅
Here’s a short diagnosis of the current chart setup 🧠📈
Higher time frame order blocks have been identified — these are our patient points of interest 🎯🧭.
It’s crucial to wait for a confirmed break of structure 🧱✅ before forming a directional bias.
This keeps us disciplined and aligned with what price action is truly telling us.
📈 Risk Management Protocols
🔑 Core principles:
Max 1% risk per trade
Only execute at pre-identified levels
Use alerts, not emotion
Stick to your RR plan — minimum 1:2
🧠 You’re not paid for how many trades you take, you’re paid for how well you manage risk.
🧠 Weekly FRGNT Insight
"Trade what the market gives, not what your ego wants."
Stay mechanical. Stay focused. Let the probabilities work.
FX:EURCHF

EURUSD – DAILY FORECAST Q3 | W32 | D8 | Y25📊 EURUSD – DAILY FORECAST
Q3 | W32 | D8 | Y25
Daily Forecast 🔍📅
Here’s a short diagnosis of the current chart setup 🧠📈
Higher time frame order blocks have been identified — these are our patient points of interest 🎯🧭.
It’s crucial to wait for a confirmed break of structure 🧱✅ before forming a directional bias.
This keeps us disciplined and aligned with what price action is truly telling us.
📈 Risk Management Protocols
🔑 Core principles:
Max 1% risk per trade
Only execute at pre-identified levels
Use alerts, not emotion
Stick to your RR plan — minimum 1:2
🧠 You’re not paid for how many trades you take, you’re paid for how well you manage risk.
🧠 Weekly FRGNT Insight
"Trade what the market gives, not what your ego wants."
Stay mechanical. Stay focused. Let the probabilities work.
FX:EURUSD

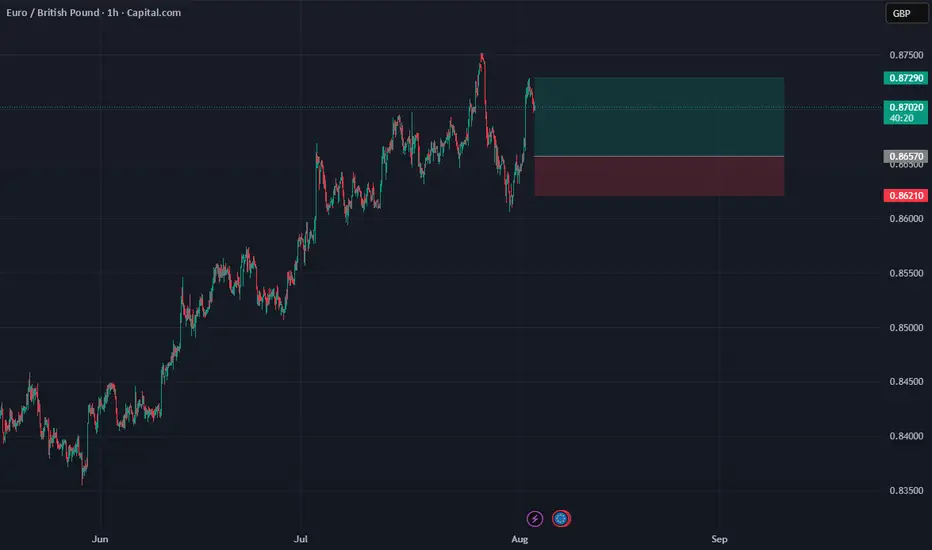
EURGBP – DAILY FORECAST Q3 | W32 | D8 | Y25📊 EURGBP – DAILY FORECAST
Q3 | W32 | D8 | Y25
Daily Forecast 🔍📅
Here’s a short diagnosis of the current chart setup 🧠📈
Higher time frame order blocks have been identified — these are our patient points of interest 🎯🧭.
It’s crucial to wait for a confirmed break of structure 🧱✅ before forming a directional bias.
This keeps us disciplined and aligned with what price action is truly telling us.
📈 Risk Management Protocols
🔑 Core principles:
Max 1% risk per trade
Only execute at pre-identified levels
Use alerts, not emotion
Stick to your RR plan — minimum 1:2
🧠 You’re not paid for how many trades you take, you’re paid for how well you manage risk.
🧠 Weekly FRGNT Insight
"Trade what the market gives, not what your ego wants."
Stay mechanical. Stay focused. Let the probabilities work.
FX:EURGBP

GBPUSD – DAILY FORECAST Q3 | W32 | D8 | Y25📊 GBPUSD – DAILY FORECAST
Q3 | W32 | D8 | Y25
Daily Forecast 🔍📅
Here’s a short diagnosis of the current chart setup 🧠📈
Higher time frame order blocks have been identified — these are our patient points of interest 🎯🧭.
It’s crucial to wait for a confirmed break of structure 🧱✅ before forming a directional bias.
This keeps us disciplined and aligned with what price action is truly telling us.
📈 Risk Management Protocols
🔑 Core principles:
Max 1% risk per trade
Only execute at pre-identified levels
Use alerts, not emotion
Stick to your RR plan — minimum 1:2
🧠 You’re not paid for how many trades you take, you’re paid for how well you manage risk.
🧠 Weekly FRGNT Insight
"Trade what the market gives, not what your ego wants."
Stay mechanical. Stay focused. Let the probabilities work.
FX:GBPUSD

XAUUSD GOLD H1 ANALYSIS BUY NOW 3365 XAUUSD (Gold) Trade Update:
Gold is currently a buy at 3365, with an upside target of 3420. The support area is at 3348, while the resistance is seen around 3380. Traders who have been following my analysis are advised to hold their positions strongly and stay confident in the setup. This move aligns with the ongoing bullish momentum, so stay focused and manage your trades accordingly.

Buy Trade Strategy for LINK: Driving Smart Contract ConnectivityDescription:
This trading idea focuses on LINK, the native token of the Chainlink network, a leading decentralized oracle solution that connects smart contracts with real-world data. LINK plays a critical role in enabling secure, reliable, and tamper-proof data feeds for DeFi, NFTs, gaming, and enterprise blockchain applications. As blockchain adoption accelerates, Chainlink’s expanding integrations and partnerships strengthen its position as the go-to oracle provider. The growing demand for accurate off-chain data in on-chain environments continues to support LINK’s long-term value proposition.
That said, the cryptocurrency market is highly volatile and influenced by factors such as regulatory changes, technological developments, and market sentiment. Investors should approach LINK with a clear strategy and strong risk management practices.
Disclaimer:
This trading idea is for educational purposes only and does not constitute financial advice. Cryptocurrencies like LINK carry substantial risks, including the possibility of losing your entire investment. Always perform your own research, assess your financial situation, and consult with a licensed financial advisor before making any investment decision. Past performance is not indicative of future results.

GBPJPY SELL SWEET SETUP SHOOOOOOOOOOOOORT HHHHHHHHHI think we should research selling opportunity
because we have uptrend line has broken and tested
and we have bearish channel and the price reflect from resistance on time frame 1W
SO SHORTLY i will sell Especially since we have a rebound from the imbalance as well.
Look at this picture as it makes it clearer to you

Buy Trade Strategy for MNT: Backing a Scalable Web3 FutureDescription:
This trading idea focuses on MNT, the native token of the Mantle Network, a modular Ethereum Layer 2 solution designed to offer scalability without compromising security or decentralization. MNT plays a central role in securing the network, paying transaction fees, and participating in governance. Mantle’s architecture separates execution from data availability and consensus, which enhances performance and cost-efficiency—key factors in supporting next-generation Web3 applications. As the demand for efficient and scalable Ethereum solutions grows, MNT stands out with its innovative structure, strong backing by BitDAO, and an expanding developer ecosystem.
That said, it’s crucial to be aware of the high volatility and inherent risks in the crypto market. Regulatory updates, macroeconomic events, and investor sentiment can strongly impact **MNT**'s price performance. Therefore, sound risk management is essential.
Disclaimer:
This trading idea is for educational purposes only and should not be considered financial advice. Trading cryptocurrencies such as MNT involves a high degree of risk, including the potential loss of your entire investment. Always conduct independent research, evaluate your financial situation, and consult a financial advisor before making any investment decisions. Past performance does not guarantee future results.

ENTRY EURUSDDisclaimer:
This is merely a chart-based analytical trading idea and is not considered investment advice. Please manage your risks carefully and conduct your own research before making any trading decisions.

ENTRY USDJPYDisclaimer:
This is merely a chart-based analytical trading idea and is not considered investment advice. Please manage your risks carefully and conduct your own research before making any trading decisions.

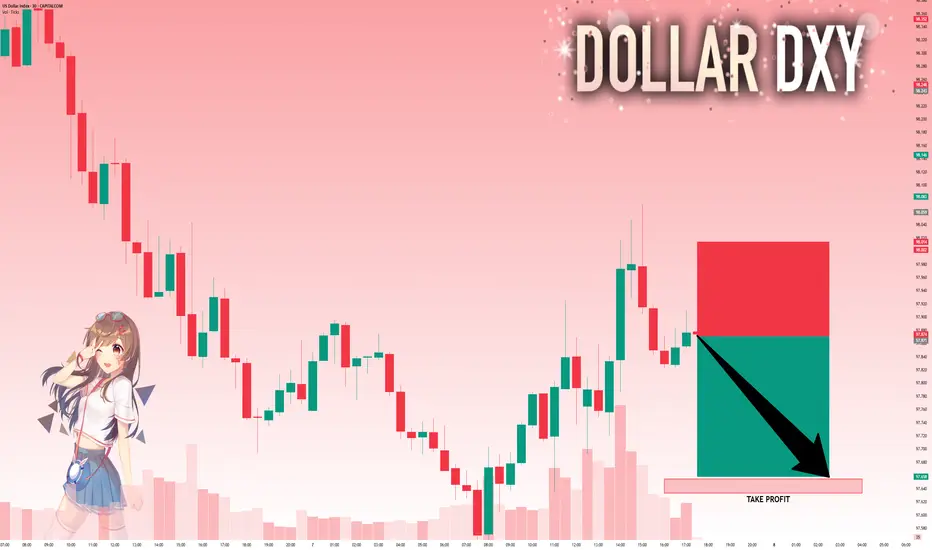
DXY: Absolute Price Collapse Ahead! Short!
My dear friends,
Today we will analyse DXY together☺️
The in-trend continuation seems likely as the current long-term trend appears to be strong, and price is holding below a key level of 97.871 So a bearish continuation seems plausible, targeting the next low. We should enter on confirmation, and place a stop-loss beyond the recent swing level.
❤️Sending you lots of Love and Hugs❤️
EURUSD Long FX:EURUSD Long trade, with my back testing of this strategy, it hits multiple possible take profits, manage your position accordingly.
This is good trade, don't overload your risk like greedy, be disciplined trader, this is good trade.
Use proper risk management
Looks like good trade.
Lets monitor.
Use proper risk management.

EURUSD: Will Go Up! Long!
My dear friends,
Today we will analyse EURUSD together☺️
The market is at an inflection zone and price has now reached an area around 1.16337 where previous reversals or breakouts have occurred.And a price reaction that we are seeing on multiple timeframes here could signal the next move up so we can enter on confirmation, and target the next key level of 1.16551.Stop-loss is recommended beyond the inflection zone.
❤️Sending you lots of Love and Hugs❤️

GOLD: The Market Is Looking Up! Long!
My dear friends,
Today we will analyse GOLD together☺️
The price is near a wide key level
and the pair is approaching a significant decision level of 3,386.96 Therefore, a strong bullish reaction here could determine the next move up.We will watch for a confirmation candle, and then target the next key level of 3,397.99.Recommend Stop-loss is beyond the current level.
❤️Sending you lots of Love and Hugs❤️

SILVER: Strong Bearish Sentiment! Short!
My dear friends,
Today we will analyse SILVER together☺️
The recent price action suggests a shift in mid-term momentum. A break below the current local range around 38.167 will confirm the new direction downwards with the target being the next key level of 37.993.and a reconvened placement of a stop-loss beyond the range.
❤️Sending you lots of Love and Hugs❤️

EUR/CAD is falling.What I see in EUR/CAD across multiple timeframes confirms that a bearish trend has begun.
Therefore, I have entered a sell position from the marked zone.
The target is the specified area, with an expected drop of approximately 3.5% or around 530 pips.

TIme Equal PriceAs I shared before about the next movement of gold and how the price at that time 3350 is important and will aim till 3400 you can see who accurate is the price with respect to time , no wonder

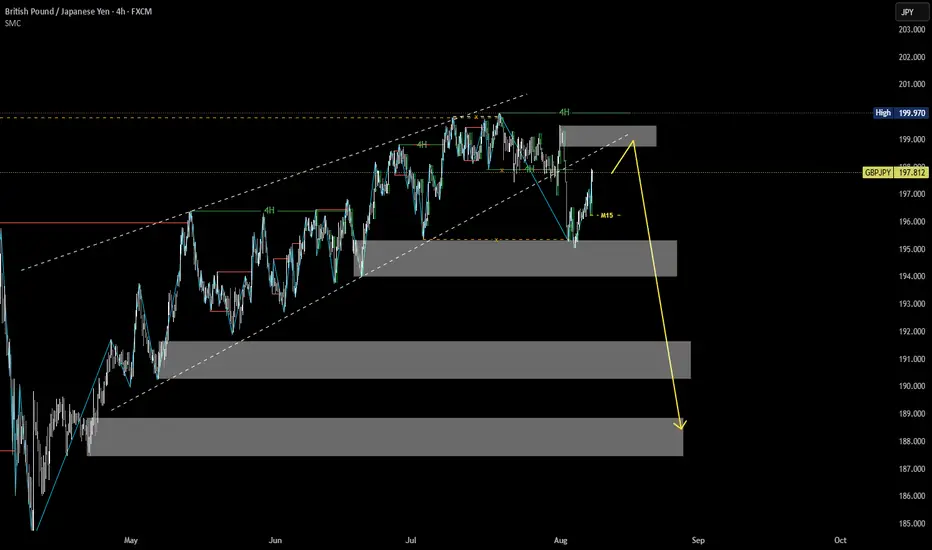
Market Structure Analysis of GBPJPY on the 4H TimeframeMulti-Timeframe Context (HTF: 4H, LTF: M15)
The main trend on the 4H chart is bearish.
Price is currently in a retracement phase (pullback).
On the M15, price is in a bullish short-term structure.
We monitor the M15 market structure closely to look for signs of weakness and identify high-probability short entries in alignment with the 4H downtrend.
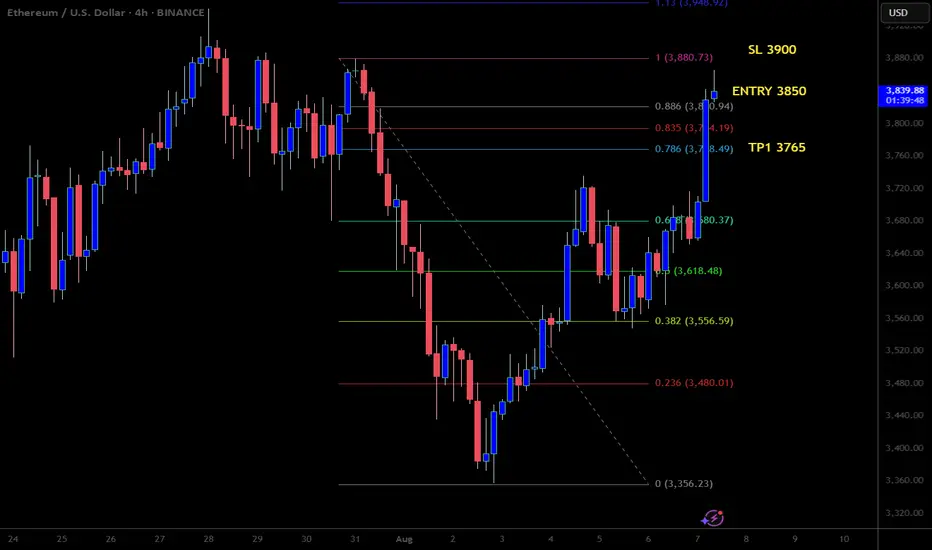
ETHUSD scalp sellLooking for a quick sell here. This also give us added confirmation on our previous eth sell swing trade from the previous analysis on the weekly timeframe.
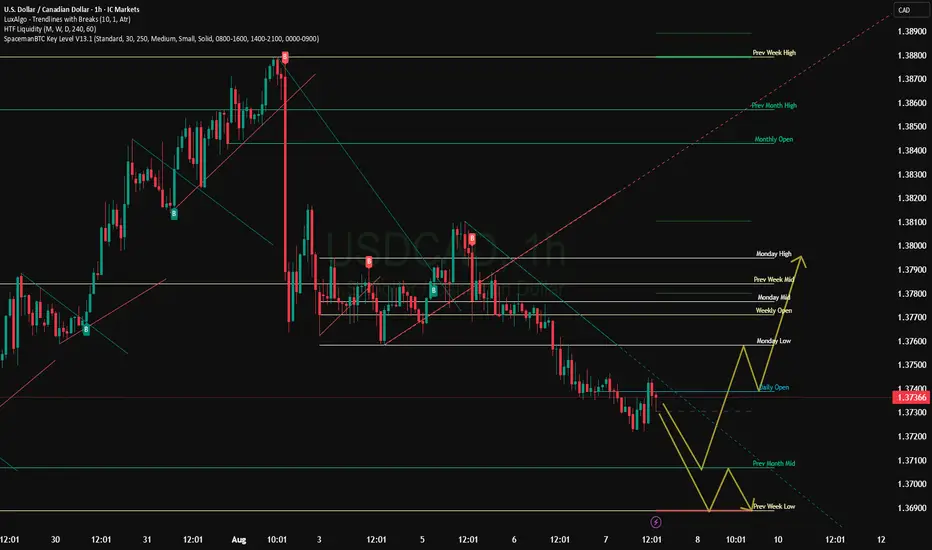
USDCAD - Big Picture and MomentumBig Picture and Momentum
USD/CAD is trading comfortably above the 50-day EMA (~1.3728) and above the 9-day EMA, indicating continued bullish momentum. The 14-day RSI is above the 50 level, confirming the positive market sentiment.
Key Support and Resistance
Resistance: 1.3770–1.3798 range is the current target, a break of which could open the way to the January high around 1.4016.
Support:
50-day EMA (~1.3728) is the first line of defense.
Next is the 9-day EMA (~1.3679).
A further weakening could see a decline to 1.3560, and a strong correction could see a decline to the February 2024 lows (~1.3420).
Market Behavior Scenarios
Bullish scenario: holding above EMA with RSI > 50 creates good conditions for a move up to 1.3770-1.3800, and then to 1.4016, with increasing momentum.
Bearish scenario: falling below EMA, especially below 1.3679, can lead to a deeper decline - to 1.3560 and then to 1.3420.
Recommendations for traders
Long position: can be considered for entry when holding above 1.3728, with a target of 1.3770-1.3800, and a stop just below the EMA.
Short position: justified when falling below 1.3728-1.3679, with a target of 1.3560, and a stop just above the EMA level.
Possibility of correction and rangingThe weakness in the bullish trend and the divergence are giving us signals of a deep correction or price ranging. With these signs, the chances of the price moving higher this week have significantly decreased.