USDCHF LONG FORECAST Q2 W26 D26 Y25USDCHF LONG FORECAST Q2 W26 D26 Y25
Professional Risk Managers👋
HTF BOS REQUIRED
Welcome back to another FRGNT chart update📈
Diving into some Forex setups using predominantly higher time frame order blocks alongside confirmation breaks of structure.
Let’s see what price action is telling us today!
💡Here are some trade confluences📝
✅Daily order block
✅Weekly order block
✅Intraday breaks of structure Required
✅4H Order block
🔑 Remember, to participate in trading comes always with a degree of risk, therefore as professional risk managers it remains vital that we stick to our risk management plan as well as our trading strategies.
📈The rest, we leave to the balance of probabilities.
💡Fail to plan. Plan to fail.
🏆It has always been that simple.
❤️Good luck with your trading journey, I shall see you at the very top.
🎯Trade consistent, FRGNT X
Gann

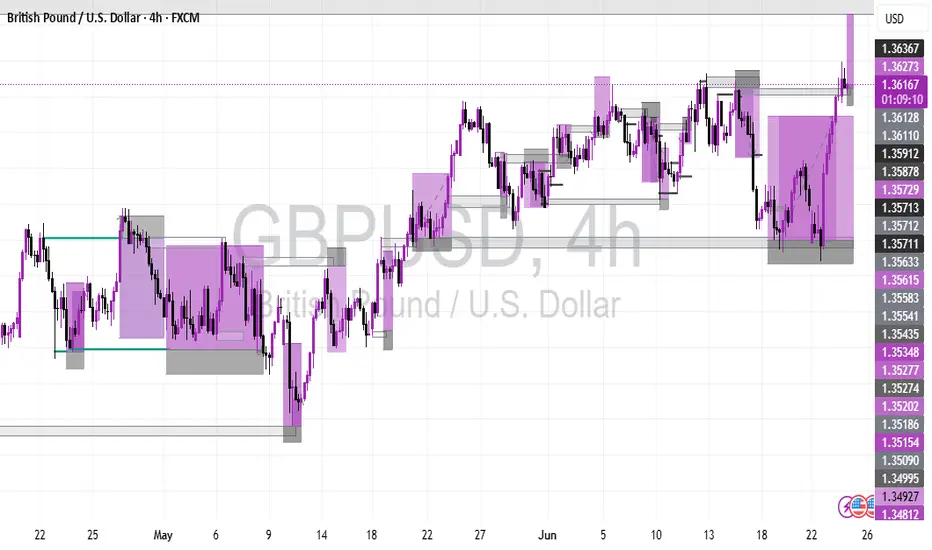
AUDUSD SHORT FORECAST Q2 W26 D26 Y25AUDUSD SHORT FORECAST Q2 W26 D26 Y25
Professional Risk Managers👋
Welcome back to another FRGNT chart update📈
Diving into some Forex setups using predominantly higher time frame order blocks alongside confirmation breaks of structure.
Let’s see what price action is telling us today!
💡Here are some trade confluences📝
✅Daily order block
✅1H Order block
✅Intraday breaks of structure
✅4H Order block
🔑 Remember, to participate in trading comes always with a degree of risk, therefore as professional risk managers it remains vital that we stick to our risk management plan as well as our trading strategies.
📈The rest, we leave to the balance of probabilities.
💡Fail to plan. Plan to fail.
🏆It has always been that simple.
❤️Good luck with your trading journey, I shall see you at the very top.
🎯Trade consistent, FRGNT X


SELL BTCUSD NOW🚨 TRADE ALERT:
SELL BTCUSD NOW 💥📉
🔻 Market showing bearish signs.
🎯 Set your TP (Take Profit) levels wisely.
🛡️ Use SL (Stop Loss) to manage risk.
📊 Confirm with your strategy before entry.
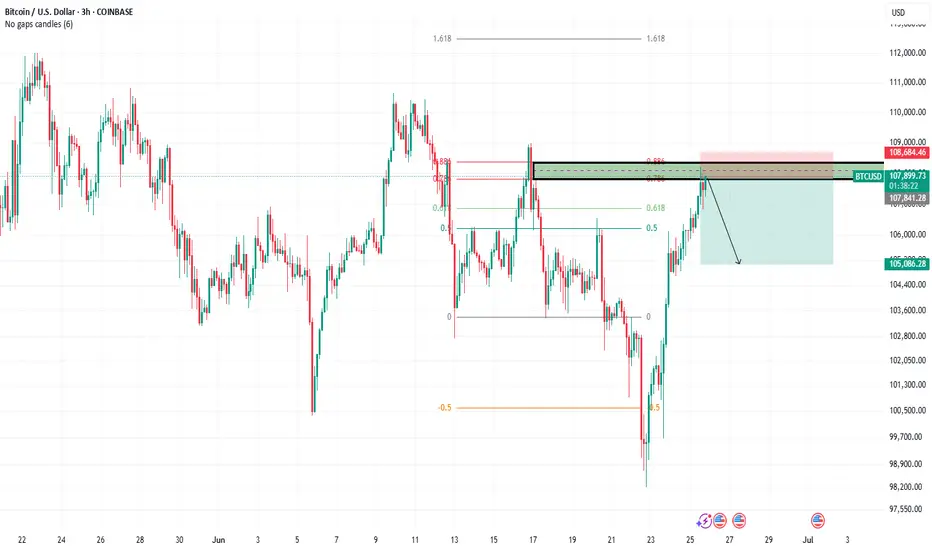
A Classic ICT 2022 model. London session.Time macro, liquidity sweep. 15 min OB. And price delivered continuation in NY.
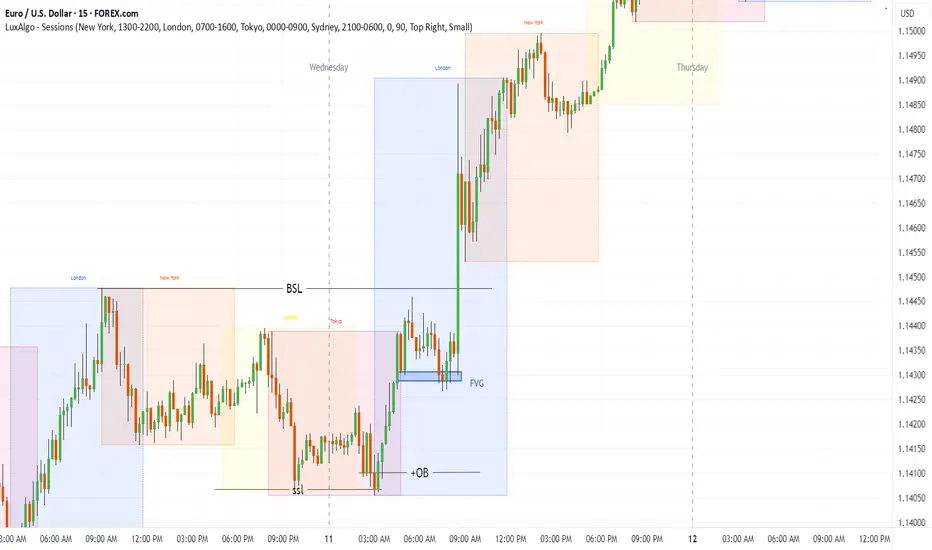
A Classic TGIF trade. Price took sell-side liquidity during the newyork kill zone, traded up creating an order block and price traded back to the bullish order-block. With a position size calculator, that was a great risk to reward trade.

BTC 4-Hour Long Target 115,500Hello fellow Traders.
I am long, only posting my target area.
This Chart is very clean.
I came to the target conclusion area, with some Math, and I have used a Gann Square to monitor a time frame to reach the target area.
Yes, your reading it correctly, seems like it can happen as early as this Friday, and as late as July 22.
PA doesn't necessarily have to stay in the positive area of this Gann Square, and has all the right to swing back up inside positive, to finish it's goal.
The Plan:
The probability to reach the target within the time frame will fade slowly out, far past the Gann Square.
Yes, I am actually guessing where the nearest chance to reach this price level is going to happen "if it will happen" within the green target area, so I may close out my long trade somewhere along the way up. Afterwards scalp the box up and down till it hits the Target Area.
Except price to have an extremely high chance to bounce down from the Target Area, when it hits.
Good Luck !!


DAX: Move Down Expected! Short!
My dear friends,
Today we will analyse DAX together☺️
The price is near a wide key level
and the pair is approaching a significant decision level of 23,509.95 Therefore, a strong bearish reaction here could determine the next move down.We will watch for a confirmation candle, and then target the next key level of 23,438.51..Recommend Stop-loss is beyond the current level.
❤️Sending you lots of Love and Hugs❤️

GOLD: Local Bullish Bias! Long!
My dear friends,
Today we will analyse GOLD together☺️
The recent price action suggests a shift in mid-term momentum. A break above the current local range around 3,314.13 will confirm the new direction upwards with the target being the next key level of 3,322.84 and a reconvened placement of a stop-loss beyond the range.
❤️Sending you lots of Love and Hugs❤️

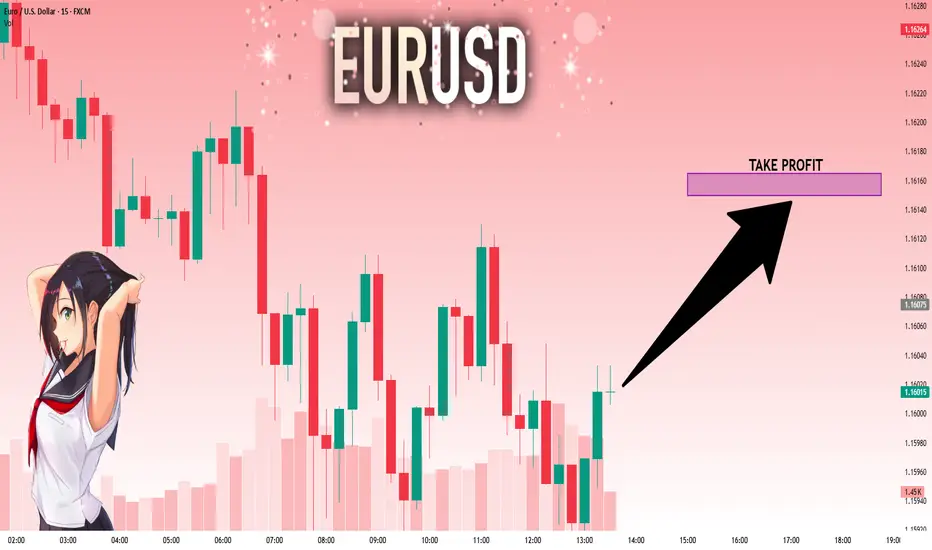
EURUSD: Strong Growth Ahead! Long!
My dear friends,
Today we will analyse EURUSD together☺️
The in-trend continuation seems likely as the current long-term trend appears to be strong, and price is holding above a key level of 1.16017 So a bullish continuation seems plausible, targeting the next high. We should enter on confirmation, and place a stop-loss beyond the recent swing level.
❤️Sending you lots of Love and Hugs❤️
TOP IS NOT IN YET (MORE UPSIDE AFTER THE MINOR CORRECTIONS)We discussed the 5-year bull cycle that starts off every 20-year cycle. We identified that the current 5-year bull cycle will be one of the wildest in the history of the DJIA market by virtue of the current energy level within the log expansion. We will start a new progressive series to discuss the current 20-year cycle in motion.
First we will look closely at these three different 20-year cycles
From the three cycles we can identify a peculiar recurring structure, that is, after the approximately 5th year top we have a wild decline that averagely bottoms below the starting price. We will not dwell much on this cycle as it's not the current cycle in progress. Between these cycles is an (Alternate Cycle) that also has a similar fractal construction.
The first two alternate cycles directly lie between the cycles identified earlier and have a similar fractal. The most striking identity of these alternate cycles is that the origin point is the lowest point within the 20 year trend. The correction from the 5th year top is not so steep and never goes below the origin
The 1942/1962 cycle lies between the 1921/1942 and 1962/1982 cycles
The 1982/2002 cycle lies between the 1962/1982 and 2002/2022 cycles
This means the next alternate 20-year cycle is the 2022/2042 cycle which will lie between 2002/2022 and 2042/2062 cycles. From the internal construction of this cycle we can dive deeper and model the structure forward in both price and time. Example, the vertical price axis for the 1942/1962 cycle was (+648.61 pts) and total horizontal time elapsed was (+1052 wks).
We have a (648.61 x 1052) structure showing a perfect golden ratio of price and time
(1052 / 648.61) = 1.6219
1982/2002 cycle had price axis = 1098.03 pts and time = 1052 wks
We have approximately a 1098.03 x 1052 square of price and time
By observing the cumulative growth pattern we can make projection of the current cycle in progress. We would go through the growth gradually and identify price and time resistances as price action progresses. Please check back as we build step by step the growth structure of the current cycle.
Trade safe

XAUUSD: Market Analysis and Strategy for June 25Gold technical analysis
Daily chart resistance 3400, support 3286
4-hour chart resistance 3354, support 3300
1-hour chart resistance 3343, support 3316
In the hourly chart, the rebound secondary high of $3357 has become an important resistance for the short-selling defense line. If the gold price fails to effectively break through this point, the short-selling trend will be difficult to reverse.
Personally, I expect that although gold prices will be under pressure due to weakened safe-haven demand in the short term, the uncertainty of the situation in the Middle East may limit its further decline. If the ceasefire agreement unexpectedly breaks down, safe-haven buying may quickly return, pushing gold prices to rebound. In addition, the market's adjustment of the Fed's expectations for rate cuts will continue to affect the trend of gold prices. If the expectation of a rate cut in September is further consolidated, gold prices may stabilize at a low level and try to move up.
The key support position below in the short term is 3316, followed by 3300. The important pressure position is around 3340!
Sell: 3340near
Buy: 3300near

SILVER: Will Go Down! Short!
My dear friends,
Today we will analyse SILVER together☺️
The market is at an inflection zone and price has now reached an area around 35.768 where previous reversals or breakouts have occurred.And a price reaction that we are seeing on multiple timeframes here could signal the next move down so we can enter on confirmation, and target the next key level of 35.645..Stop-loss is recommended beyond the inflection zone.
❤️Sending you lots of Love and Hugs❤️

BTC Dominence Update🚨 BTC Dominance Update 🚨
Once again, BTC Dominance (BTC.D) is showing strong bullish momentum! 📈
After a shallow retracement, it has regained strength and is continuing its upward climb. This confirms that Bitcoin remains the top performer in the current market phase.
🔺 Arrow #1 & #2 – Key resistance levels to watch.
🟢 Arrow #3 & #4 – Strong support zones that held well.
🔻 Arrow #5 – The deep retracement point. A breakout from this zone was the first bullish signal for #ALTs
💡 This is exactly why I’ve been avoiding buy trades in altcoins in our group. The dominance chart is crystal clear:
⚠️ This is not the time to rotate into alts.
🔥 Focus on Bitcoin! It's leading the market, and that’s where the momentum is.
📊 Stay disciplined. Stay focused.
🎯 Trade smart — this phase is all about BTC!
\#BTC #BitcoinDominance #CryptoUpdate #AltsOnHold #FocusOnLeaders #TradeSmart

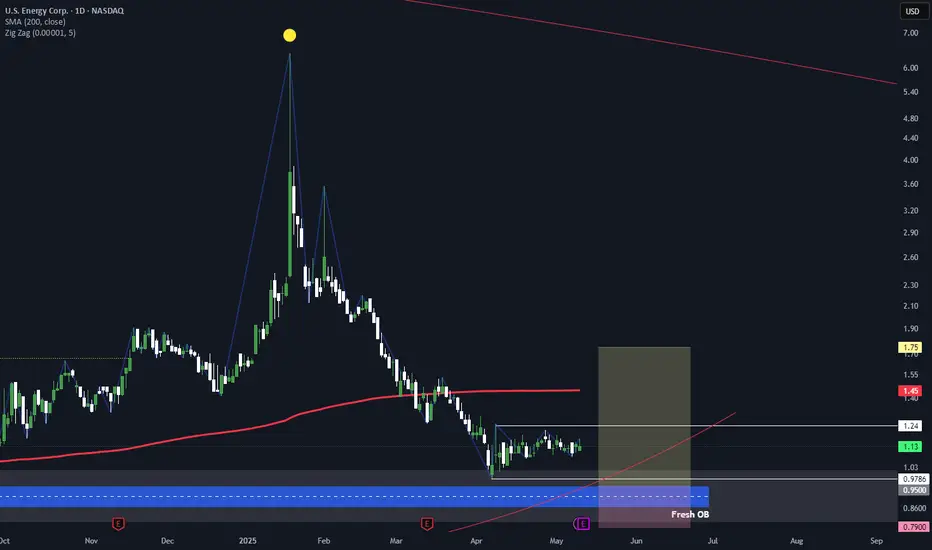
Bullish ideawe need a price action with good volume bouncing up from 0.95 $ to get RR 1:5
the OB is weekly one (has 1 touch) and downgraded to daily (fresh).
your thoughts are so much welcomed by me
GOLD-SELL strategy 3 hourly chart GANNGOLD is still under selling pressure, indicators 9slightly) but below cloud is crucial and feels we may see $ 2,267 test in the near future.
we are perhaps tiny oversold, and for that reason strategy is:
SELL @ $ 3,350-3,375 and take profit near $ 3,275 for now.

#SEI/USDT#SEI
The price is moving within a descending channel on the 1-hour frame and is expected to break and continue upward.
We have a trend to stabilize above the 100 moving average once again.
We have a downtrend on the RSI indicator, which supports the upward move by breaking it upward.
We have a support area at the lower limit of the channel at 0.2696, acting as strong support from which the price can rebound.
Entry price: 0.2790
First target: 0.2894
Second target: 0.3030
Third target: 0.3177

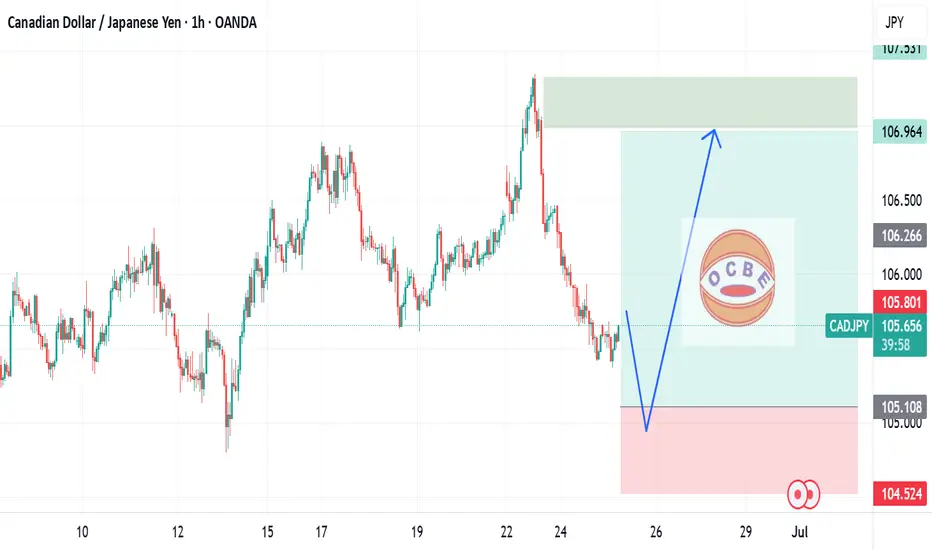
CADJPY long movePrice is currently moving towards our demand zone, any bullish reaction at this level cloud leads to upwards movement.
ALTCOIN LINKUSDT FORECAST EYES ON 4-7JULY!"Wait until July 4–7. Do not trade next week, as it will be similar to the previous one.
I think Monday will be bearish, followed by bullish days on Tuesday, Wednesday, and Thursday. On Friday, the top will likely be set—then start shorting for the following week."

Gold today high-altitude low-multiple operation
📌 Gold news
On Tuesday, the spot gold price plummeted, hitting a two-week low. The main reason was that Iran and Israel announced a ceasefire, which suppressed the demand for safe-haven gold. In addition, Fed Chairman Powell made hawkish remarks, which also hit the gold price trend. Short-term long-short game will focus on the PCE inflation data to be released by the United States. If the economic data performs poorly or inflation continues to fall, it may still provide a medium-term rebound opportunity for gold.
📊Comment analysis
Yesterday, gold was weak overall, and the decline and rebound were limited. It fell directly from around 3357 to 3295, and then rebounded according to the news. It ran around 3326 in the morning. From a technical point of view, the daily low trend line support is around 3290, the 4-hour long lower shadow line bottomed out, and three consecutive positive rebounds, the daily line supports the lower track of the Bollinger band, and the Bollinger band tends to be parallel. There is no sign of opening downward, so the short-term decline of gold prices is limited. Consider paying attention to the support of 3294 during the day, and mainly use this position for defense and low long. Pay attention to the important suppression of the middle track 3363 above, and mainly short.
💰Strategy Package
Focus on the support near 3316-3317 in the short term, rely on this position to go long, stop loss 3307, take profit near 3345, and break 3363. If it falls strongly below 3294, then don't consider going long during the day.
Gold operation strategy: long near 3316, stop loss 3307. Take profit 3345
⭐️ Note: Labaron is not 100% correct here, only a steady operation idea, large warehouse for trend, small warehouse for wave, control the proportion by yourself, there is no unprofitable investment, only unsuccessful orders, whether to make money depends on the timing of buying up and buying down, making money depends on opportunities, investment depends on wisdom, and financial management depends on professionalism.

Nothing more beautiful than thisgbpusd has shown an uptrend for the past few months, did you get the picture?