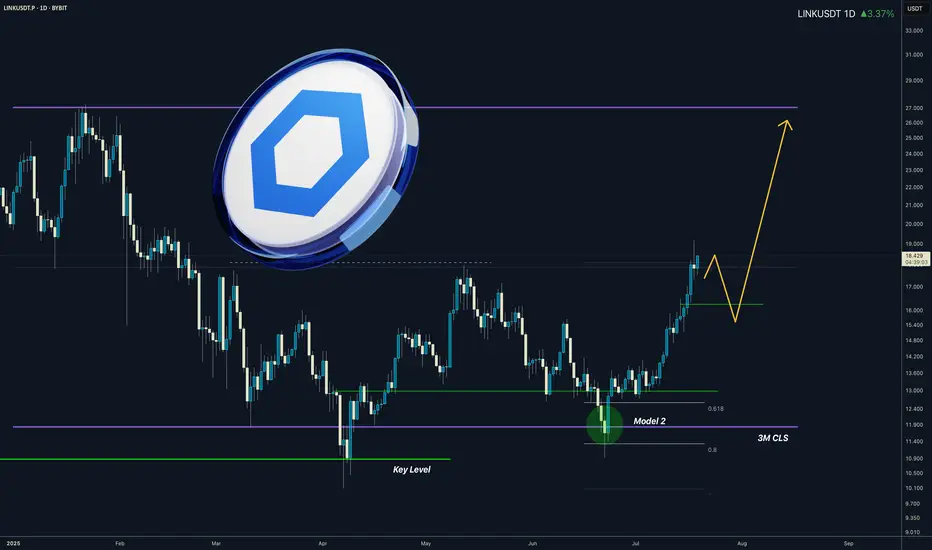
LINK I 3M CLS I Model 2 In the Motion I Target Full CLS rangeYo Market Warriors ⚔️
Fresh Crypto Analysis— if you’ve been riding with me, you already know:
🎯My system is 100% mechanical. No emotions. No trend lines. No subjective guessing. Working all timeframes. Just precision, structure, and sniper entries.
🧠 What’s CLS?
It’s the real smart money. The invisible hand behind $7T/day — banks, algos, central players.
📍Model 1:
HTF bias based on the daily and weekly candles closes,
Wait for CLS candle to be created and manipulated. Switch to correct LTF and spot CIOD. Enter and target 50% of the CLS candle.
For high probability include Dealing Ranges, Weekly Profiles and CLS Timing.
Analysis done on the Tradenation Charts
Disclosure: I am part of Trade Nation's Influencer program and receive a monthly fee for using their TradingView charts in my analysis.
Trading is like a sport. If you consistently practice you can learn it.
“Adapt what is useful. Reject whats useless and add whats is specifically yours.”
David Perk aka Dave FX Hunter
💬 Comment any Coin I ll give you my quick view
Gann
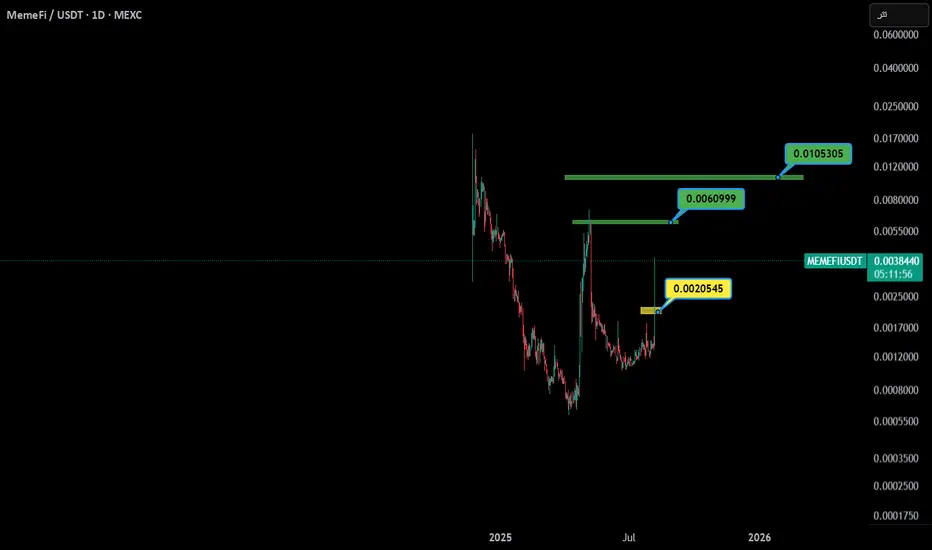
ONE BIG PROFIT AFTER ONE RISK ON THIS SHITCOINTP GREEN AREA
SL AND SUPPORT YELLOW BOX
It's a lot of risk, but if we look at it as a big profit, assuming the loss of assets, it can seem reasonable. Anyway, the stop loss is 50% away from here, but the targets are also reasonable. It seems more logical to exit at the first target.
Nq & Es Analysis 06-08-2025 After the OpenAs expected, the first scenario played out — with the Nasdaq pushing higher, pulling back for a retracement, and then targeting the previous day’s high. The only difference was that the S&P 500 initially printed some lows and showed more sluggish behavior compared to the Nasdaq. However, once the market opened and volatility kicked in, price resumed its true direction.
Challenging day overall, with some unusual price action. Still, as you can see, the key levels we shared earlier held up beautifully once again.
See you tomorrow — 30 minutes before the market opens (09:00 AM) NY TIME!

US30: Bulls Are Winning! Long!
My dear friends,
Today we will analyse US30 together☺️
The market is at an inflection zone and price has now reached an area around 44,197.65 where previous reversals or breakouts have occurred.And a price reaction that we are seeing on multiple timeframes here could signal the next move up so we can enter on confirmation, and target the next key level of 44,301.05.Stop-loss is recommended beyond the inflection zone.
❤️Sending you lots of Love and Hugs❤️

SILVER: Target Is Up! Long!
My dear friends,
Today we will analyse SILVER together☺️
The price is near a wide key level
and the pair is approaching a significant decision level of 37.822 Therefore, a strong bullish reaction here could determine the next move up.We will watch for a confirmation candle, and then target the next key level of 37.912.Recommend Stop-loss is beyond the current level.
❤️Sending you lots of Love and Hugs❤️

EURUSD: Move Down Expected! Short!
My dear friends,
Today we will analyse EURUSD together☺️
The recent price action suggests a shift in mid-term momentum. A break above the current local range around 1.16384 will confirm the new direction upwards with the target being the next key level of 1.16133 and a reconvened placement of a stop-loss beyond the range.
❤️Sending you lots of Love and Hugs❤️

GOLD: Local Bearish Bias! Short!
My dear friends,
Today we will analyse GOLD together☺️
The in-trend continuation seems likely as the current long-term trend appears to be strong, and price is holding below a key level of 3,375.02 So a bearish continuation seems plausible, targeting the next low. We should enter on confirmation, and place a stop-loss beyond the recent swing level.
❤️Sending you lots of Love and Hugs❤️

AUDUSD – SHORT POSITION TRADE BREAKDOWN Q3 | W32 | D6 | Y25📊 AUDUSD – SHORT POSITION TRADE BREAKDOWN
Q3 | W32 | D6 | Y25
Daily Forecast 🔍📅
Here’s a short diagnosis of the current chart setup 🧠📈
Higher time frame order blocks have been identified — these are our patient points of interest 🎯🧭.
It’s crucial to wait for a confirmed break of structure 🧱✅ before forming a directional bias.
This keeps us disciplined and aligned with what price action is truly telling us.
📈 Risk Management Protocols
🔑 Core principles:
Max 1% risk per trade
Only execute at pre-identified levels
Use alerts, not emotion
Stick to your RR plan — minimum 1:2
🧠 You’re not paid for how many trades you take, you’re paid for how well you manage risk.
🧠 Weekly FRGNT Insight
"Trade what the market gives, not what your ego wants."
Stay mechanical. Stay focused. Let the probabilities work.

EURGBP-SELL strategy 3D chart GANNThe pair is slightly overbought, and judging the indicators, we may have corrections in the near future, is my personal viewpoint.
Strategy SELL @ 0.8700-0.8740 and take profit near 0.8607 for now.

ENTRY USDCADDisclaimer:
This is merely a chart-based analytical trading idea and is not considered investment advice. Please manage your risks carefully and conduct your own research before making any trading decisions.

XAUUSD: Market Analysis and Strategy for August 6th.Gold Technical Analysis:
Daily Chart Resistance: 3430, Support: 3300
4-Hour Chart Resistance: 3400, Support: 3334
1-Hour Chart Resistance: 3390, Support: 3350.
Gold bottomed out and rebounded yesterday. After hitting 3350, the price quickly rebounded to 3390, then traded sideways. Keep an eye on the bullish trend and buy on dips. Wait for a breakout above 3390.
After reaching 3390 yesterday, the price fluctuated downward today, currently trading near 3365. A short-term pullback does not signal a change in the trend; it remains bullish. Yesterday's low of 3350 forms the bull-bear divide. If gold prices remain above this level, the bullish trend remains. Pullbacks are buying opportunities. Any stop-loss around the 3350 support level is a good time to buy. During the uptrend, there's no need to speculate on the top; for now, focus on 3390. A breakout above 3390 could target 3400-3415 for bulls.
For the NY market plan, you can buy when it stabilizes in the 3350-3356 area. The SL plan is set at 3345, and the rising target is 3385-3400.

LTC/USDT- 4H Smart money grabbed the highs Price swept the buy-side liquidity, triggering stop orders above recent highs, then showed a strong rejection — indicating possible distribution.
Bearish divergence confirmed weakening momentum on the RSI.
Sell-side liquidity now becomes the primary draw, with the first target zone aligning near $106.


GOLD Weekly View📌 Mark your reference points — key levels or order blocks on the chart.
📌 Wait for price to reach them — there’s no need to be in the market all the time.
📌 Once price reaches your level, allow 10–40 candles to form. This is critical. Why? Because during this time, the market goes through its usual phases:
1. Accumulation
2. Manipulation
3. Distribution (which results from accumulation)
💡This is the natural cycle: cause and effect.
You don’t want to get trapped in the accumulation or manipulation phases, that’s where most traders get liquidated.
Instead, wait for structure to form inside your reference point or order block. Once structure is clear, you’ll often spot a QML (Quasimodo Level) and that’s your entry trigger.
💡You don’t need to be the first buyer or seller. You just need to enter at the right time, with clarity and confirmation. Let the market come to you, and let it show its hand before you act.
USDCAD's Opportunity Bell Is Ringing — Don’t Miss Out!Hey there, my valued friends!
I’ve prepared a fresh USDCAD analysis just for you.
📌 If the 1.37245 level breaks, the next target will be 1.38000.
Every single like you send my way is the biggest motivation behind sharing these analyses.
🙌 Huge thanks to each and every one of you who supports me!
Would you like to add a visual or a catchy headline to boost engagement even more? I can help with that too.

USDJPY – DAILY FORECAST Q3 | W32 | D6 | Y25📊 USDJPY – DAILY FORECAST
Q3 | W32 | D6 | Y25
Daily Forecast 🔍📅
Here’s a short diagnosis of the current chart setup 🧠📈
Higher time frame order blocks have been identified — these are our patient points of interest 🎯🧭.
It’s crucial to wait for a confirmed break of structure 🧱✅ before forming a directional bias.
This keeps us disciplined and aligned with what price action is truly telling us.
📈 Risk Management Protocols
🔑 Core principles:
Max 1% risk per trade
Only execute at pre-identified levels
Use alerts, not emotion
Stick to your RR plan — minimum 1:2
🧠 You’re not paid for how many trades you take, you’re paid for how well you manage risk.
🧠 Weekly FRGNT Insight
"Trade what the market gives, not what your ego wants."
Stay mechanical. Stay focused. Let the probabilities work.
FX:USDJPY

AUDUSD – DAILY FORECAST Q3 | W32 | D6 | Y25📊 AUDUSD – DAILY FORECAST
Q3 | W32 | D6 | Y25
Daily Forecast 🔍📅
Here’s a short diagnosis of the current chart setup 🧠📈
Higher time frame order blocks have been identified — these are our patient points of interest 🎯🧭.
It’s crucial to wait for a confirmed break of structure 🧱✅ before forming a directional bias.
This keeps us disciplined and aligned with what price action is truly telling us.
📈 Risk Management Protocols
🔑 Core principles:
Max 1% risk per trade
Only execute at pre-identified levels
Use alerts, not emotion
Stick to your RR plan — minimum 1:2
🧠 You’re not paid for how many trades you take, you’re paid for how well you manage risk.
🧠 Weekly FRGNT Insight
"Trade what the market gives, not what your ego wants."
Stay mechanical. Stay focused. Let the probabilities work.
FX:AUDUSD

ENTRY EURJPYDisclaimer:
This is merely a chart-based analytical trading idea and is not considered investment advice. Please manage your risks carefully and conduct your own research before making any trading decisions.

EURUSD – DAILY FORECAST Q3 | W32 | D6 | Y25📊 EURUSD – DAILY FORECAST
Q3 | W32 | D6 | Y25
Daily Forecast 🔍📅
Here’s a short diagnosis of the current chart setup 🧠📈
Higher time frame order blocks have been identified — these are our patient points of interest 🎯🧭.
It’s crucial to wait for a confirmed break of structure 🧱✅ before forming a directional bias.
This keeps us disciplined and aligned with what price action is truly telling us.
📈 Risk Management Protocols
🔑 Core principles:
Max 1% risk per trade
Only execute at pre-identified levels
Use alerts, not emotion
Stick to your RR plan — minimum 1:2
🧠 You’re not paid for how many trades you take, you’re paid for how well you manage risk.
🧠 Weekly FRGNT Insight
"Trade what the market gives, not what your ego wants."
Stay mechanical. Stay focused. Let the probabilities work.
FX:EURUSD

GBPUSD – DAILY FORECAST Q3 | W32 | D6 | Y25📊 GBPUSD – DAILY FORECAST
Q3 | W32 | D6 | Y25
Daily Forecast 🔍📅
Here’s a short diagnosis of the current chart setup 🧠📈
Higher time frame order blocks have been identified — these are our patient points of interest 🎯🧭.
It’s crucial to wait for a confirmed break of structure 🧱✅ before forming a directional bias.
This keeps us disciplined and aligned with what price action is truly telling us.
📈 Risk Management Protocols
🔑 Core principles:
Max 1% risk per trade
Only execute at pre-identified levels
Use alerts, not emotion
Stick to your RR plan — minimum 1:2
🧠 You’re not paid for how many trades you take, you’re paid for how well you manage risk.
🧠 Weekly FRGNT Insight
"Trade what the market gives, not what your ego wants."
Stay mechanical. Stay focused. Let the probabilities work.
FX:GBPUSD

EURGBP – DAILY FORECAST Q3 | W32 | D6 | Y25📊 EURGBP – DAILY FORECAST
Q3 | W32 | D6 | Y25
Daily Forecast 🔍📅
Here’s a short diagnosis of the current chart setup 🧠📈
Higher time frame order blocks have been identified — these are our patient points of interest 🎯🧭.
It’s crucial to wait for a confirmed break of structure 🧱✅ before forming a directional bias.
This keeps us disciplined and aligned with what price action is truly telling us.
📈 Risk Management Protocols
🔑 Core principles:
Max 1% risk per trade
Only execute at pre-identified levels
Use alerts, not emotion
Stick to your RR plan — minimum 1:2
🧠 You’re not paid for how many trades you take, you’re paid for how well you manage risk.
🧠 Weekly FRGNT Insight
"Trade what the market gives, not what your ego wants."
Stay mechanical. Stay focused. Let the probabilities work.
FX:EURGBP

USDJPY (Daily analysis) 06/08USDJPY (Daily analysis) 06/08 hi everyone hope you are having a good day. as always happy trading
