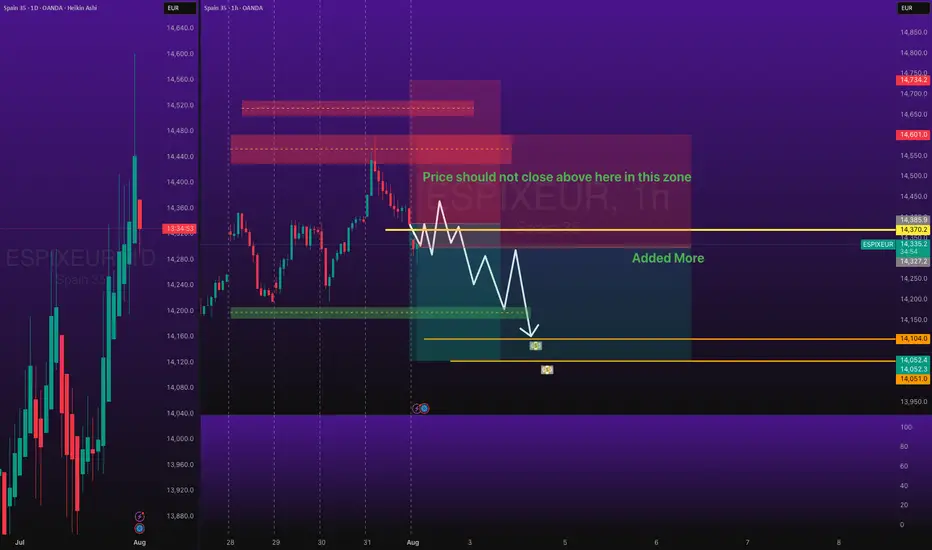
ESPIXEUR Short Trade with SL and TPOANDA:ESPIXEUR Short Trade - Low Risk, with my back testing of this strategy, it hits multiple possible take profits, manage your position accordingly.
Note: Manage your risk yourself, its risky trade, see how much your can risk yourself on this trade.
Use proper risk management
Looks like good trade.
Lets monitor.
Use proper risk management.
Disclaimer: only idea, not advice
Gann
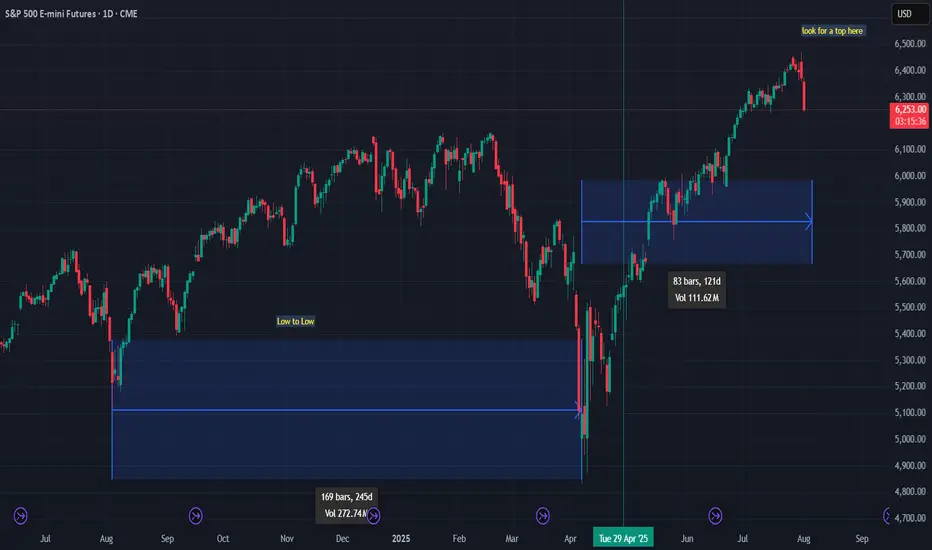
Possible cluster for Short on SP500An area I am closely monitoring lies between 6478 and 6516, particularly if the current high of 6152.75 (marked on December 16) is breached.
Analyzing the swing starting from the low of 3502 in October 2022, the major tops have followed a distinctive pattern in percentage terms:
3/40
5/40
8/40
13/40
21/40
The pattern suggests that each subsequent high is obtained by summing the numerators of the previous upward moves (e.g., 3 + 5 = 8, 8 + 5 = 13, and so on) while the denominator remains fixed at 40. Following this logic, the next high should be 34/40 (21 + 13).
I am confident in the reliability of this pattern because when I sum the numerators (21 + 34) and the denominators (40 + 40), the resulting level (55/80) aligns with a minor high. Similarly, by summing 55/80 and 21/40, using the same logic, I arrive at 76/120, which corresponded to a very significant high in July 2024.
While these levels may not be perfectly precise, they represent key areas of interest that warrant close attention.
If you are interested in this type of analysis, particularly when integrated with GANN angles, feel free to contact me privately at this email: drake36@inwind.it.

BTCUSD: Local Bullish Bias! Long!
My dear friends,
Today we will analyse BTCUSD together☺️
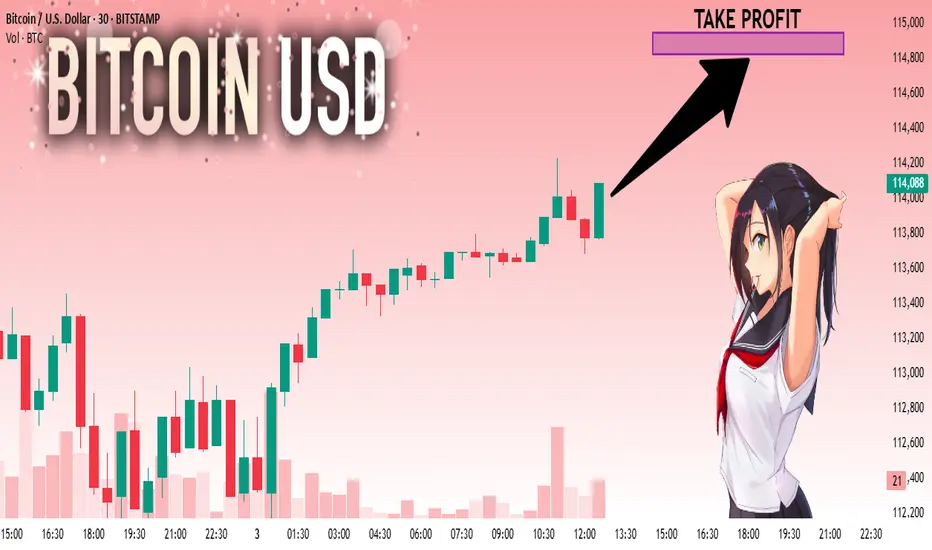
The market is at an inflection zone and price has now reached an area around 114,020 where previous reversals or breakouts have occurred.And a price reaction that we are seeing on multiple timeframes here could signal the next move up so we can enter on confirmation, and target the next key level of 114,821.Stop-loss is recommended beyond the inflection zone.
❤️Sending you lots of Love and Hugs❤️
ETHUSD: Absolute Price Collapse Ahead! Short!
My dear friends,
Today we will analyse ETHUSD together☺️
The price is near a wide key level
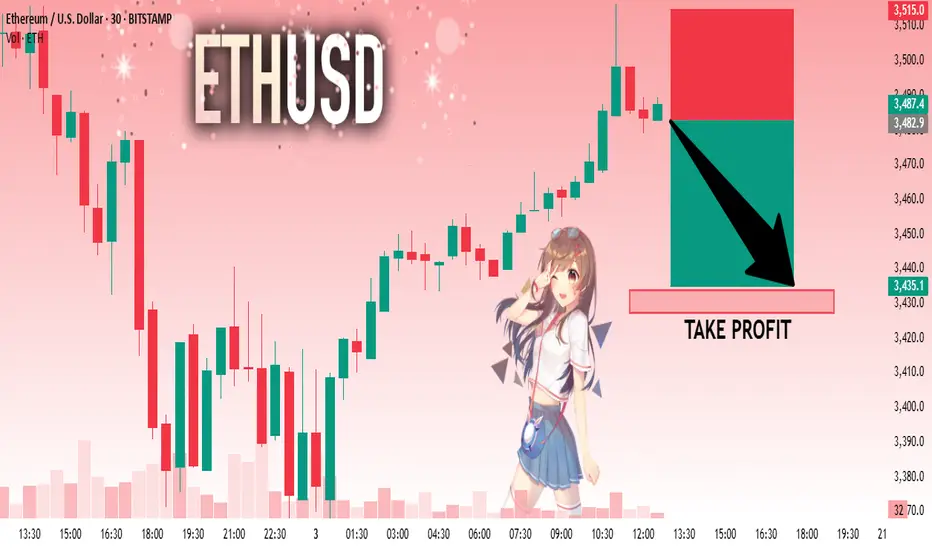
and the pair is approaching a significant decision level of 3,482.9 Therefore, a strong bearish reaction here could determine the next move down.We will watch for a confirmation candle, and then target the next key level of 3,433.9..Recommend Stop-loss is beyond the current level.
❤️Sending you lots of Love and Hugs❤️
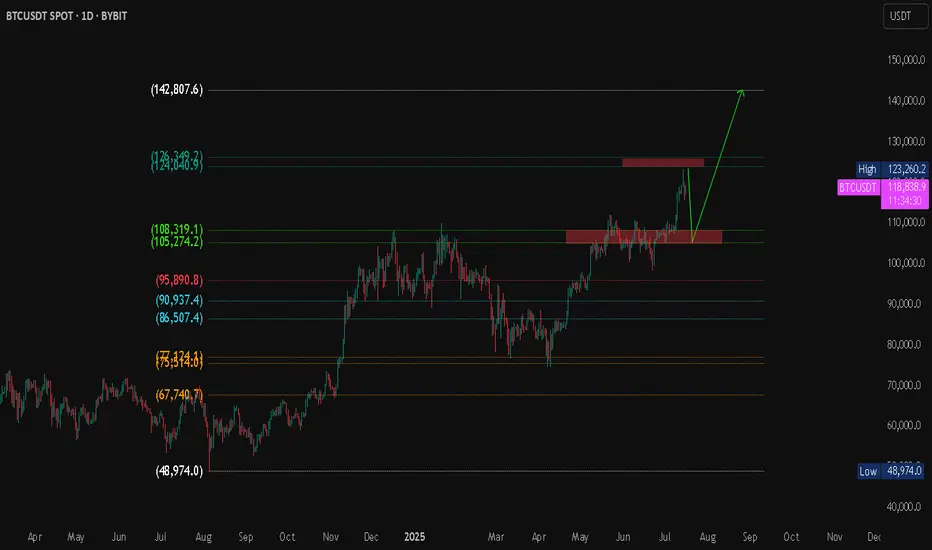
BTC/USDT Technical Analysis Market Overview
Bitcoin is currently trading at $118,788, with an intraday high of $119,311. The market has recently tested a major resistance zone and is showing signs of a potential pullback toward a key demand zone before a possible continuation to higher levels.
Projected Scenario (Bullish Bias)
Expected pullback to the support zone around $105K – $108K.
If price holds and shows a bullish reversal, a breakout above $124K is expected.
Primary upside target: $142,807 (Fibonacci projection / potential new high).
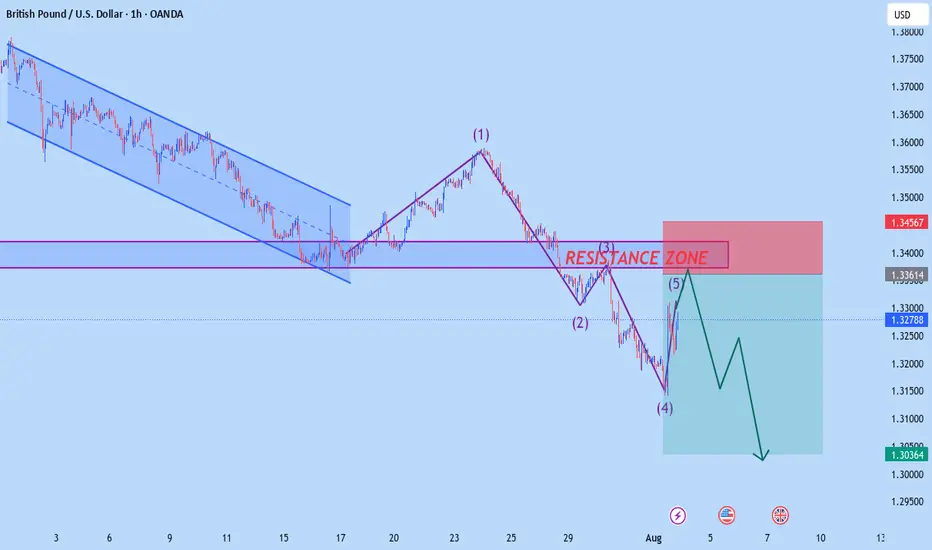
GBPUSD NEW H1 OUTLOOKAccording to H1 analysis GBP market almost at resistance level it will be falling soon from resistance zone we have good oppourtanity to short from here
TRADE AT YOUR OWN RISK
REGARD ALBERT
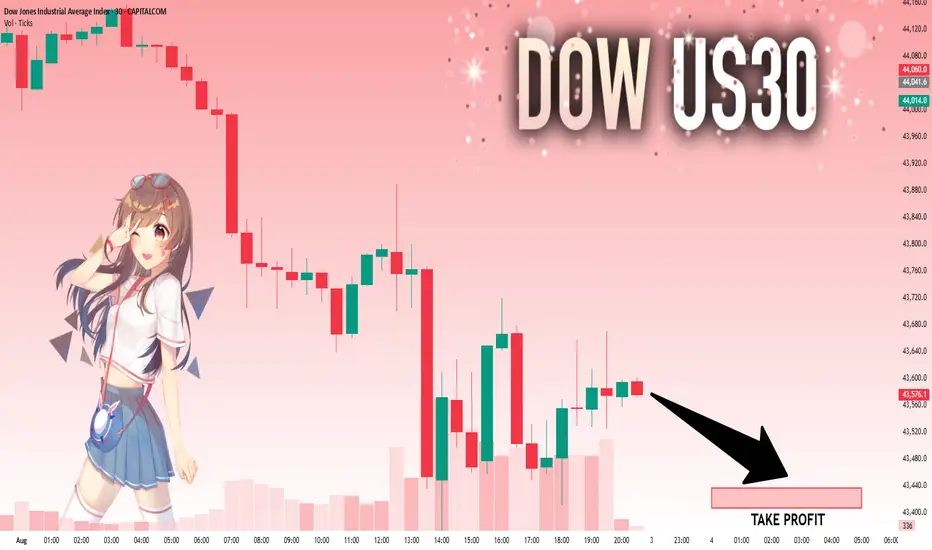
US30: Will Go Down! Short!
My dear friends,
Today we will analyse US30 together☺️
The recent price action suggests a shift in mid-term momentum. A break below the current local range around 47,577.1 will confirm the new direction downwards with the target being the next key level of 43,436.6 .and a reconvened placement of a stop-loss beyond the range.
❤️Sending you lots of Love and Hugs❤️
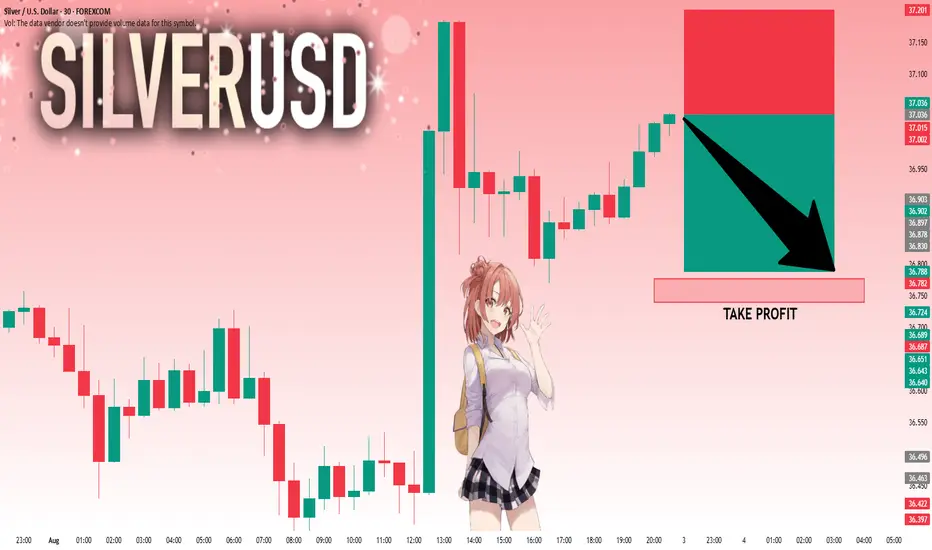
SILVER: The Market Is Looking Down! Short!
My dear friends,
Today we will analyse SILVER together☺️
The market is at an inflection zone and price has now reached an area around 37.036 where previous reversals or breakouts have occurred.And a price reaction that we are seeing on multiple timeframes here could signal the next move down so we can enter on confirmation, and target the next key level of 36.788..Stop-loss is recommended beyond the inflection zone.
❤️Sending you lots of Love and Hugs❤️
EURUSD: Strong Bullish Sentiment! Long!
My dear friends,
Today we will analyse EURUSD together☺️
The price is near a wide key level
and the pair is approaching a significant decision level of 1.15859 Therefore, a strong bullish reaction here could determine the next move up.We will watch for a confirmation candle, and then target the next key level of 1.16494.Recommend Stop-loss is beyond the current level.
❤️Sending you lots of Love and Hugs❤️

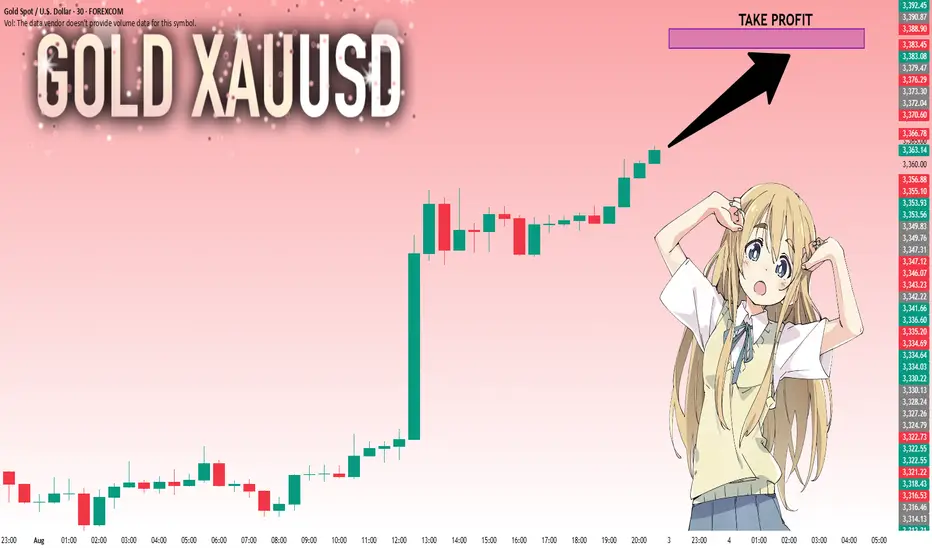
GOLD: Bulls Are Winning! Long!
My dear friends,
Today we will analyse GOLD together☺️
The recent price action suggests a shift in mid-term momentum. A break above the current local range around 3,363.50 will confirm the new direction upwards with the target being the next key level of 3,383.45 and a reconvened placement of a stop-loss beyond the range.
❤️Sending you lots of Love and Hugs❤️
MAGICUSDT.P 15m – Short Setup at Key Fib ResistancePrice sharply rejected from the 0.2042 high and is now breaking below the 50%–61.8% Fibonacci retracement zone after a lower high. The move shows strong selling interest, aligning with MACD histogram momentum shift into the negative.

XLM To $0.74I'm looking for XLM to continue to the downside followed by a move up. I will place a buy at the 50% fib level or in between the 50% and 61.8.

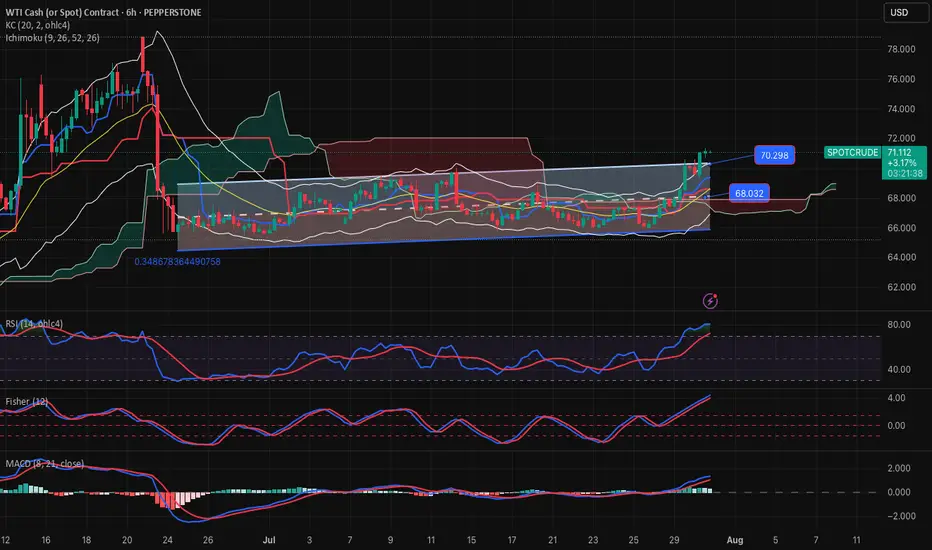
OIL-SELL strategy 6 hourly chart Reg. ChannelOIL has moved up sharply and we are moving beyond the regression channel. This usually will not last especially when overbought status.
Stragtegy SELL @ $ 70.90-71.30 and take profit near 69.37 for now.
btc short tradeon 1hr timeframe btc take the inducement and on 15m done MSS and now rice going to retest the 15m advanced oder block
entry 19131
stoploss 120990
target 1; 114685
target 2 ; 113650

Oil (WTI) – Upcoming Buy OpportunityBased on the analysis I conducted using fractals, oil is expected to move upward and provide buyers with a 2% gain, equivalent to 140 pips.

BTCUSD Swing outlookSwing Outlook on BTCUSD!
8H Timeframe Analysis
Trend Bullish
Looking for buys on discounted levels

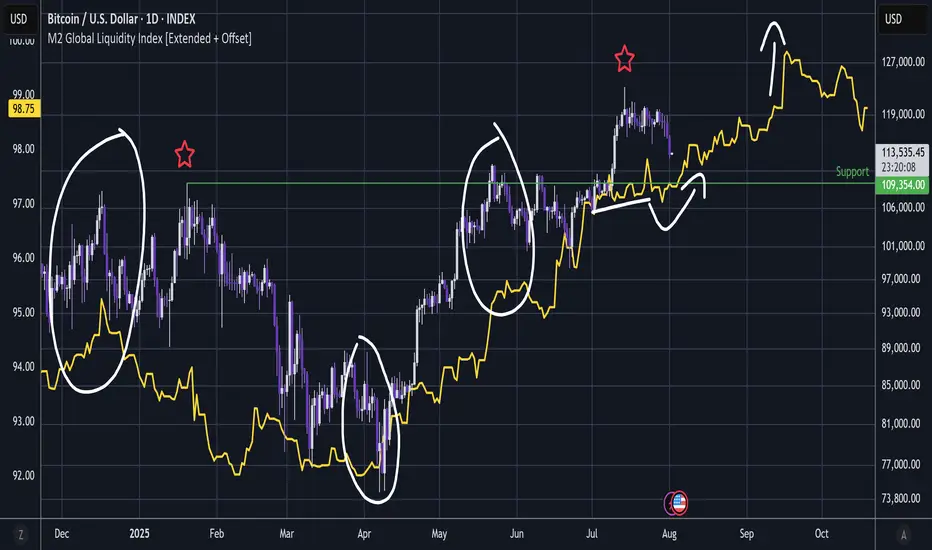
BITCOIN - M2 Global Liquidity Is Silver Lining ?BTC / M2 Global Liquidity (Offset 78 days)
History did repeat and the standout Shooting Star has again led to significant dump action as it .
And the fact that this is happening while stock indexes are wobbling while Trump unleashes more tariffs - should be a cause for concern.
But to lighten moods, I have added M2 Global Liquidity.
To remind, there has been incredible correlation and I have circled a few instances.
Also notice there is quite a flat area in M2 - it looks somewhat similar to the flat area that Bitcoin just slumped from.
Then notice that M2 had a small slump then carries on up until what looks like some sort of blow off phase in September - then corrective action; perhaps a 3 wave correction (before continuing on up).
So obviously this area is very dangerous but there might just be a silver lining 🤔
That said, now that indexes have wobbled, this area is certainly dangerous and we could yet see another wave down in tandem with stock indexes as we did in January.
This analysis is shared for educational purposes only and does not constitute financial advice. Please conduct your own research before making any trading decisions.
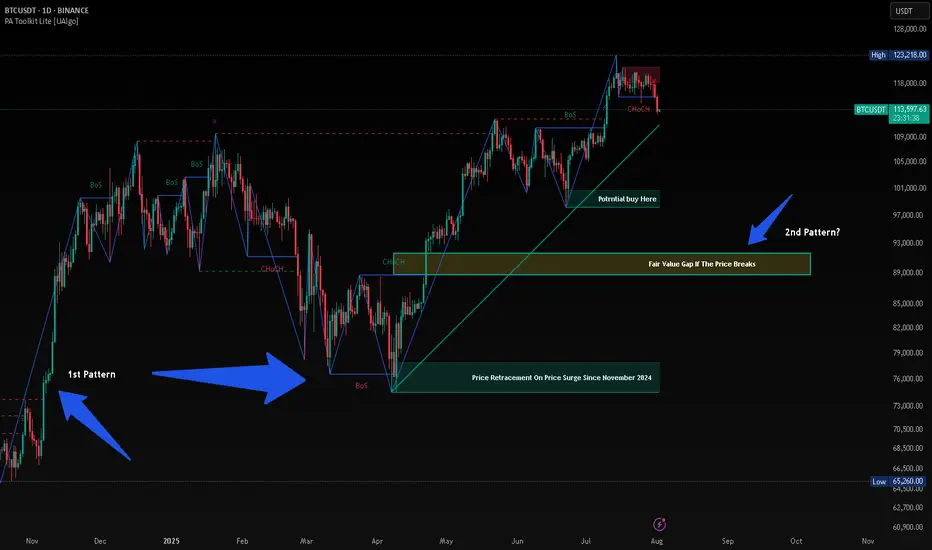
BTC HUNTS LIQUIDITYThis is just my opinion, BTC will hunt liquidity before taking new High. Since November 2024 after President Trump was elected, the price of BTC surge from $74,000 and retrace almost the same price on April 2025 after taking its new High. History will repeat itself and when history failed, there will be a long Bearish at least 90%.
looking for a possible top for SPX500 , cycle highlooking for a possible top for SPX500 , cycle high
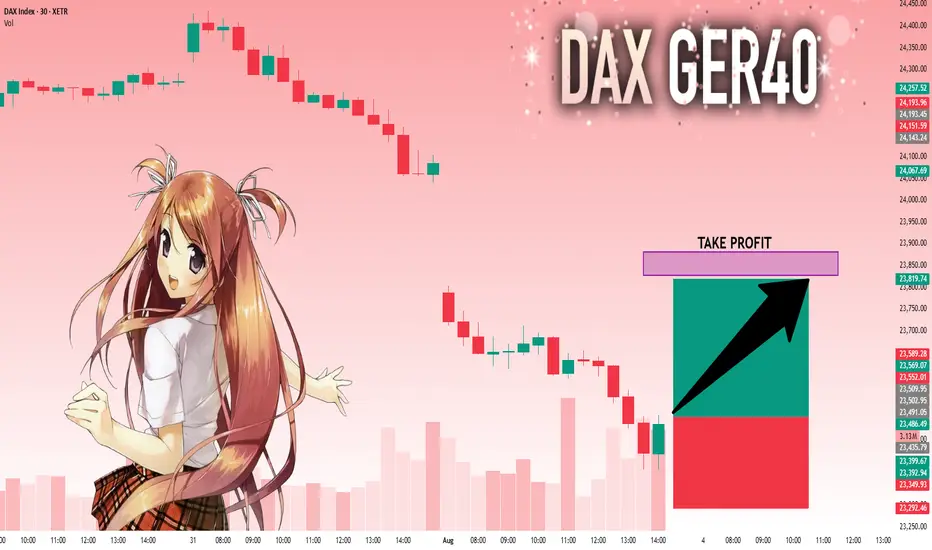
DAX: Next Move Is Up! Long!
My dear friends,
Today we will analyse DAX together☺️
The in-trend continuation seems likely as the current long-term trend appears to be strong, and price is holding above a key level of 23,502.95 So a bullish continuation seems plausible, targeting the next high. We should enter on confirmation, and place a stop-loss beyond the recent swing level.
❤️Sending you lots of Love and Hugs❤️
GOLD: Target Is Down! Short!
My dear friends,
Today we will analyse GOLD together☺️
The market is at an inflection zone and price has now reached an area around 3,353.10 where previous reversals or breakouts have occurred.And a price reaction that we are seeing on multiple timeframes here could signal the next move down so we can enter on confirmation, and target the next key level of 3,335.20..Stop-loss is recommended beyond the inflection zone.
❤️Sending you lots of Love and Hugs❤️

EURUSD: Move Down Expected! Short!
My dear friends,
Today we will analyse EURUSD together☺️
The price is near a wide key level
and the pair is approaching a significant decision level of 1.15337 Therefore, a strong bullish reaction here could determine the next move up.We will watch for a confirmation candle, and then target the next key level of 1.15208.Recommend Stop-loss is beyond the current level.
❤️Sending you lots of Love and Hugs❤️

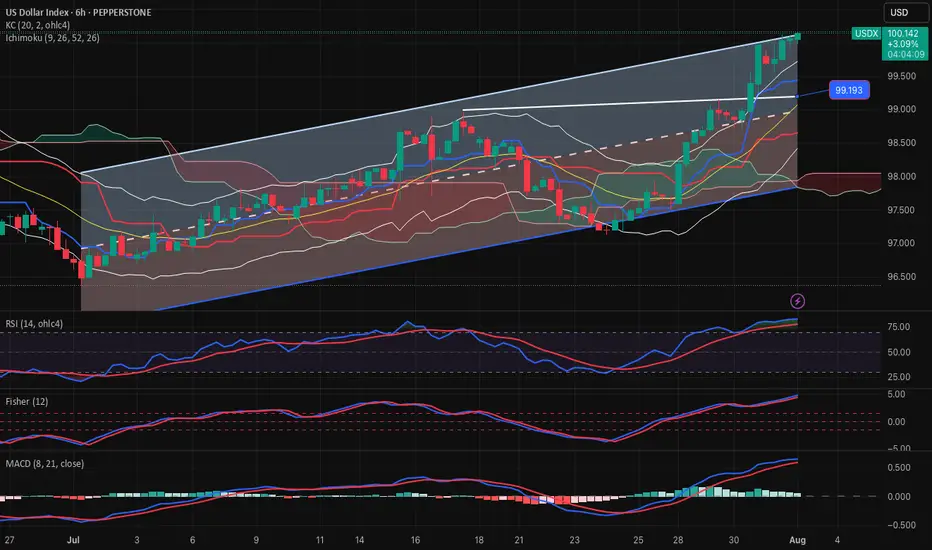
USDX-SELL strategy 6 horuly chart Reg.ChannelThe index has moved up sharply, and as always, when over speeding, one may get a speeding ticket. :) anyway, on a serious note, we are quite overbought and above the Reg. Channel a bit. This means over time we may see a pullback, which can bring us to lower 99.00s.
Strategy SELL @ 100.00-100.40 and take profit near 99.07 for now.