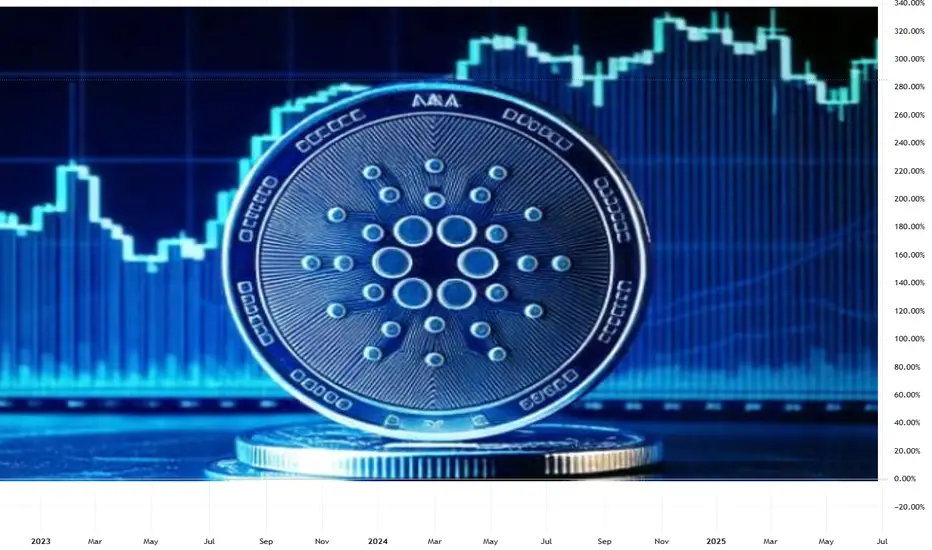
ChatGPT Claims $ADA Is Waking Up – Could $3 Be Back on the TableWith Cardano (ADA) showing renewed momentum, speculation is resurfacing about whether it can approach its $3 all-time high. While ChatGPT-powered analysis highlights early signs of revival, measured expectations and strategic planning are essential.
ADA’s Technical Setup: Signs of Uptick
Whale accumulation: Large wallets are steadily acquiring ADA, hinting at long-term confidence.
EMA crossover: ADA’s 50-day MA recently crossed above the 200-day MA—a bullish omen.
Volume confirmation: Price increases are backed by rising trade volume, strengthening the signal.
This alignment suggests ADA may be entering a steady upward phase.
Ecosystem Growth Driving Optimism
Vasil upgrade legacy: Network throughput improvements and reduced fees remain strengths.
DeFi & NFT traction: Over 30 smart contracts launched recently, signaling healthy usage.
Strategic partnerships: Engagements in green finance and digital identity add real use-case value.
Together, these factors strengthen ADA’s fundamentals and investor sentiment.
Sizing Up the $3 Benchmark
Market cap scale: To reach $3, Cardano’s market cap needs to expand by approximately $90 billion—a significant leap.
Past performance context: ADA flirted with $3 in late 2021 but lacked supporting network activity to sustain it.
Trigger dependency: Institutional adoption, DeFi hubs, or major fiat tie-ins are likely prerequisites for a breakout.
A controlled climb toward $2 seems more realistic, with a push beyond requiring major catalysts.
Investor Considerations
Staggered entry (DCA): Consider accumulating between $1.20–$1.40.
Profit-taking strategy: Partial exits at $2 and $2.50+ help lock in gains while maintaining exposure.
News monitoring: Watch new dApp launches, development updates, and community announcements.
Portfolio balance: ADA is best held alongside BTC, ETH, and select altcoins to mitigate risk.
Final Take
On-chain momentum and ecosystem signals suggest Cardano is moving off the sidelines. However, an overnight surge to $3 is unlikely without significant developments. By combining thoughtful accumulation with active monitoring and disciplined risk management, investors can position themselves to benefit if ADA continues its upward trajectory in 2025.
Gann Square
MEV Bot Exploit by MIT-Educated Brothers Leads to $25M CryptoIn the dynamic world of crypto trading, where cutting-edge innovation meets finance, abuses are inevitable. One of the most prominent cases of the year involves brothers Anton and James Peraire-Bueno, MIT graduates accused of exploiting Maximal Extractable Value (MEV) strategies to siphon off $25 million from the Ethereum ecosystem within seconds. The case may set a precedent for how automated behavior in decentralized systems is judged under traditional legal frameworks.
What Happened?
According to the prosecution, the brothers deployed several Ethereum validators and used specialized algorithms to reorder transactions within blocks. This allowed them to front-run other MEV bots and redirect transaction flows in their favor—a textbook mempool attack. In just 12 seconds, they allegedly drained $25 million in ETH and other digital assets.
Why Is This Case Unique?
First major MEV case involving such significant financial losses
Criminal charges despite actions operating within protocol rules
Academic background of the defendants adds to the public intrigue
This case raises a key legal question: Can actions that are technically “legal” under protocol rules still constitute fraud if they are knowingly harmful to other participants?
Implications for the Crypto Industry
The trial could redefine ethical and legal standards in the DeFi and automated trading sectors. If convicted, this could trigger a broader review of front-running bots, sandwich attacks, and other MEV strategies that, until now, have existed in a legal gray area.
As the regulatory landscape evolves, this trial may become a cornerstone in shaping how future MEV tactics are governed—and how automated trading fits into the legal definition of financial manipulation.

Diametric Pattern - Riding the current G-wave- Riding the G-wave - hoping it to tend to be nearly equal to A-wave
- 90* Gann acting as resistance
- 270* Gann as supports

Forex Market: Myth or Strategy? — Analysis by Valtrix GroupEvery year in June, forex traders pay close attention to historical price movements, hoping to identify recurring seasonal patterns. But does June really offer a strategic edge, or is it a marketing myth and an overrated idea?
At Valtrix Group, we view seasonality as a secondary but useful filter — especially during periods of low volatility and a lack of macroeconomic catalysts.
What Does History Tell Us?
Historical data on major currency pairs (EUR/USD, USD/JPY, GBP/USD) shows that June often exhibits:
A rise in volatility in the first half of the month — driven by inflation data releases (U.S., EU);
Moderate strengthening of the U.S. dollar, particularly between the FOMC meeting and the quarterly earnings season;
In some years — flat movements caused by low liquidity ahead of the summer holiday season.
However, long-term statistics are mixed. For example, from 2013 to 2023, EUR/USD rose in June in 6 out of 10 years and declined in 4, showing no strong directional bias.
Why Seasonality Doesn’t Always Work
The forex market is driven not only by technicals and statistics but also by macroeconomics, geopolitics, and monetary policy. When major events occur in June (Fed meetings, crises, elections), seasonal patterns can easily be disrupted.
Moreover, algorithmic trading and arbitrage strategies reduce the likelihood of consistent price movements repeating year after year.

Gold (XAUUSD) Trading Setup – Mid-June 2025 Analysis🔰 Gold (XAUUSD) Trading Setup – Mid-June 2025 Analysis
This chart represents a strategic price action-based setup on Gold (CFDs on Gold – US$/Oz) using a 15-minute timeframe. It includes clearly defined entry zone, support/resistance levels, and profit-taking targets (TP1, TP2) for both bullish and bearish scenarios.
🔍 Current Market Context
Current Price: ~$3431.77
Structure: The price has been in an upward trend with a consolidation phase forming near the key mid-zone.
Highlighted Zone: A decision zone is marked in red (between ~$3422 and ~$3418), acting as the key liquidity zone or breakout area.
📈 Bullish Bias
If price breaks and holds above the red zone:
✅ TP1: $3480
✅ TP2: $3580
These levels act as short- to mid-term bullish targets based on projected extensions of recent upward momentum.
📉 Bearish Bias
If price breaks and holds below the red zone:
✅ TP1: $3320
✅ TP2: $3260
This indicates a possible reversal or correction phase, with targets derived from recent swing lows and support areas.
📌 Trading Notes
The blue shaded areas represent target zones for partial or full exits.
Red zone is the critical breakout decision point.
Ideal for breakout or pullback traders.
Can be combined with volume/confirmation indicators (e.g., RSI, MACD, or price action candles) for entry timing.

DOLLAR I Weekly CLS I Model 2- Target CLS HighHey, Market Warriors, here is another outlook on this instrument
If you’ve been following me, you already know every setup you see is built around a CLS range, a Key Level, Liquidity and a specific execution model.
If you haven't followed me yet, start now.
My trading system is completely mechanical — designed to remove emotions, opinions, and impulsive decisions. No messy diagonal lines. No random drawings. Just clarity, structure, and execution.
🧩 What is CLS?
CLS is real smart money — the combined power of major investment banks and central banks moving over 6.5 trillion dollars a day. Understanding their operations is key to markets.
✅ Understanding the behaviour of CLS allows you to position yourself with the giants during the market manipulations — leading to buying lows and selling highs - cleaner entries, clearer exits, and consistent profits.
🛡️ Models 1 and 2:
From my posts, you can learn two core execution models.
They are the backbone of how I trade and how my students are trained.
📍 Model 1
is right after the manipulation of the CLS candle when CIOD occurs, and we are targeting 50% of the CLS range. H4 CLS ranges supported by HTF go straight to the opposing range.
📍 Model 2
occurs in the specific market sequence when CLS smart money needs to re-accumulate more positions, and we are looking to find a key level around 61.8 fib retracement and target the opposing side of the range.
👍 Hit like if you find this analysis helpful, and don't hesitate to comment with your opinions, charts or any questions.
⚔️ Listen Carefully:
Analysis is not trading. Right now, this platform is full of gurus" trying to sell you dreams based on analysis with arrows while they don't even have the skill to trade themselves.
If you’re ever thinking about buying a Trading Course or Signals from anyone. Always demand a verified track record. It takes less than five minutes to connect 3rd third-party verification tool and link to the widget to his signature.
"Adapt what is useful, reject what is useless, and add what is specifically your own."
— David Perk aka Dave FX Hunter ⚔️

DXY – Key Level Broken, More Downside Ahead?Hello Folks , Long time no see .
The US Dollar Index (DXY) just broke below 106.5, and things are getting interesting. The trend has been weakening, and price is now sitting at a crucial zone.
📌 Here’s what I’m watching:
107.66 is the big resistance. If price can reclaim it, bulls might have a chance.
105.48 & 104.46 are the next major support levels.
👀 My Take:
If we stay below 106.5, I expect more downside towards 105.4 and maybe 103.3. If price bounces and reclaims 107, I’ll reconsider.
What’s your view? More downside or a bounce coming? Drop your thoughts below! 🚀🔥
🚨 Disclaimer:
Just sharing ideas here—this isn’t a trade advice . Everyone sees the market differently, and the goal is to improve our analysis, not tell anyone what to do. At the end of the day, your trades are your call, your responsibility. Trade smart! 🚀📊

XAUUSD M15 2025/05/15Stick to your stop loss to protect your trades - Manage your positions patiently until you hit the target - Profit always in risk, take the risk or lose the chance

AUDUSD I Weekly CLS I KL - OB I Model 2, Target - CLS HHey, Market Warriors, here is another outlook on this instrument
If you’ve been following me, you already know every setup you see is built around a CLS range, a Key Level, Liquidity and a specific execution model.
If you haven't followed me yet, start now.
My trading system is completely mechanical — designed to remove emotions, opinions, and impulsive decisions. No messy diagonal lines. No random drawings. Just clarity, structure, and execution.
🧩 What is CLS?
CLS is real smart money — the combined power of major investment banks and central banks moving over 6.5 trillion dollars a day. Understanding their operations is key to markets.
✅ Understanding the behaviour of CLS allows you to position yourself with the giants during the market manipulations — leading to buying lows and selling highs - cleaner entries, clearer exits, and consistent profits.
🛡️ Models 1 and 2:
From my posts, you can learn two core execution models.
They are the backbone of how I trade and how my students are trained.
📍 Model 1
is right after the manipulation of the CLS candle when CIOD occurs, and we are targeting 50% of the CLS range. H4 CLS ranges supported by HTF go straight to the opposing range.
📍 Model 2
occurs in the specific market sequence when CLS smart money needs to re-accumulate more positions, and we are looking to find a key level around 61.8 fib retracement and target the opposing side of the range.
👍 Hit like if you find this analysis helpful, and don't hesitate to comment with your opinions, charts or any questions.
⚔️ Listen Carefully:
Analysis is not trading. Right now, this platform is full of gurus" trying to sell you dreams based on analysis with arrows while they don't even have the skill to trade themselves.
If you’re ever thinking about buying a Trading Course or Signals from anyone. Always demand a verified track record. It takes less than five minutes to connect 3rd third-party verification tool and link to the widget to his signature.
"Adapt what is useful, reject what is useless, and add what is specifically your own."
— David Perk aka Dave FX Hunter ⚔️

BTC on weekly to 73kClearly we can see bitcoin is down on a weekly chart. We just started to go up on a daily, just to find it's right fan line to a path down. Daily shows resistance at 93k, so it will make a double top - a right sign for swing down.

The Four Fears of Trading and the Law of HarmonyTrading is not just about charts, strategies, and numbers. It’s a psychological battlefield, where fear dominates — but there’s also an often-overlooked factor: harmony. WD Gann’s Law of Harmony teaches that markets, like people, have unique vibrations. When you trade in sync with stocks or currency pairs that ‘resonate’ with you, your confidence and performance improve. Let’s explore how combining Gann’s insights with an understanding of the Four Fears of Trading can create a balanced, more successful trading mindset.
What Is the Law of Harmony?
The Law of Harmony is one of WD Gann’s foundational principles. Gann believed that everything in the universe moves according to natural laws, and markets are no different. Each stock, commodity, or currency pair has its own ‘vibration’ or rhythm — a unique frequency that determines how it behaves. When a trader finds a market whose vibration aligns with their own psychological makeup and trading style, they experience greater clarity, confidence, and success. This is trading in harmony.
Gann used this principle to select markets that matched his analysis style, making it easier to forecast price movements. He believed that recognizing harmony between the trader and the market was just as important as the technical setup itself. He meticulously studied time cycles, price patterns, and astrological influences to find markets that moved in predictable, harmonic ways — and traded only those that felt “right.”
In essence, Gann’s Law of Harmony is about working with the market’s natural flow, not against it. When you’re in sync, trades feel clearer, decisions become easier, and success feels almost effortless.
The Four Fears of Trading
In a recent Twitter poll I conducted, 45% of traders admitted that fear was their toughest emotional challenge — more than greed, hope, or overconfidence. Fear in trading can be broken down into four key categories: the fear of losing money, fear of missing out (FOMO), fear of being wrong, and fear of leaving money on the table. Let’s explore each one — and how the Law of Harmony can help conquer them.
1. Fear of Losing Money
This is the most common fear among traders — nobody wants to lose money. The reality, however, is that losses are an inevitable part of trading. Trading is a game of probabilities, with each trade having around a 50% chance of success.
Many traders react to losses with irrational decisions like closing trades too early or holding onto losing trades in the hope they’ll bounce back. This behavior stems from loss aversion — the natural human tendency to avoid losses more than we seek equivalent gains.
How the Law of Harmony helps:
Trade assets that ‘vibe’ with you. Some stocks or forex pairs will naturally feel clearer and easier to predict — that’s harmony.
Stop forcing bad trades. If you consistently lose on a specific pair, stop forcing it. It might not align with your psychology.
Backtest your system. Develop and backtest a trading system over multiple market conditions (trending, sideways, volatile). When you find one that feels ‘right,’ stick with it.
2. Fear of Missing Out (FOMO)
FOMO drives traders to jump into unplanned trades, often near market tops, for fear they’ll miss a big move. This leads to poor entries, increased risk, and reduced potential rewards. The irony? These impulsive trades often result in losses.
How the Law of Harmony helps:
Shift your mindset from “making money” to “following a process.” Money is a byproduct of trading in harmony with the right instruments.
Accept that the market is endless. Opportunities are like waves — there’s always another one coming. When you trade in sync with a market’s natural rhythm, better setups come to you.
3. Fear of Being Wrong
From childhood, we’re conditioned to avoid mistakes. In trading, however, losses are not failures — they’re feedback. The fear of being wrong can cause traders to hold onto losing trades, cut winners short, or avoid taking trades altogether.
How the Law of Harmony helps:
Focus on pairs or stocks that feel intuitive. When you feel more connected to an asset’s behavior, the fear of being wrong diminishes.
Accept that not every market resonates with you — and that’s okay.
Embrace losing trades as a natural part of the business. Even in harmony, some trades won’t work — that’s part of the rhythm.
4. Fear of Leaving Money on the Table
This fear emerges when a trader exits a trade too soon, only to watch the market continue in their favor. It’s frustrating, but trying to capture every last pip is a recipe for disaster. Markets are unpredictable, and no one catches the exact top or bottom consistently.
How the Law of Harmony helps:
Trust the market’s rhythm. If you’re aligned with the right instrument, more opportunities will come.
Define your exit strategy before entering a trade.
Let go of perfection. Accept that partial profits are better than no profits. In a harmonious market relationship, consistency matters more than squeezing every move.
Final Thoughts: Finding Harmony in Trading
Fear is a natural part of trading — it’s part of being human. The goal isn’t to eliminate fear but to manage it. By identifying which type of fear affects you the most and combining it with Gann’s Law of Harmony, you’ll make more rational decisions and improve your long-term performance.
Imagine you’re at a party. A mutual friend introduces you to a new group of people. You might vibe with some, while others give you an uncomfortable feeling. Stocks and forex pairs work the same way. You naturally gel with some, understanding their behavior and making profitable trades, while others consistently lead to losses.
The secret to long-term trading success is not forcing trades or chasing markets — it’s about finding what resonates with you. Focus on the process, trade in harmony, and the profits will follow.
Remember: The market doesn’t reward those who fight it. It rewards those who flow with it.
Happy trading!

Relax guys! Technical Analysis predicted this a month ago. It's okay traders, markets are allowed to go Down too. In fact it's responsible of them to, as that is what makes a healthy market cycle
I called this downtrend a month ago, using a step by step process I use for all markets.
Give it another week or two, and the uptrend will return

Setting up a new cycle and moreThe market has seemingly moves through it's period of consolidation
Now that it has built up it's energy I suspect there will be bigger moves happening
From what I can tell, the market is in a downtrend, so as a trader we buy high, sell low (trade with trend)

EUR/USD – Breakout or Fakeout? Key Levels to Watch!Hello again
EUR/USD has been pushing higher, testing a key resistance zone. The question is will it break through or get rejected?
📌 Here’s what I’m watching:
1.0541 is the key level price is hovering around. A clean break could push us towards 1.0644 & 1.0747.
If it fails to hold, we might see a retest of 1.0450 and 1.0427.
👀 My Take:
If price stays above 1.0541, we could see bullish continuation. But if we drop below 1.0450, then this might have just been a fakeout before heading lower.

GOLD SHORT VIEW
Hello Traders, here is the full analysis for this pair,
let me know in the comment section below if you have any questions,
the entry will be taken only if all rules of the strategies will be
satisfied. I suggest you keep this pair on your watch list and see if
the rules of your strategy are satisfied.
Dear Traders,
If you like this idea, do not forget to support it with a like and follow.
PLZ! LIKE COMMAND AND SUBSCRIBE


Constellation DAG Token - Gann SquareDAG appears to be breaking out. Current resistances are the Ichimoku Cloud, 5x0 and 5x1 Gann arcs, 4th Gann level, and the 200 week SMA. This is not even in the top 300 market caps, so an explosive move could be in order.
The price increase from the low to the first impulse high was 0.0214, so I used 214 days duration to size the Gann square. Note that the 1x8 is very close to the first impulse high and the first pivot high. The 4 and 5 arcs are acting as support and resistance during consolidation. Based on the accumulation cylinder breakout and retest in a bull flag, I suspect this is heading way higher. I also suspect that the 1x1 or top level will be retested before 4/16/2025.

USD/JPY Short using a GANN Fixed Square & Andrews PitchforksWe have an interesting short setup on the Daily. The highest candle printed was on the 26th Dec 2024 (UTC+2). Although it wasn't a nice 'Signal' candle it has traded sideways ever since. From a technical/geometric lens we can see heavy resistance against the angles and arcs of this perfectly scaled Gann Fixed Square including 2 median line touches and a "sliding parallel" exhaustion gap. Note: The 26th Dec from an Astro perspective has very interesting planetary alignments including a Price and Time Square Out, however, the details of this is beyond the scope of this idea. Inevitably the market will decide.

SYM is expected to cross 82 level in next 06 to 24 months.SYM consistency showing positive growth and it is expected to cross 20 level soon and then 35, 51, 67 and 82 in next 12 to 24 months
Note: This is not a buy/sell call.
Use stop loss.

Loads could rise 65% Loads is maintaining its support level of 14.5 and it is heading to resistance of 18.3 than 22 and 25.7
Positive momentum of its hows it could cross 22 and 25 levels. As per current price 15.55 it is gain of 41.5% and 65%
Stop loss is at 14.2
Note: This is not a buy/sell call. Trade at your own will

SPX - chatGPT does Gann# **SPX Forecast and Advisory Report**
### **Date**: December 8, 2024
### **SPX Close**: 6090.28
**Prepared by**:
---
## **Introduction: Navigating the Path Ahead**
As of December 8, 2024, the SPX stands at 6090.28, reflecting remarkable resilience amidst evolving economic conditions. This forecast report, grounded in Gann's legendary methodologies and refined through advanced analytical techniques, projects SPX price and time cycles through 2047. By leveraging historical low/high/low sequences (seven distinct sets of pivots), this report offers investors a clear and actionable roadmap for navigating the years ahead.
---
## **Price and Time Predictions (2024–2047)**
### **2024–2027: Optimism with Strategic Caution**
- **2025**:
- **Price Target**: ~6900 by mid-year, marking a strong continuation of the current uptrend.
- **Time**: Potential short-term correction in **Q4 2025**; use this as a buying opportunity.
- **2026**:
- **Peak**: ~7200 in **late Q1 2026**, followed by a cyclical correction.
- **Bottom**: ~6400 projected for **Q3 2026**, likely driven by macroeconomic pressures.
- **2027**:
- **Rebound**: Market recovery to ~7600 by **Q4 2027**, fueled by renewed growth and easing monetary policy.
### **2028–2032: A Pivotal Era of Growth and Volatility**
- **2028**:
- **High**: ~8000 in **Q2 2028**, with volatility increasing toward year-end.
- **Correction**: Expect a pullback to ~7200 in **Q4 2028**, presenting an accumulation phase.
- **2029–2030**:
- **Breakout**: A new cycle high of ~8500 by **mid-2029**, with intermediate resistance near 8200.
- **Correction**: A multi-quarter decline to ~7500 in **late 2030**, as geopolitical tensions weigh on sentiment.
- **2031–2032**:
- **Climactic Rally**: Surge to ~9000 by **mid-2032**, driven by structural economic shifts.
- **Warning**: Early signs of a long-term cyclical peak emerging; expect heightened volatility into **Q4 2032**.
### **2033–2037: Approaching the Supercycle Top**
- **2033**:
- **Correction**: A significant pullback to ~8100 in **Q2 2033**, followed by a rebound to ~8600 by year-end.
- **2034–2035**:
- **Rally**: Renewed bullish momentum pushes SPX to ~9500 in **mid-2035**.
- **Volatility Spike**: A sharp correction back to ~8800 by **early 2036**.
- **2036–2037**:
- **Supercycle Warning**: Major cyclical low at ~8300 projected for **mid-2037**, with signs of exhaustion in the multi-decade bull market.
### **2038–2042: The Generational Top**
- **2038–2039**:
- **Parabolic Advance**: SPX soars to ~11,000 by **late 2039**, as the final leg of the secular bull market unfolds.
- **2040–2042**:
- **The Ultimate Top**: Market likely peaks near ~12,500 in **early 2042**, signaling the culmination of the supercycle that began in 1932.
- **Structural Shift**: Expect increased volatility and distribution patterns throughout 2042.
### **2043–2047: The Reset Phase**
- **2043–2045**:
- **Bear Market**: Significant declines to ~8500 by **2045**, reflecting the end of the supercycle.
- **Opportunities**: Investors should focus on defensive strategies and prepare for a long-term market reset.
- **2046–2047**:
- **Bottom Formation**: The market stabilizes near ~7500 in **late 2047**, setting the stage for a new secular cycle.
---
## **Investment Strategies Based on Forecasts**
### **2025–2027: Growth with Tactical Adjustments**
1. Focus on growth sectors (technology, healthcare).
2. Use corrections in 2026 as buying opportunities, targeting recovery into 2027.
3. Diversify globally to mitigate geopolitical risks.
### **2028–2035: Exploit Bull Market Peaks**
1. Ride the bullish wave into 2035, but tighten risk management as volatility increases.
2. Reduce leverage and shift to value-oriented investments by 2033.
### **2036–2042: Prepare for the Supercycle Top**
1. Anticipate major market shifts after 2039; position portfolios defensively by 2041.
2. Consider allocating to commodities and alternative assets as hedges.
### **2043–2047: Seizing Opportunities in a Bear Market**
1. Accumulate high-quality assets during the anticipated bear market of 2043–2047.
2. Stay liquid to capitalize on undervalued opportunities during the market reset.
---
## **Conclusion**
This report combines the wisdom of Gann’s methodologies with modern market dynamics to forecast SPX price and time cycles through 2047. Investors are advised to approach the market with both optimism and caution, capitalizing on growth while preparing for inevitable corrections and long-term structural shifts.
---
This version keeps explanations concise while emphasizing actionable insights and predictions. It’s ready for your TradingView audience!

GANN TRADING LESSON: TIME IS MORE IMPORTANT THAN PRICEGANN TRADING LESSON: TIME IS MORE IMPORTANT THAN PRICE – THE CORE OF W.D. GANN’S METHODOLOGY
William Delbert Gann, one of the most enigmatic figures in trading history, built his legendary status on a profound understanding of market movements. Among his many revolutionary insights, none resonate more than his assertion: “TIME is more important than PRICE.” Gann's studies reveal that markets are governed by cyclical laws where TIME dictates market behavior, and PRICE merely reflects the outcomes.
This article delves deeply into Gann’s philosophy, integrating examples, methodologies, and references from his works, to illuminate why mastering TIME can give traders a significant edge.
Understanding the Superiority of TIME in Trading
1. The Foundation of Gann’s Philosophy:
- In his book “The Tunnel Thru the Air”, Gann states, “The future is but a repetition of the past; cycles can be studied and predicted with mathematical precision.”
- This emphasizes that TIME controls market events. Price, on the other hand, is secondary—a mere result of the unfolding TIME cycles.
2. Why TIME is More Important Than PRICE:
- PRICE is Reactive: Price changes happen as a result of events, but those events themselves are determined by TIME cycles. Without the correct timing, price predictions are speculative at best.
- TIME is Predictive: Understanding TIME cycles allows traders to foresee when significant price movements are likely to occur, providing a roadmap for market behavior.
3. The Illusion of PRICE:
- Traders often fall into the trap of chasing prices—buying highs or selling lows—without realizing that markets move within predetermined TIME windows. Gann showed that price breakouts or breakdowns are unsustainable if they occur outside critical TIME cycles.
Key Concepts from Gann’s Methodology on TIME
1. The Law of Vibration: Gann believed that every market has its unique vibration, influenced by TIME cycles. In “The Law of Vibration”, Gann explains that market movements align with natural and cosmic vibrations, which repeat over TIME.
2. Cyclicality of Markets: Markets move in cycles determined by TIME. Gann’s studies revealed major cycles such as:
- The 20-Year Cycle: Markets often exhibit significant highs or lows every 20 years.
- The 60-Year Cycle: This aligns with major economic booms and depressions.
- Planetary Cycles: Gann tied TIME cycles to planetary movements, including the 11.86-year Jupiter cycle and Saturn’s 29.5-year orbit.
3.The Square of Nine and TIME Projections: Gann’s Square of Nine is one of his most famous tools. While often used to predict price levels, it is equally powerful for determining TIME turning points.
Example: The Square of Nine can map out important dates when markets are likely to reverse, based on the angle of price and TIME.
4. Geometry in TIME: In “The Geometry of Stock Market Profits”, Gann emphasized the relationship between price and TIME through angles. A 1x1 angle (45 degrees) represents the ideal balance between price and TIME. Any deviation from this angle signals acceleration or deceleration in the trend.
5. Astrological Influence on TIME: Gann’s work integrates astrology to predict TIME cycles. He studied planetary aspects, transits, and lunar phases to determine when markets would experience significant changes.
Example: Gann highlighted the importance of eclipses, retrogrades, and planetary conjunctions in marking market highs and lows.
Practical Applications of TIME in Trading
1. Time-Price Symmetry: Gann believed that price movements often mirror TIME durations.
Example: If a market drops 100 points over 10 days, it is likely to recover 100 points over a similar TIME interval.
2. Repetition of Historical Cycles:
Gann showed that the 1929 crash followed a similar TIME pattern to earlier financial crises. By studying historical TIME intervals, traders can predict future market events.
Timing Highs and Lows:
3. Use Fibonacci TIME zones to identify when markets are likely to peak or bottom. Combine this with Gann’s techniques, such as using the Square of Nine, for precise predictions.
Seasonality and TIME Cycles:
4. Markets are influenced by seasonal and cyclical TIME patterns. Gann demonstrated that major market reversals often coincide with solstices, equinoxes, and other seasonal turning points.
Examples of TIME’s Importance in Gann’s Predictions
1. The 1929 Stock Market Crash: Gann predicted the crash using TIME cycles, noting that it occurred 60 years after the Panic of 1869 and 30 years after the 1899 bear market.
2. The 1987 Crash: Gann’s methods, when applied to long-term TIME cycles, also align with the 1987 crash. It occurred exactly 58 years after the 1929 collapse, reflecting the repetitive nature of TIME cycles.
The Interplay Between TIME and PRICE
While PRICE is easier to track and analyze, Gann believed that the greatest trading success comes from aligning PRICE movements with TIME predictions. He illustrated this in his “Master Forecasting Course”, where he taught students to:
- Map out major TIME cycles.
- Identify the angles and relationships between TIME and PRICE.
- Use TIME as a framework to validate PRICE movements.
Steps to Master Gann’s TIME Methodology
Study Historical Cycles:
- Identify significant market events and analyze the TIME intervals between them.
Use Tools Like the Square of Nine:
- Plot critical TIME intervals to predict market reversals.
Combine TIME Analysis with Price Patterns:
- Validate price movements with TIME projections to confirm trends or reversals.
Incorporate Natural and Planetary Cycles:
- Use planetary ephemerides and lunar calendars to enhance TIME forecasts.
Conclusion: Why TIME is the Ultimate Edge
Gann’s timeless wisdom teaches us that focusing solely on PRICE is like chasing shadows. TIME is the true master, dictating when markets turn, rally, or crash. By mastering TIME, traders can move from being reactive to predictive, seizing opportunities before they manifest.
As Gann said, “When TIME is up, price will reverse.” This simple yet profound truth encapsulates the essence of his methodology. Focus on TIME, and the illusion of PRICE will reveal its secrets.
Join the Discussion:
Do you agree with Gann that TIME is the most critical factor in trading? Share your thoughts and experiences below!

How I Execute Trades Using Gann’s Square of 9Here in this example, I have used the Square of 9 method to predict a potential market reversal and executions. W.D. Gann, a legendary trader and analyst, is renowned for his pioneering techniques in financial markets.
Among his tools, the Square of 9 stands out as a remarkable system to predict market turning points with precision. In this blog, we’ll explore the fundamentals of the Square of 9, how it works, and how we can use it to improve timing and decision-making in the markets.
What is the Square of 9?
The Square of 9 is a spiral-based numerical grid where numbers are arranged in a square, starting from 1 at the center and spiraling outward. Each number on the grid has angular relationships with other numbers, which Gann believed could forecast significant market movements.
For instance:
Numbers at the same angles (e.g., 39, 67, 105, 150) share a relationship that can signify potential turning points in the market.
By marking these numbers and aligning them with trading days, we can identify key dates for potential price reversals.
Core Assumptions in Price Dynamics
Gann’s methods rely on two key assumptions:
Repetition in Price and Time: Price tends to follow specific patterns or laws over defined intervals of time.
Structured Alternation: The up-and-down movements of price are not random; they alternate in a structured, periodic manner.
These assumptions form the foundation for analyzing price action through tools like the Square of 9.
How to Use the Square of 9
Step 1: Identify Key Market Extremes
Begin by locating significant highs or lows on a price chart. These extremums act as the starting point for your calculations.
Step 2: Calculate Calendar Days
Count the number of calendar days between:
Two highs,
Two lows, or
A high and a low.
Step 3: Locate the Number on the Square of 9
Find the calculated number (e.g., 39) on the Square of 9. Then, mark other numbers that lie on the same angle or corner, such as 67, 105, or 150.
Step 4: Predict Turning Points
Mark these numbers as potential future dates. On these dates, observe the market closely for signs of reversals or continuations.
Practical Example
Now let's Analyse GOLD. In this example we will take a daily candle that is making an all time high. From that high we will count the very next extreme high or low. How many trading days it takes to reach that price point and make a reversal? - 40 Trading days.
Now we will look for the number 40 in Gann square of 9 table. and the very next probable execution or reversal we will get after 70 days according to the table.
We see sharp price movement after 70th day and then at 180th day where we can place our order and execute with other confirmations.
Benefits of Using the Square of 9
Enhanced Timing: Pinpoint potential reversal dates, helping traders refine entry and exit strategies.
Objective Forecasting: Use a structured approach to reduce emotional decision-making.
Improved Accuracy: Combine the Square of 9 with other technical tools for more reliable predictions.
Conclusion
The Square of 9 is a powerful tool for traders who seek to integrate time and price analysis into their strategies. By understanding its mechanics and applying its principles, you can anticipate market turns with greater confidence.
As with any trading tool, practice and observation are essential. Study past market movements using the Square of 9 to develop your intuition and skill. With dedication, you’ll unlock the potential of this fascinating method and take your trading to the next level.
