Small scale Gann IdeaThis is my little Idea based on Gann Square Tool.
I think XRP will rise to old highs!
Good luck to all traders out there!
Gann Square


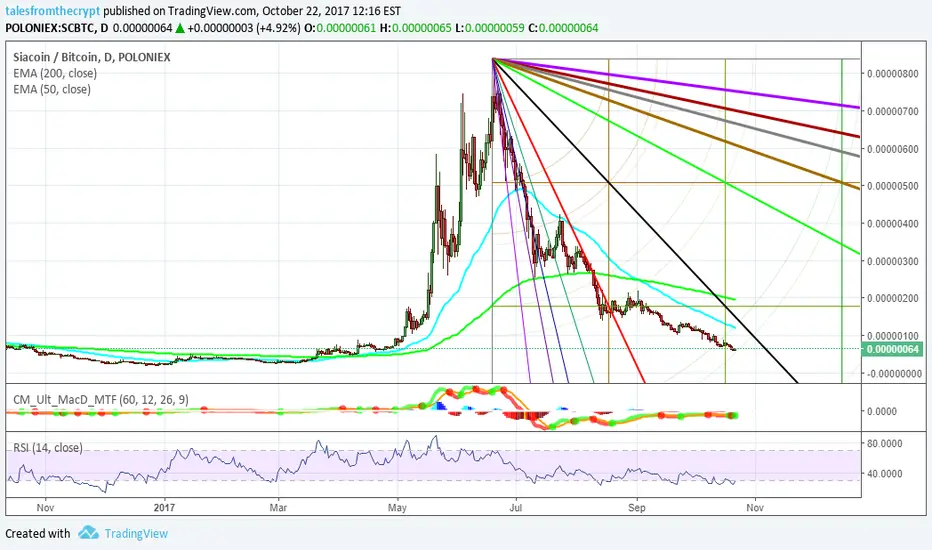
Siacoin potential gann fan breakoutUsing gann fan it looks like SC 0.52% could soon cross the 1/1 (black) trendline . Entry in the upper 50s to very low 60s, TP1 at ~120, or the 50 day ema, TP2 ~185 estimated 200ema

Bullish EURUSD daily chart with Gann squares, nearing resistanceThis is a follow on from a previous idea here: . The price is nearing support areas so I have now identifies entry points. I have outlined two profit taking opportunities. outlined on the chart.
The resistance is from the previous lows and Fibonacci retracements which line up with the Gann analysis.

Momentum on the Gann indicator looks like it may find supportThe 2x1 line looks too far away to test so we may find support earlier.
Moves in copper and iron ore also support this, recent price action and volume looks good also.

Bullish EURUSD daily chart with Gann squares, finding entriesWith price respecting the Gann arc, I am looking for buying opportunities at the support areas No.1 and No.2. These are also coincide with recent support and resistance areas. I have not placed definitive orders yet as I am watching price action closer to the support areas. I will update as the price action moves into closer positioning.


IOTA might be close to its low!!It is reaching gann square 3rd arc, indicating a possible return of trend. Besides, a strong pitch fork support is also around this level. The inverse trend of CCI and RSI with price increases the confidence that the bearish trend might be close to an end. IOTA should definitely be watched carefully recently!!

The next price levels for LSK, We could see $20 v soon.Hello everybody
if this strong bull move continue we could see 0.0025 BTC in few days or maybe less , else 0.0019 BTC will be first target then continue to 0.0023.
price could face some weak hands sellers But finally we will go to $10-$20 one way or another or maybe more.
Lisk now is setting on $750M market cap and most of holder are waiting 1-2 Billion market cap.

Very Strong LONG sign in LSK , This coin is going to boom v soonWe can say first target is: 0.0012 BTC
Second target is absolutely unknown,


Possibility: ETH to ~186 in approx. 12 hrsIf this bear trend continues, ETH may reach ~186 in about 12 hrs, at which point I think it has a good possibility of having a small rebound to ~195. I don't think this rebound will last, however, and ETH will continue its downward trend, perhaps on a journey leading to ~150.

Possible ETH Behavior up to August 1st using Gann SquarePossible ETH Behavior up to August 1st (and beyond) using Gann Square
ETH continues its bearish tendencies it seems. It may fall through the blue arc in a severe drop to the first arc. Potential entry here (green circle) with an exit (red circle) at the 1x1, which ETH is unlikely to punch through upwardly in the near term.

ETH Possible Behavior Before August 1st - Using GANNUsing the Gann chart, I think we could see ETH bottoming-out 185-173. According to this setup, it doesn't seem that it will go lower, but rather the bear trend will reverse and hopes will begin to soar again. The red circle shows where the next rally will end and then more rallies? Maybe not and the green represents a possible buying opportunity, being at the 5th bearish arc. The large, blue rectangle represents the support zone. When ETH bottoms-out and begins its upward move along the 5 arc, a new gann square will be needed and I think it will be a bullish one.

Bitcoin movesExpecting growth for btc. Volume rising, the correction was stopped by 38.2 fib level. But watch it close at the end of july - start of august cause of possible hard forks, cause its hard to predict what can happen with price at that time.

BTC. Watch it close now.Another triangle forming for BTC. Last time there was a down breakout and the price moved from 2500 to 2200. Lets see what can this triangle and h&s patterns bring today.


BTC after the 14th of June, blood on the streets?After yesterday crazyness let's get our head back to the game... Let's face it, Bitcoin (and Alts in general) needed a big correction, yesterday was an energy point and regarding the outrageous rise of crypto market caps it was almost predictable. Question that remains, is it over or will we see a bounce soon?
Well, from the bearish perspective of the Gann Square I'd say we might see a bounce already, I'll publish some extra charts in the comment as you may want to wait for a proper confirmation of the reversal (basically if a candle closes bellow the 1st Arc Pair that might suggest the start of a new correction wave) but aggressive trader might want to open a long position here...
