GAP TO FINISH FILLING on MONDAY?? $SPYPossible gap to finish filling tomorrow 4 point possible short, hm?? lets see hopefully some consolidation during pm so we could possibly catch the move on puts ? #15min
Gap

Delta Airlines Gap FillLooking at the current state of the market, world events, increasing of oil and precious metals, the overall market looks like it wants to continue a downtrend.
There's a gap set on May 22 and May 26, 2020 that has yet to be filled. The potential bear market can bring Delta towards that gap to fill it, then back up to fill other gaps above.
Let me know what everyone thinks!

Outlook on SPY leading into the weekendI know this is a little bit of a messy chart. Alot of trend lines and yellow rectangles-
Here is the breakdown and outlook for SPY leading into the weekend and next week-
I am anticipating a small correction this morning that will lead us to Pre market gap fill with a target of 426.44. This will achieve gap fill and trendline support (Green box for reference)
From there, i will be looking for confirmation of strength and bounce and will enter a long position (Put Credit Spreads likely) where my next bullish target will be 437.10. This is my breakout target for the massive triangle we have seen (we can see part of it in the chart) AND it is a gap level that will be filled once hit. (Purple box for reference)
There is a much larger gap towards the bottom of the chart. I do anticipate us to fill this gap at some point in time. However, generally when there is a large trend reversal, we almost always leave a gap for us to come back and respect.

Bitcoin CME GAPs (24/26K, 18/19K, 11.2K)Here are the CME GAPs for Bitcoin (BTCUSD).
Thanks @MagicCannon for pointing it out in my previous trade idea.
Notice that the ~$11,200 GAP coincides with the ~84% correction pattern:
Hit LIKE & COMMENT!
Namaste.

Facebook May Run Up Towards The Gap From HereWill be buying calls within the lower 200 range expiring between April and May in an attempt to potentially benefit from this potential rise to fill the gap.
PYPL: A possible REVERSAL sign on it!Hello traders and investors! Let’s see how PYPL is doing today!
The trend is clearly bearish on it, however, it is reacting nicely today. This reaction came at the right time, as PYPL is trading at a support area, and we are quite far from the 21 ema as well. A reaction was expected, and it is convenient.
We don’t see any bullish structure, and this reaction could be just another dead cat bounce, but if PYPL closes above the red line at 94.54 today, we might see a false breakout from a support level.
In the daily chart, we see that by holding at the $ 94.54, PYPL might trigger a double bottom chart pattern. The $ 113 would be the technical target, however, if it breaks this point, the next resistance would be the gap area at $ 170.
However, this would be a reversal thesis, and since we don’t see a clear reversal in the 1h/D charts, let’s hold this idea for now, and just pay attention to the signs it’ll give us near the support at $ 94.
PYPL looks promising, and I’ll keep you guys updated on this, so remember to follow me to keep in touch with my daily analyses.

NVDA: Time to BUY the DIP? Important Key Points!Hello traders and investors! Let’s see how NVDA is doing today!
First, in the 1h chart, it is retesting the previous support level, and it seems it wants to react. We are far from the 21 ema, and the stock looks oversold.
The $ 246 is the next resistance to work with, and if NVDA reacts now, it’ll be easy to see it going up to this level again. The $ 209 is a very good support level, technically the best place for NVDA to react, and you’ll understand why soon.
Remember, we have an open gap (yellow square) which might help the price to retest the $ 269 (green line) again.
In this chart we understand better why this is the best place for a bullish reaction. NVDA is trading at a very important support level (black line), which was support for the stock multiple times in the past. To me , this might be a great time to buy the dip, as long as we see some confirmation as soon as possible.
Since NVDA is dropping with low volume, the stock is more sensitive to reactions (bullish or bearish). A good reaction in the 1h chart might be an incredible buy sign, but let’s be careful, as the daily chart is still bearish.
Only by breaking the descending purple trend line NVDA will become bullish in the daily chart again. I’ll keep you guys updated on this, as usual, so remember to follow me to keep in touch with my analyses.

SPX: What could save it from the 4k?Hello traders and investors! Let’s see how the SPX is doing today!
Since the last time it hit the 21 ema, it seems we had another DCB and the index is again at its support level. Yesterday’s volume was quite high, and if it loses the 4,167 today, the next target will be the next support at 4,056.
So far, the trend is bearish, and there’s nothing indicating it’ll recover from here. Let’s take a look at the 1h chart for more clues:
In the 1h chart the index looks oversold, and we have two open gaps to fill. The Breakaway Gap at 4,472 would be a clear target, but we must see a clear bullish structure first, and so far, there’s nothing bullish on it.
If the index holds at the red line at 4,161 it’ll be a good sign, but in my view, we must see more patterns in order to call it a buy again. I’ll keep you guys updated every day on this, so remember to follow me to keep in touch with my daily updates.

EURGBP Bearish swingOn weekly (1W) and daily (1D) structure is aligned, with a bearish trend. We observe several structure breaks at 4h and 2h time frame, it also shows weakness in creating a possible bullish structure change. Throughout the range, the price has formed accumulation zones (Liquidity) and followed by a breakout of the liquidity zone (SPRING).
Continuing in favor of the fundamentals we can have a correlation with our confluences. We mark our Point of Interest (POI) at 0.84305, which is an OB in the 4h timeframe, and we see a liquidity zone below, which the price will break. In relation to the trend we will break the point 0.84240, which would be our 1st TP. The next TP would be 800 Pips, since the next Point of Interest (POI) is on a weekly reversal bar at 0.77000.

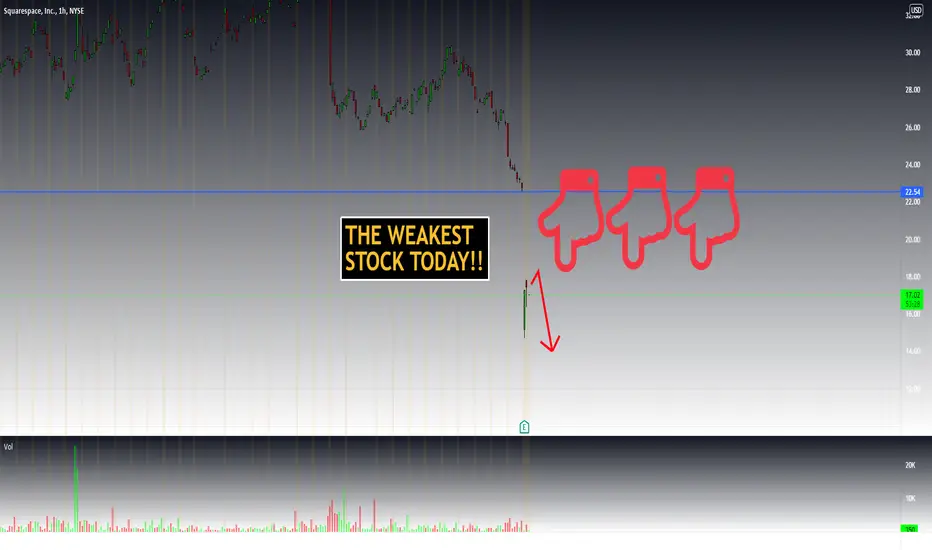
SQSP intraday Short ideaToday's trading idea is focusing on NYSE:SQSP
The stock is gapping down to $17.5 (pre-market) after worse than expected 2022 revenue expectations.
The stock broke an all-time low of $22.43 that now became a resistance level.
The idea is to go Short at the open when it will try to move higher and fails. (What we call a gap and Go)
XAUUSD (Potential Entry At 1974.38 and Exit at 2001.01)Watch how XAUUSD responds to price level 1974.38. There is a gap at 1974.38.

The Gap (NASDAQ: $GPS) Ready For Reversal On Earnings Beat! 💰The Gap, Inc. operates as an apparel retail company. The company offers apparel, accessories, and personal care products for men, women, and children under the Old Navy, Gap, Banana Republic, Athleta, Intermix, and Janie and Jack brands. Its products include denim, tees, fleece, and khakis; eyewear, jewelry, shoes, handbags, and fragrances; and fitness and lifestyle products for use in yoga, training, sports, travel, and everyday activities for women and girls. The company offers its products through company-operated stores, franchise stores, Websites, third-party arrangements, and catalogs. It has franchise agreements with unaffiliated franchisees to operate Old Navy, Gap, Athleta, and Banana Republic stores and websites in Asia, Europe, Latin America, the Middle East, and Africa. As of March 04, 2021, the company had 3,100 company-operated stores and 615 franchise stores. It also provides its products through e-commerce sites. The Gap, Inc. was founded in 1969 and is headquartered in San Francisco, California.

COIN: The most important resistance it MUST break!Hello traders and investors! Let’s see how COIN is doing today!
First, in the 1h chart, we see a clear bull trend, as COIN is doing higher highs/lows, and it is trading above the 21 ema. In addition, we just hit a support level at the black line ($ 162.55 area), and in this scenario, the gap at $ 220.97 is a technical target.
It is doing another gap today, and we can’t discard the idea of a pullback to the 21 ema, but remember: Pullbacks are natural movements. As long as we don’t see a bearish structure, like a Double Top, a Bearish Pivot Point, an Head and Shoulders, etc., we can’t say COIN will reverse.
However, we must be very careful at the $ 220 area, because it is very close to the most important key point on COIN, as evidenced in the daily chart:
The red line around the $ 213 has been working as a support/resistance multiple times in the past, and it might work as a resistance again. In my view, COIN would need a stronger bullish structure seen in the daily chart in order to break this red line for good.
Unlike the 1h chart, the trend is still bearish in the daily chart, therefore, I’ll stick with my idea that it need to do a better bullish structure in order to reverse. Let’s pay attention to the $ 213 area!
I’ll keep you guys updated on this, so remember to follow me to not miss any of my future analyses!

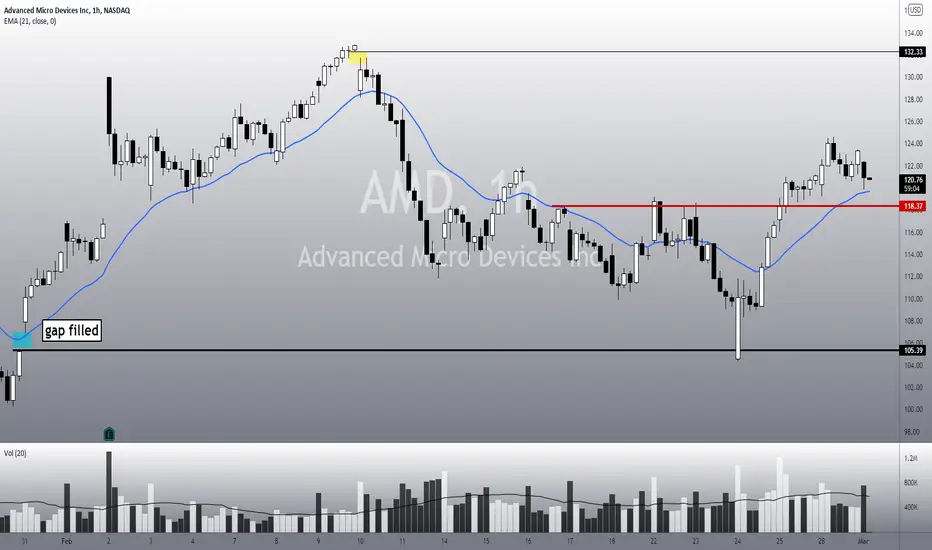
AMD: Trend analysis + Important KEY POINTS to watch!Hello traders and investors! Let’s see how AMD is doing today!
First, in the 1h chart, AMD filled the gap at $ 105, as we were already expecting, since it couldn’t trigger any bullish structure before, and now it is finally reacting.
It is curious to notice how technical analysis works amazingly well on some stocks. In the end, when the war was finally declared, AMD crashed just to fill our gap, and now it is going up as usual.
Now, we have a bull trend for the short-term, as we see higher highs/lows, and a pullback to the red line at $ 118 wouldn’t be scary at all. It must not lose this red line, though, otherwise AMD would need to do another bullish structure to remain bullish.
Our last gap at $ 132 is now a realistic target to aim.
In the daily chart, the trend is still bearish, but since AMD is breaking its 21 ema, we might have the beginning of a reversal for the mid-term, especially considering how strong the momentum in the 1h chart is.
I like the high volume, and it seems AMD wants to reverse. Again, let’s pay attention to the $ 118 area in the 1h chart, and wait for more bullish structures in the daily chart. I’ll keep you guys updated on this.
Remember to follow me to not miss any of my future analyses.
SPX: The most important SUPPORTS/RESISTANCES to work with!Hello traders and investors! Let’s see how the SPX is doing today!
We see a correction today, which is fine, but if it loses the 4,333 again, it could trigger a bearish pivot point, leading to a sharper drop, probably to one of its Fibonacci’s Retracements. A drop to the 61.8% retracement would be acceptable.
It is important to stress how important the 4,333 is. As evidenced by the red circles, this point was a previous support/resistance multiple times in the past, and if the index loses this point again, it won’t be a good thing. In addition, this point is very close to the 21 ema, making it a dual-support level.
However, if the index reacts near this dual-support area, the Breakaway Gap at 4,472 is an easy target.
To me, a correction is acceptable, but we have yet to retest the 21 ema in the daily chart, at least. Last week, we just hit a very strong support level in the daily chart, and the volume is increasing again.
In the daily chart, the trend is still bearish, and I would be more convinced of a mid-term reversal only if the index triggers the pivot point seen in the 1h chart, at 4,388. For now, let’s patiently wait for more signs.
I’ll keep you guys updated every day on this, so, remember to follow me to keep in touch with my daily analyses!

Playing the GAPSPre and After Market gaps can be a good way to analyze a chart and profit big when day trading

NVDA: Next target and the most important resistances!Hello traders and investors! Let’s see how NVDA is doing today!
In the 1h chart, it is breaking the pivot point at $ 242.14, which is great, but it seems it is losing strength now. There’s a reason for this, and I’ll explain later.
For now, let’s keep in mind that the bias is bullish in the short-term, however, a pullback to the 21 ema again wouldn’t be a reason to panic. In fact, it could be another opportunity to buy.
The last gap (yellow square) is going to work as a magnet for us, therefore, the $ 269 area is a technical target for NVDA. Now, why is it losing strength today?
In the daily chart, the trend is still bearish, and NVDA just hit its 21 ema again. This point is a technical resistance. But to me, the most important resistance to break is the purple trend line, as we see many top levels at this line.
The reaction seen in the 1h chart is a good one, and might be the beginning of something great, but NVDA still has its challenges and the situation is delicate.
The trend is bullish in the 1h chart, but bearish in the daily chart. Who will prevail? Only time will tell. Either way, I’ll keep you guys updated on this every day, so remember to follow me to keep in touch with my analyses!

TSLA: A nice REVERSAL CHART PATTERN!Hello traders and investors! For the surprise of no one here, TSLA is going up today, triggering an important bullish pattern that could reverse the trend. Let’s see what’s going on.
First, in the 1h chart, TSLA did a sideways correction, just to form a Bullish Pennant chart pattern, a powerful pattern that usually reverses the trend when triggered.
Bullish Pennant triggered. Breakout of a pivot point at $ 819.49. Trading above the 21 ema, which is pointing up now. All of this indicates a bull trend. What’s the target? As I already mentioned in my analysis on Feb 23, the $ 920 – I didn’t change it since then.
The main challenge here is the 21 ema in the daily chart, as I don’t see TSLA breaking it that easily. However, pullbacks are expected, and we must not panic when we see them occurring. The problem is that TSLA must not do any bearish structure after this; otherwise, the market may understand this pullback as the beginning of a Dead Cat Bounce.
Whether this will be a DCB or not doesn't matter, as the only thing that truly matters is to react properly to the signs. I’ll keep you guys updated on this every day, so remember to follow me to not miss any of my future analyses!

SPX: Giving us ANOTHER opportunity to BUY?Hello traders and investors! Let’s see how the SPX is doing today!
First, in the 1h chart, it is doing a pullback to the 21 ema, a natural movement that was expected by us. In my last analysis (link below) I mentioned that if you missed the last buy on SPX that’s ok, as eventually we would see another pullback, and only then, we might see another buy.
This scenario is materializing; however, we have yet to see a buy sign near this support. Any bullish reaction at the 4,333 area and the 21 ema would be a good sign. As long as we don’t see one, we can’t say it is a buy again.
In the daily chart, we just see a small candlestick, with low volatility. This indicates that the market is pricing the latest events very quickly. Technically speaking, a retest of the 21 ema is expected, and only then, we’ll see if this is a Dead Cat Bounce or not.
It is not a secret to anyone that my goal is to beat the SPX. Right now, I see many incredibly discounted stocks and it is one of the best opportunities for swing traders like me. It is a rare moment, indeed!
Either way, I’ll keep you guys updated every day on SPX, so remember to follow to not miss my future analyses!

MARKET CRASH! PAYPAL $PYPL ANALYSISHey all, I know this is some of the first Stock analysis that I have put out on trading view, but for those of you who know me, I have been calling moves in the stock market on point since 2018. Known for:
Called Shocktober of 2018
Called the Crash of 2020 (my call was for 3 days after the start of the crash, since COVID was the black swan catalyst that started its dive).
Called the irregular V-Bottom Recovery for the Crash of 2020.
Called the now forming start of the Crash of 2022 that Ive projected it to happen in Q1 2022, since the start of 2021. This Crash will be an overall trend reversal across major indexes, due to price action reaching a test of a macro scale .618 Fibonacci Extension. I've projected that the crash starting in 2022, will play out a similar style to that of the Bubble Pop that occurred in 1929, except due to the extensive size of the bubbled market we have today, this crash we will see in the market, will make the crash of 1929 look like its little BEEYYOTCH. Shown Here:
Now to jump into this analysis.
OVERALL MARKET ANALYSIS:
After seeing for the first time in a very long time we have seen the major indexes like the SPX , DJI and other indexes all have failed to create a new higher high, despite making a lower low off this recent drop we have seen since the start of 2022. This has started a new downward trajectory for the market, that could lead into the projected crash that I have called to start in 2022.
In addition to the FED re-introducing rate hikes as of Q2 2022, This will just add to all the inflation that is already happening i.e. current currency supply inflation, Consumer price index inflation, supply & demand inflation due to supply chain bottlenecking...
Examples of how inflation is affecting not only the consumers but even the companies producing the products can be seen everywhere. We as consumers continue seeing prices rising with what looks like no end in sight. Manufacturers have been downsizing the products they produce and are still charging more for the same product just packaged a bit smaller now.
For example Gatorade used to have the 32floz bottle size and used to be able to get them 2 for $4. Nowadays you will not see the 32floz size and instead you will see a 29floz bottle size and most commonly I see 2 for $6. Many products have been doing this to be able find extra product within the product they already produce and now use a slightly smaller container which both help cut some costs for the company while being able to produce the same product.
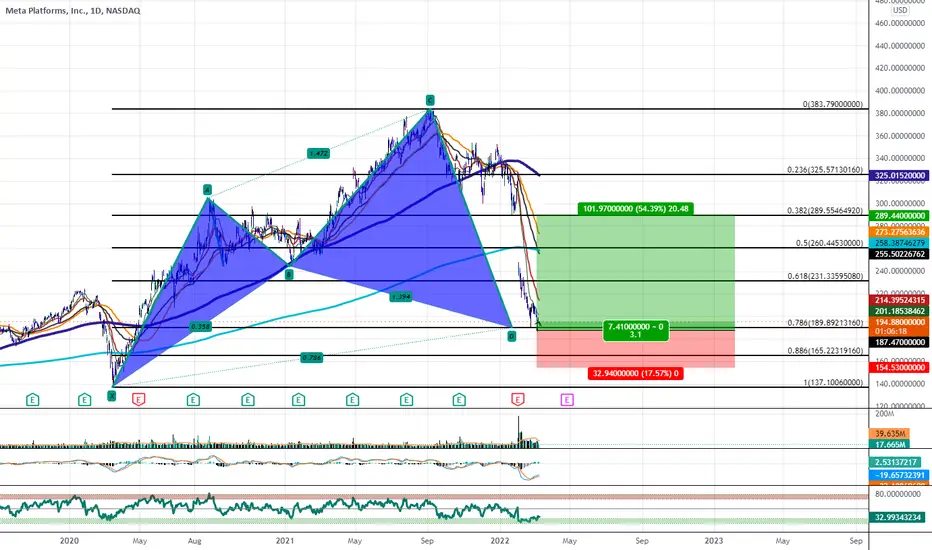
NASDAQ:PYPL CHART ANALYSIS :
Due to the major indexes making that lower low and then coming back with a lower high, this has started the downward trajectory, and as of Feb 2 2022, when the indexes made that top and the price turned around, You are seeing MAJOR PRICE DROPS across many of the individual stocks in recent days.
The drops normally have been forming new large gaps in the chart, which led me to analyze any other possible gaps that are present that have NOT been filled to current date. The ONLY REAL chart analysis that is needed at this point is to follow the gaps in the charts, because as the old saying goes "Gaps Fill".
As you can see here on Paypal's chart, we had been dropping from its highs since mid-2021 and also made a gap higher up in the chart in November 2021 that has yet to be filled from $216 - $224. The bottom of the gap was re-tested and failed, which resulted in a drop down to the .382 FIB Retracement, but upon its initial test, the price action broke below the .382 level. Although its attempt to hold that level, its initial break would be the cause for its continued move downward.
Although we had what looked like a promising recovery off the .55 Fib Retracement level, this was SAVAGELY Shut down the same day that the major indexes put in the lower high turnover in price action. Combined with the market pricing in its dissatisfaction with the FED reintroducing rate hikes next quarter, the combined confirmations have woke up the bears from hibernation and they are HUNGRY.
This SAVAGE rejection produced an instant GAP downwards of 20.5%, resulting in a GAP from $141 - $176. This has yet to be filled, as marked on the chart.
The drop down to this level has filled a GAP that was left unfilled from May 2020, and is now filled. Which is a slightly positive observation. We could have seen the gap that we just formed possibly fill, if the price action was able to break the bottom of the GAP which sits right on top of the .618 FIB Retracement level, and with the GAP candle forming under the .618 fib retracement, this produced a further move downward, creating a move further downward to the $123 price level.
Currently, we have the candle from last Friday (2/4/22) form candle body support on top of the .706 FIb Retracement level and that correlates to holding support on top of a Double Top that formed formed from the start of 2019 up to the crash of 2020.
PREDICTIONS:
Overall, there are plenty of swing trade opportunities all throughout each of the moves the market makes. But overall, a short/downward price action bias is still overwhelmingly strong right now
A) From this level we could see a move to re-test the .618 Fib Retrace, resistance level at $141. IF it does re-test the .618 fib retracement, the probability of being rejected is HiGHLY LIKELY due to the strength of the .618 fib levels overall, but that would also mark the top of the now filled GAP from May 2020. And considering the time frame as to which that would happen, that would be around the start of Q2 2022 which is when rate hikes would be started again. A break of such a strong fib level also has a very low possibility due to the move that was just made downward as well.
B) Whether we re-test $141 or we re-test the $128 level, which is the bottom side of the May 2020 Gap that's been now filled. The current candle body support on the .706 FIb Retracement level is below this $128 GAP resistance and also below the last long term ascending trend line that we had. The confluence of bearish confirmations would mean that the bottom side of that GAP would result as a new resistance point for the chart and seeing that there is yet another unfilled GAP from April 2020, we are most probable to see a move that pushes us down to the $94 - $96.50 price level. A Key indication of what the next move would be from this GAP fill would be whether or not the price action can recover and wick back above the .865 fib retracement to hold candle body support.
C1) IF it can recover the .865 fib level, that could fuel a trend to the upside to re-test the .786/ .706/ .618 fib retracement levels, A break and hold of support of each would allow us to fill the November 2021 and February 2022 GAPs.
C2) Keep in mind that there is also a GAP that is from April 2017 that is yet to be filled that sits down at the $45 -$46 price level. After filling the April 2020 GAP at $94 - $96.50, If we CANNOT recover the .865 Fib Level and start to close daily candles below $100, the probability of yet another move downward to the April 2017 GAP would be inevitable. We would see some indicator and oscillator relieving support at the 1 Fib Retracement level and then ultimately the 1.618 FIB Retracement level sits down at $37.50..
CONTINGENCIES:
There are a couple of things that would create the opportunity but also the ability to continuously capitulate in a waterfall down, 85% to fill the April 2017 GAP and down 88% to find support at the 1.618 fib retracement level.
These factors would include any of the following:
FED not realizing that the market will continue to capitulate as long as the are integrating Rate HIkes. Of which, start in Q2 2022 with up to a 1% rate hike, Q3 2022 with up to a 2.15% rate hike, and Q4 2022 with up to a 3.25% rate hike. Then for 2023 the continued rate hikes are projected at 3.25% and up based on FED evaluation. They do not plan on decreasing rates by any means until their have drastically reduced their $9.5 Trillion Balance of Mortgage Backed Securities (Debt Treasury Bonds) that they have bought from the banks in the form of bailouts. This balance does not include any of the passed budget plans that has required the FED to create new currency to fund budget plans which also include all the stimuli for COVID-19 and EDD funds to each state to continue to payout Unemployment claims, PUA and PEUC benefits to everyone.
NOT Reverting back to 0% rates will continue to impact the market with detrimental effects from the roughly $25-$30 Trillion dollars that have been created in the past 2 years. With how long the rates have been at 0% - 0.5% prior to COVID and then during the last two years, having maintained a 0% rate, while we also have been creating obscene amounts of new currency to be able to provide liquidity for everything that would be to simulate the economy velocity or to pay for COVID related expense, and bank bailouts. Another detrimental factor that comes into play are that physical fiat currency will NOT be made for most of the amounts that have been generated for liquidity. Which means that the Federal Stimulus direct deposits and checks, the bank bailouts, and the liquidity given to states to fund the Unemployment and PUA and PEUC benefits were all sent out using currency digits. Currency Digits = newly created currency from the FED that does not create new physical fiat currency to account for the newly created currency amount. Instead this currency amount is transferred as digits and then the debt is held in Treasury Bonds. Problem is that those T-Bonds become a ticking time bomb, cause the FED has been creating new currency digits to give out at a 0% rate, but then has to turn around and buy up defaulted mortgages and debt bailing out the banks to then make new Treasury Bonds for the new debt its bought, of which all banks and other country's banks and governments would bid to be able to acquire these T-Bond'd backed securities of debt for an incentive i.e. profit %, tax cut, lump sum payout for holding it. But when you have every other Country in the world that is having their own economic crisis that takes them out of the picture and banks cant buy up the T-Bond debt like they usually would because they would have to ask their sugar-daddy (The FED) for liquidity to be able to buy up the T-Bond Bills..Now these T-Bond backed securities of debt have no one buying them up and they will eventually come due,. Take a crazy guess as to what willl happen then?.... Yup thats right, more new currency to be able to
High Frequency Algorithmic Trading bots Fueling excessive moves downward due to the nature of which they are coded to use indicators and oscillators that reflect current market momentum and strength. Just as they did during the Crash of 2020. Many of the anchors on MSNBC would frequently discuss/complained about how these HFT Bots were continuing to drive the price down uncontrollably.
Overall High Inflation combined from the new Rate Hiikes (1%-3% per quarter), the Consumer Prince Index Inflation (avg. 7.1% ea. month), the Current Currency Supply (physical fiat) inflation (avg 28% YoY) combined with decreased Economic Velocity with force people into another economic indeflation where mass deflation and inflation are being made at the same time -- deflation made by the fear of markets downward trends and consumers reverting to mattress savings of cash, and inflation made by the government creating new incentives for people to apply credit and loans, new stimulus handouts, and any other way they can think of to stimulate the economy and continue to have velocity..
There you have it, a combined analysis of short term and long term price targets, analysis of the market overall plus $PYPL charts specifically, and then a cross analysis of how current and future economic conditions could and would effect the price as well.
If you found this helpful, Please remember to leave a Comment, Give this post a like and so you do can get regular updates for my analysis whenever they are posted, Follow me and make sure you have notifications turned on!

SPX: Buy amid panic? Let's see...Hello traders and investors! Let’s see how the SPX is doing today!
First, in the 1h chart, it lost the support level we mentioned yesterday, however, it seems it just dropped to its next support, and now we see a very good reaction.
In the 1h chart, the index filled the previous gap, making it an Exhaustion Gap, and it is triggering a pivot point as well. These are signs of bullish reversal, but the situation is still very dangerous.
The index is still under its 21 ema, and it seems it needs more bullish structures to confirm a true short/mid-term reversal. If this happens, the gap at 4,472 would be its next target.
When we look at the daily chart, we see a powerful candlestick today, closing above the last two support levels, and this is another bullish sign. The volume is starting to increase again too, and this is important. Remember, the volume must confirm the trend (Dow Theory 5th tenet).
Since I always had this contrarian style, when I see movements like this, or when I see people panicking, usually I find the best opportunities around. As Nathan Rothschild once said: "But when there’s blood in the streets". Use the emotional traders and investors in your favor.
However, we must do this calmly, with caution, and using a proven methodology. Personally, I see many amazing opportunities right now.
I’ll keep you guys updated every day on this, so, remember to follow me to keep in touch with my daily updates.

TSLA: Great opportunity to BUY? Let's see.Hello traders and investors! Let’s see how TSLA is doing today!
Despite the crash, TSLA made a very technical move that shouldn’t be a surprise to no one. As we mentioned in our yesterday analysis (link below), the moment it lost its support level, it dropped more $ 100, and now it is reacting as expected.
The support level that held TSLA today was the purple trend line along with the black line (Sep 2021’s support). This dual-support level worked nicely today, and the volume is finally increasing.
If you didn’t know better (that there’s a war going on), you would see this movement just as a retest of a support level in a bear trend.
This movement is good, but TSLA has a few challenges to overcome. Let’s see the 1h chart:
Yes, TSLA is triggering a mini pivot point, a reversal pattern. The problem is, the 21 ema is very close to the red line at $ 792, and although TSLA is breaking it right now, I wouldn’t be too greedy on this. It could easily do a correction again from here tomorrow.
If TSLA confirms another reversal sign, the gap at $ 920 will be the next target. I think that we have a good opportunity, but we should go easy on it, as the trend is still bearish. As you guys know, I always like to buy when there’s blood in the streets, but we must do it patiently, as the market confirms our thoughts, using a solid and proven strategy.
In my view, there are stocks much more interesting than TSLA, but I’ll always keep you guys updated every day on this, so remember to follow me to not miss any of my future analyses!

AAPL: Possible reversal pattern? Some scenarios to work with.Hello traders and investors! Yesterday, AAPL hit our target and it filled the gap we mentioned in our last study. Now, what to expect next?
Now that the markets crashed, we have some interesting key points to watch. In the 1h chart, AAPL is recovering nicely, and if it fills the last gap at $ 159.75, this will confirm an Exhaustion Gap, and that might be the first sign of a possible reversal in the future.
However, it is important to stress that for confirmation sake, it would be good to see AAPL doing a clear bullish chart pattern in the 1h chart, and so far, we have none, so the trend is still bearish.
If AAPL closes above the black line at $ 157.17 in the daily chart, it’ll be another good sign. Today’s candlestick is quite powerful, and despite the drop, some might see it as a risky buy. I won’t judge, since I understand, but again, I would wait for more confirmation in the 1h chart. Without any other meaningful bullish sign all we can assume is that AAPL is seeking the $ 147 again.
But, where would be the target if AAPL truly reverses? Look back at the 1h chart, and pay attention to the last 3 open gaps (yellow squares). I see AAPL filling all of them, triggering the Gap Reverse Ritual pattern (yes, I invented that name, as no one else did).
The Gap Reversal Ritual never failed me, and the last time we saw it was on NVDA, and I did a public analysis about it (link below, if you are curious).
This pattern is quite hard to work with, but if you nail the right timing, it might give you great returns. I’ll keep you updated on this, so remember to follow me to keep in touch.
