TSLA: A complete Multiple Time Frame Analysis!Hello traders and investors! Today is Friday, so let’s do a complete Multi Time Frame Analysis (MTFA) by looking at the hourly, daily and weekly charts (short, mid and long-term).
Starting with the hourly chart, the $ 493 is a pivot point for Tesla, and if it loses it, we may see some pullback ahead. Therefore, I said to you that this is a point to book profits. Always buy near supports and sell near resistances . If you missed my previous analysis, the link to it is below, as usual.
A pullback to the 21 ema would be acceptable, or even the $ 461.88 (purple line), but we can’t possibly know if Tesla is going to reach there. I think the daily chart is looking more interesting:
Ok, if Tesla loses yesterday’s low, the $ 487.57, it’ll reinforce the idea of a pullback, and the target would be the purple line, but if the momentum is strong enough, I doubt Tesla would hit there.
We also have a Breakaway Gap and the volume is increasing. I find it very hard for Tesla to drop again to the support level around $ 406, because it would mean that Tesla would fill a Breakaway Gap, which is something it never did in the past . After most of the congestions, we have an upside movement triggered by a Breakaway Gap, with good volume. This is how Tesla behaves.
Now, let’s see the weekly chart:
Yes, Tesla is breaking out from a Pennant chart pattern , which is something to keep in mind. The trend is historically bullish, and the congestion we saw in the past months was just a pennant in the weekly chart.
Notice the low volume of this pennant, which is a very technical movement, according to the Dow Theory , 5th tenet: The Volume Must Confirm the Trend. If the correction has low volume, then it is just a harmless correction, not a reversal sign.
Speaking of reversal signs, there is none around. We would have a pullback sign if Tesla loses the $ 493 or yesterday’s low, but nothing that compromises the bull trend.
This is what the chart tells me, and if you liked this analysis, please, support it ! And follow me to keep in touch with my daily updates.
Thank you very much.
Have a great weekend!
Gap

TSLA: New record high! How to proceed now?Hello traders and investors! Ok, Tesla hit our target at the All Time High today (black line at $ 502.49), and now it is trading close to it.
The trend is bullish in all time frames I use to watch: Hourly, daily and weekly. This means that pullbacks are opportunities to buy, and maybe we’ll see one here, but it is a huge maybe.
Since we just hit a previous resistance, and some players who bought around $ 406 (previous support) are booking profits here. So, a pullback would be natural and would offer an opportunity to buy Tesla, at a cheaper price, below a resistance and with an optimized R/R ratio.
If you have Tesla and are afraid of a pullback, the technical point to book profits is the red line at $ 493 , because if Tesla loses it, it could drop to the 21 ema again, or even the $ 461.88.
There are other strategies you can use, and the daily chart can help us here as well:
Again, Tesla did a Breakaway Gap and the volume is increasing, which is the same pattern Tesla did in the past before most of its greatest explosions, always after its congestions. To further details about it, read my previous analysis, the link to it is below.
It would be good if Tesla closes above the black line, because if it leaves a shadow above the candlestick’s body the market may see this as a sign of weakness. But as we’ve been discussing, a retest of the $ 461.88 region would be perfect, but since the trend is so strong, we can’t count too much on this.
Another indicator that Tesla could drop a little bit more, and you may use it to book profits, would be if tomorrow Tesla loses today’s low.
But if you have some guts you may just hold your position, as there is no reversal sign ahead of us, and the weekly chart is looking good:
A breakout from a Pennant chart pattern . This is a good sign and another indicator that Tesla is seeking for higher levels.
For the short-term, just keep the points mentioned above in mind, and you’ll be just fine. And if you liked this analysis, please, support it ! And follow me to keep in touch with my daily updates.
Thank you very much.

analysis NAS100Update on Nas100, yes I added an fib and divergence because it completed its lower low and opposite candle from RSI. Looking for sells. it might continue to go up and then shot down

DAX Is Bullish, But More Gains After A Short-Term PullbackHello traders!
DAX made nice and impulsive bounce from projected support after we noticed a three-wave A-B-C corrective decline, so it's turning back to a bullish mode, mainly because of recent break above trendline.
However, watch out for a temporary short-term pullback to fill that open GAP, which can actually retest that daily trendline with potential support around 12300 level. In fact, if current 13300/13400 zone will also hold as a resistance, then we may see a potential inverted H&S pattern, where right shoulder is still missing.
Trade well!
If you like what we do, then please like and share the idea.
Disclosure: Please be informed that information we provide is NOT a trading recommendation or investment advice. All of our work is for educational purposes only.

$TSLA S34 likely tomorrowThe S34 opening sell signal is likely to show up tomorrow at the open.
Look for a daily open above 436.56 to get a confirmation.
The intraday entry will not be easy to spot with high volatility expected.
Supply Line (level8) will also generate a breakout signal that will have to be invalidated on Wednesday’s close to confirming the sell signal.
Hence it is probably better to wait for Wednesday’s close to increase the odds of success.
No guarantee this S34 exhaustion point will reverse the trend.
Wave B could also shift to the right tomorrow.
Stay cautious
Cheers!
MATHR3E

Going to test gap areaThere is support around 242 also but I guess bearish momentum it can take to 232-282 area where it's gone test the gap and it will revert from there. It's also nearing the oversold region and volume is shrinking too.


Imbalance Trade EURAUD 1hr Imbalance Gap
50% Fib from zone or High of the zone for Entry
1:2 R/R @ 20 pips

What to do with DRD...Looks like there are a few things happening with DRD...
Gold Price Support at $1840-$1860 seem to be holding, which would be a buy for me at these levels with a stop loss if it breaks, but DRD itself:
Possible Head and shoulders
Gap 1344-1444
Possible Double top to tests near gap
Downward channel from Jul20/Aug20
And Stochastic oversold
Not sure which direction, but I like current levels as a possible trade entry point - curious about a long Straddle option strategy if possible?
Any good options brokers to recommend?
I'd appreciate your opinion on the above - Thanks in advance
The above is just my opinion/observation and a question, not a recommendation.

ZM - done falling yet?Zoom has "fallen from grace", aided in part by the announcement that a vaccine could be near. It fell from 588.80 in October to a low of 366 on 10 Nov. Having fallen nearly 38% from it's recent high, I suspect "value" is starting to emerge again and that the 61.8% fib support level at 365 would hold.
A bullish divergence between price and RSI is also forming..Hence I am accumulate with initial stop loss @ 362.
However! Should this trade not work out, then I will be looking to re-enter near the gap close @ 325
Disclaimer: This is just my own analysis and opinion for discussion and is not a trade advice. Kindly do your own due diligence and trade according to your own risk tolerance. Thank you.

HOW TO TRADE A GAPHere is a simple guide for how to trade a gap.
Have a look and take the opportunity in the next gap ! ! !

DAX / GER30 / DEU30, daily tf, sell the shooting star candleHello my friends,
Second setup for today is German index which is known as DAX.
Some brokers use DAX on it quotation, others use GER30 / DEU30.
Anyway, they are the same indicies if i am not wrong. Feel free to correct me if i am wrong.
There is a shooting star candle / bearish pinbar candle on the daily timeframe. It appeared exactly at horizontal resistance.
This indicates sellers currently winning over buyers.
As you could see, there is also a big gap on DAX chart so we could see price drop to fill this gap first.
Sell DAX / DEU30 / GER30 13095
Stop loss 13215
Take profit 12615 (4R)
RR ratio 1 : 4
Use only 1-2% risk
Good luck
Disclaimer : I am selling DAX from 13095

Snap toward the gapWaiting to add more to my long position when snap touches the gap area. MACD and two red candles are showing bearish sentiment for the short-term but it's holding 20MA also which is only bullish sign. Potential target could be 43-44

SIA - airlines on the recoveryAfter lying low for about almost 4 months, news of Pfizer covid19 vaccine being 90% successful led to a breakaway gap on strong volume. The stock looks on track for a recovery with 3.80 as the "resistence turned support". However, as there are lots of resistences on the way up, I would consider to scale out partially around 4.40-4.50, then trail the stops up for a possible eventual target of 5.00.
I'll place an initial stop loss @ 3.74 as I do not expect this gap to be closed.
Disclaimer: This is just my own analysis and opinion for discussion and is not a trade advice. Kindly do your own due diligence and trade according to your own risk tolerance. Thank you.

Focus ES. Short. Playing the gapLooking to add short after gap fill. At Lower red line. If it breaks below I will enter on a retest.
These are usually high probability plays. I may due a tutorial on different kinds of gaps.

SPX: The most important point for SPX!Hello traders and investors! Let’s see how the SPX is doing today! The moment is quite challenging with everything that is going on (elections, second wave, vaccine), but the Technical Analysis can always offer us some interesting insights.
Firs, the hourly chart is in a strong bull trend, and despite the fact it is too stretched, there’s nothing indicating we’ll see a reversal ahead . But we can’t discard the possibility of a pullback.
The red line at 3,588 is the most important point for SPX in the short/mid-term , and only if SPX loses it, we’ll see a sharper pullback. This red line only makes sense if we analyze the daily chart:
Yes, the red line is the previous All Time High (ATH), and if SPX closes under it today, leaving a huge shadow above the candlestick body, we’ll see a Shooting Star pattern in the daily chart, and a false breakout from a previous resistance, and usually these are not good signs.
Also, we may see an Exhaustion Gap here (yellow area), reinforcing the idea of a pullback, and SPX could easily hit the 21 ema again in the next few days, if these signs will be triggered.
Let’s keep our eyes open here, as the moment is quite decisive for SPX, and if this idea helped you, please, support it! And follow me to keep in touch with my daily analyses.
Have a good Monday!

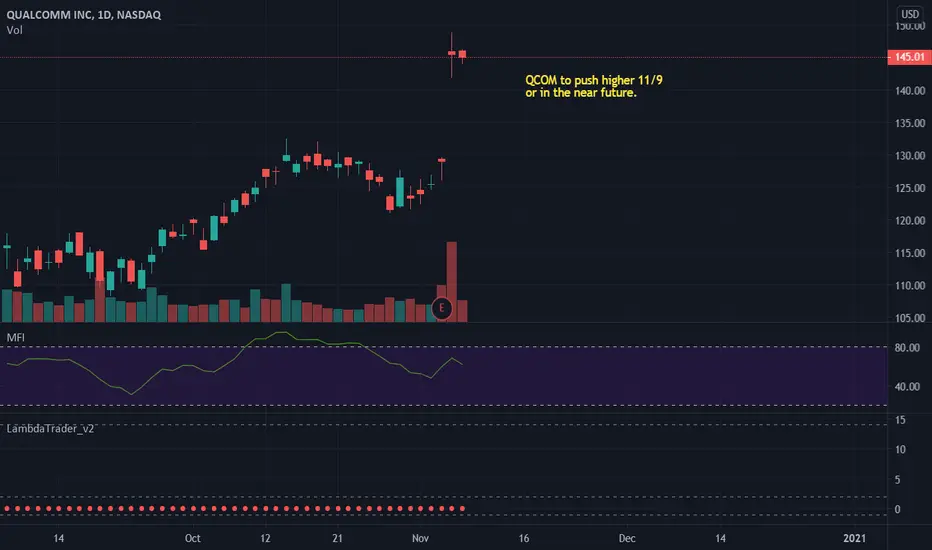
QCOM MooningVolume and price action give the sense that the sell off after the large gap up is coming to an end. Look for price to push higher.
Analysis Gold hello traders, you see when there is a lot of conformations in those area. There is an huge gap area on the 4 hour downward. Divergence on top of candles and IRS. Head and shoulders form. Short sell coming. All you need is 20pips a day to change your life. Catch a pieces not a whole. Thanks for reading!

XPEV: Weekly Outlook and Key Points!Hello traders and investors! I usually do a lot of analyses regarding TSLA and NIO, so how about a XPEV analysis for a change? Let’s see what we can find here.
First, the daily chart is looking impressive! We have two open gaps here: One Breakaway Gap , which defeated the black line at $ 23.10 (previous top/resistance), and another gap, which we still don’t know its type.
If it is an Exhaustion Gap , it’ll be filled quickly, and probably XPEV will hit the 21 ema in the next few days. If it is a Common or a Runaway Gap , it won’t be filled so soon, and the bull trend will continue. Either way, we’ll have our answer next week.
Today’s candlestick could be a Dark Cloud Cover (DCC), and if this pattern is going to be triggered, probably XPEV will do a pullback to the 21 ema, filling the Exhaustion Gap in the process.
Now, let’s take a look at the hourly chart:
We have 3 gaps in the hourly chart, but I find it very hard to believe XPEV will drop below the $ 20 again. The trend is clearly bullish, but the chart is too stretched, as it didn’t even touch the 21 ema at any moment.
There are no signs that the trend will reverse, but a pullback is desirable . I would look for a bearish pivot in the hourly chart or wait to see if the DCC candlestick pattern is going to be triggered in the daily chart.
Also, we have two pivot points here: The black line and the red line. I find it very hard for XPEV to defeat the black line now, and I would keep an eye on the red line, because if XPEV loses it, the bull trend will start to look weaker.
These are the most important points to keep in mind, and if this idea helped you, please, support it ! And follow me to keep in touch with my daily analyses!
Have a great weekend.

UBER vs LYFT: A technical comparison.Hello traders and investors! Let’s see what’s going on with UBER and LYFT today. Both stocks are doing some impressive movements, so it is a good time to study them.
First, let’s start with UBER. The stock is doing a phenomenal movement today, but if we look at the charts, it just hit a resistance zone today, the black line at $ 41.86, and now it is doing what it seems to be a Spinning Top candlestick pattern .
Either way, UBER must keep trading above the yellow line at $ 38.59, because if it loses it, a pullback to the 21 ema is expected . But despite the fact UBER is moving sideways since June, it seems the trend is slightly more bullish than bearish, and UBER is trying to defeat the resistance at the black line.
I see the 21 ema as an important support, but the red line at $ 32.89 is another support zone. In the worst-case scenario, UBER would hit the blue line at $ 28.53, but it is way too soon to say this.
Today’s gap could be a Breakaway Gap , and if that’s the case, it won’t be filled so soon. But if it is a Common Gap , then it’ll be filed in the next few days, and UBER will be back to the congestion.
I would just keep an eye on the black and yellow lines for now. Now, let’s see LYFT.
Lyft almost hit the previous resistance at the red line, and now it is dropping sharply. The good news is that it just hit a dual support zone , made by the yellow line (previous resistance) and the purple trendline.
The idea of a Breakaway or Common Gap applies here as well , and if LYFT loses its two supports, we’ll see a sharper pullback ahead, and it’ll probably fill the gap.
Honestly, it seems the bulls will have a hard time now to defeat the resistances on UBER and LYFT, and a pullback would be great for the stocks, and it could even bring some opportunities to buy.
In the hourly chart, there’s a reaction starting on LYFT right now, so the support zone is working so far. UBER is still struggling a lot, but today’s low seems to be a Pivot Point , and if UBER loses it, it'll probably lose the yellow line with it, bringing the pullback we mentioned earlier.
The volume increased a lot today, and both stocks are quite speculative, so let’s be cautious here. Either way, these are the most important points to keep in mind for both stocks, and if you like this analysis, please, support it! And follow me to keep in touch with my daily studies.
Trade well.

Bitcoin and two CME Gap‘sThe bitcoin has still two big gaps and it is for month not close yet, I expect in the next day a big correction to 9,5k!!! In this chart you can see the indicator rsi, it shows us with heavy overbought rsi!!!

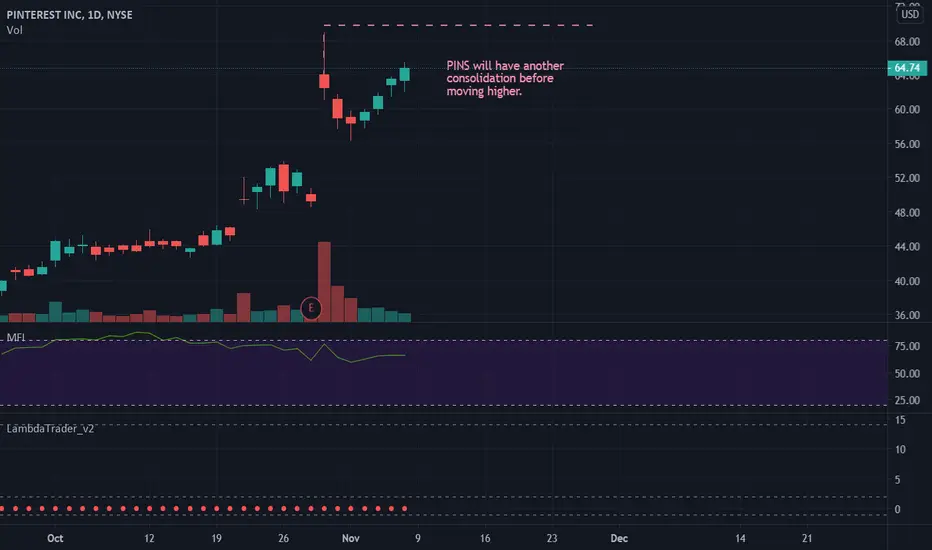
PINS - Runaway or Exhaustion Gap?My take is that it is still a runaway gap and the bullish trend will continue. Reasons being:
1. broke out of a 1.5 years base formation on 31 July (breakaway gap)
2. recent pullback stopped short at the 62% fib support @ 56.30 (ie only partial gap fill)
3. recent hi @ 68.95 is the ATH (all time hi), there is no other historical resistence.
Immediate Stop Loss @ 56.20 (slightly below the 62% fib support). Consider to take partial profit near 69 but ride the rest until a change in trend is evident.
Disclaimer: This is just my own analysis and opinion for discussion and is not a trade advice. Kindly do your own due diligence and trade according to your own risk tolerance. Thank you.
