Gap
close vicinity gap on the bitcoin cme chartgaps do fill, i wont mentioned the $3500 one (oops), but these 2 up here arent miles away even if it took 6 months to fill these gaps will close eventually

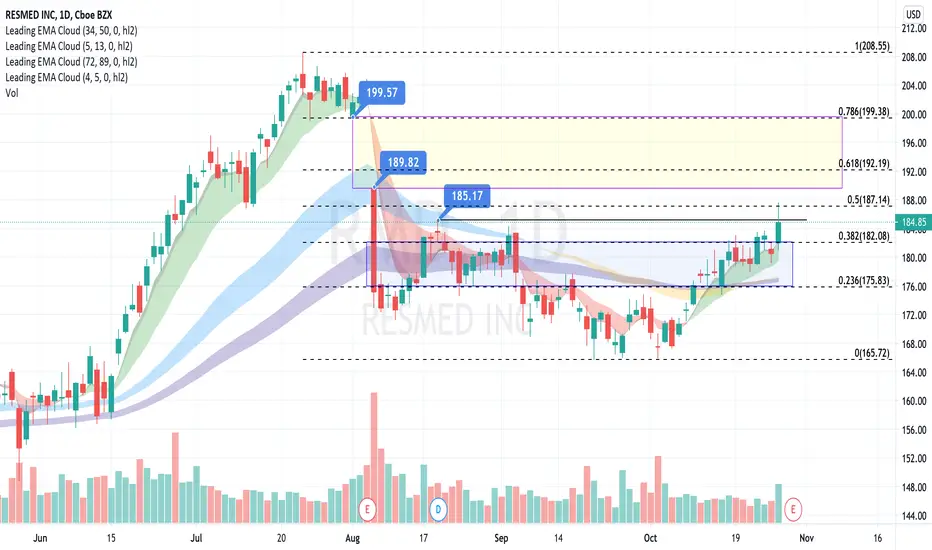
$ALGN Earnings Retest Bull Flag Forming$ALGN had a huge earnings gap a few days ago and, finally, it has returned to the base of that move. Buyers will have been waiting here for a LOOOONG time and if we can form a bull flag breakout higher, may just have the juice to kick off another big leg up again.


NIO: 2 Pivot Points and Targets to work with!Hello traders and investors! We have a red world today, but NIO is resisting quite well! Let’s see what the chart tells us.
First, in the hourly chart we have a trendline , which NIO defeated, and it is engaging in a short-term bull trend. This is very good, but we have 2 important pivot points here now, and I would use them to guide myself.
The green line is a possible bullish pivot, and the red line is a bearish pivot. Since NIO just defeated a trendline, the odds favor that the green pivot is going to be triggered, but we must be prepared for different scenarios.
The targets of both pivots are better seen in the daily chart:
Ok, we have the All Time High at the green line, and this would work as a resistance if NIO starts going up again. But since it is quite close to the current price, if we see a bullish pivot in the hourly chart, I believe NIO will do record highs again.
On the other hand, a bearish pivot in the hourly chart has clear targets. The blue line at $ 22.59 is a good support zone if the price drops, and we have a gap down there to drag the price.
It seems there are a lot of buyers though, as the white bars in the volume are quite high during the upside movements. Also, the 21 ema is pointing up, and the trend is clearly bullish in the mid-term.
All of this favors the bulls, but as I said, we must work with different scenarios. And if you like this idea, please, support it ! And follow me to keep in touch with my daily studies and analyses.
Trade well!

DAX / DEU30, daily tf, buy on support at oversold conditionHello my friends,
Today i spotted a good setup on DAX / GER30 indicies.
After marking all the potential support and resistance, i found that price currently on support level.
Price go down aggresively since 12600 to 11600. It goes down 1000 pips in just 3 days.
We could see price retrace back up to close the gap before continue south.
Buy DAX / GER30 at 11600
Stop loss at 11400
Take profit 1 at 12000 (2R)
Take profit 2 at 12500 (4.5R)
Use only 1-2% risk
Good luck


Gap fill from today open to previous day closeQuick video on playing a fade from the current New York session open to the previous day close.

BTC1! CME false breakout from triangleWith a bearish engulfing candle forming after the false breakout. Very heavy bearish divergence. Break down of triangle should send price down to the bottom of the channel. The measured move of the triangle breakdown is 12.2k.

BTC1! CME making a bull pennantClosed the weekend gap with a wick. Target of the pennant is 15K. Breakdown of the pennant is possible since BTC price structure that includes the weekend is different.

AAPL: Next targets and Key Points!Hello traders and investors! Let’s see how Apple is doing today!
It is resisting in a support zone (green line), which was a previous top, and now it is working as a support according to the Polarity Change . Also, it filled a Gap (blue area), and it may work as a support level as well.
Any good reaction near this green line would be a very good sign . On the other hand, if AAPL doesn’t react, then it’ll just resume the bearish momentum to the next support level, the black line around $ 112.85.
Now let’s see the daily chart:
The green line at $ 117.85 is the most important point right now, because it was a previous top, and it worked as a pivot point yesterday, and this led the stock to fill the gap and to the 21 ema again.
If AAPL trades above this green line again, the market will see this movement as a false breakout from a previous pivot point, and the bull trend will resume. The next target would be the All Time High again, especially if it triggers the Pivot Point at $ 125.39 (blue line).
Also, the volume is quite low these days, as evidenced by the red arrow, and this confirms our theory that this movement is just a pullback. According to Dow Theory’s 5th Tenet: The Volume Must Confirm the Trend . A pullback with low volume indicates that it is indeed a pullback, a quick movement against the trend that usually gives great opportunities.
If you liked this idea, please, support it! And follow me to keep in touch with my daily analyses.
Have a great day.

BTC Short - GAPS CMEIn the short term, the price indicates that it tends to close the gaps in the CME futures.

BTC1! CME shows two probable pathscme can breakout of the bullflag channel with that target at 12.5k, 12k is a heavy resistance area. Or btc can drop now and close the gaps.

$MLHR 1 Month #SymmetricalTriangleInteresting post earning gap play. Huge volume & Symmetrical Triangle consolidation. Good for a run up to $39-$40

AAPL. Short, More downside into the Election. AAPL setting up an ABCD to fall back and fill the gap before the election. There is a possibility of 1 more move up to 130 before a deeper decline.
If this happens then the major Indices will follow.

GAPS, GAPs, GAPsMr Market likes to fill open gaps. It will do so whenever possible. We have had very good examples of these in recent days.
IMO, we are still on a bullish footing at this stage. I have highlighted the green box. You will note today, prices gapped below the green box and finished back within. That green box is the true range of the last (significant) bull bar. Breaks up or down out of the green box usually will signal a continued move in the direction of the break.
There is potential downside here as there are lower gaps we have not closed around the support level. If we continue to hold the green square, bias would be for continued upside.
My trading stories: dailyxing.medium.com

TSLA: For how long will this sell-off last?Hello traders and investors! Let’s see how Tesla is doing today!
Let’s start our study looking at the hourly chart, as usual. Yep, the $ 461 did hold the price, as it was expected, because it is a clear resistance level, and now the bullish momentum is starting to get weaker, as we already discussed yesterday. If you missed my previous analysis, the link to it is below.
But this doesn’t mean the trend is going to reverse, at least not yet . This only indicates that TSLA is just going to seek lower supports, and as long as we see this sell-off on the global markets, it’ll be quite hard for Tesla to continue going up, as it follows the movements on NDX.
Right now, TSLA is between the previous resistance , along with the 21 ema (which is flat now) and the next support at $ 439. It also left a gap (yellow area), which maybe is a Breakaway Gap.
Let’s see the daily chart now:
If the gap seen in the hourly chart is indeed a Breakaway Gap, probably Tesla will hit the 21 ema again, and the support at $ 439 may won’t be able to hold the price.
On the bright side the momentum is still bullish, and there is no reversal sign on Tesla. We can expect some pullback, as the volume is still pretty low, and if the trend is going to continue, we need more volume. Remember Dow Theory 5th tenet: The Volume Must Confirm the Trend.
If you liked this analysis, please, support it! And follow me to keep in touch with my daily updates on Tesla and other stocks!
I wish you all a great day!


AMZN: What to do if a pullback occurs?Hello traders and investors! Let’s see how AMZN is doing today!
The trend is clearly bullish , the 21 ema is going up, and it is above the yellow line, which was a previous resistance for the stock.
Today is moving sideways, it seems a healthy time correction , letting the 21 ema to approach the price. It seems AMZN is resting a little before it fills the Breakaway Gap (Sep. 3).
We may have a Pennant chart pattern ; an upwards breakout could lead AMZN to new highs. On the other hand, if we see a downwards breakout, we may see a pullback. The targets for a pullback can be seen better in the daily chart:
Keep in mind that AMZN just triggered an Inverted H&S pattern , and the target for this pattern is the All Time High.
But a pullback triggered by the Pennant in the hourly chart could lead AMZN to the 21 ema or to the 3,225 again, and the trend would still be bullish. When we talk about H&S patterns, studies reveal that pullbacks occur about 2/3 of the time after the pattern is triggered.
It left a gap on Monday, which we still can’t be sure about what type gap is , so let’s keep this point in mind as well.
Yesterday’s candlestick was very bullish, and the volume was pretty high. I wonder if this is an Exhaustion Bar after an Exhaustion Gap . Either way, pullbacks are acceptable and even desirable.
If you liked this analysis, please, support it! And follow me to keep in touch with my studies and updates! Let’s watch AMZN closely from now on!
My best regards.

TSLA: Next targets and important supports to keep in mind!Hello traders and investors! Let’s see how Tesla is doing today!
First, it did break out from the green line , which we discussed in my last analysis, and now it is going to hit the $ 461.88, the previous resistance.
Also, it already filled the gap (yellow area) at $ 446.40, and it is back on a bull trend . The 21 ema and the green line will work as support levels next, and pullbacks to these points are expected and shouldn’t be scary.
Meanwhile, it seems we have a Cup & Handle chart pattern, and it seems the zone around $ 448.78 is a secondary resistance for this pattern.
Right now, it would be very hard for the bears to take charge of the situation, but the bull trend will start to get weaker if TSLA loses the $ 439. But would only get weaker , I’m not saying it would be a reversal sign.
The trend would reverse in the short-term if we see TSLA losing supports in the daily chart:
I only would believe in a bear reaction if TSLA loses the $ 406.05 . Meanwhile, the $ 461.88 is the next target for the stock.
The 21 ema is pointing up, and the Triangle pattern had an upward breakout, so the odds favor the bulls, at least in the short-term.
I would guide myself through the hourly chart, which is right now inside a Trap Zone (between the ascending 21 ema and the resistance at $ 448). Be aware of the $ 439 and its resistances!
And if you liked this analysis, please, support it! And follow me to keep in touch with my studies.
Have a great day!

NDX is resilentSo much for the premature announcement for the return of value stocks. Besides industrials and utilities sectors, the pecking order remains the same in Sept.
NDX has recouped a big chuck of its loss since early Sept and seemed to have shrugged off other recent negative news.

BTC1! the cme gap teaseA very large gap was created over the weekend and PA fooled everyone into believing it will close it. But as usual it bounced off the top of the gap creating a very deep bear trap. Two possibilities exit, either a continuation upward to 12250 and which point price must come down to fill the gap or a detour here and a bull trap. The latter is healthier for the bullish case, paradoxically because a fall from 12.2k to the lower 10k is very bearish.
This is the second time that cme bounces of the gap and not close it directly.
Bearish divs on the HTF exits currently.
