GAP is ready for a series of PRICE GROWTH!GAP is registering significant net positive volume this past few weeks -- in anticipation of the company's turnaround story in terms of bottomline which it did after the company posted a surprise profit due to business re-organization after last Month's earnings result.
The stock is sitting at a strong solid support at 8-9 area -- a 1.0 FIB level area where buyers converge. Expect price to bounce from this range.
Weekly histogram has created higher lows conveying incoming reversal to the upside.
Spotted at 8.5
TAYOR.
Safeguard capital always
----------------------------------
FUNDAMENTAL NEWS: Reference Barrons.
Gap’s Surprise Profit Gives Stock a Boost
By Sabrina EscobarFollow
May 25, 2023 5:09 pm ET
Gap’s same-store sales fell by 3%.
Gap stock surged on Thursday after the company posted a surprise profit.
The apparel retailer posted adjusted earnings of one cent a share in the quarter, better than consensus estimates for a loss of 16 cents a share, according to FactSet. While revenue of $3.28 billion declined 6% compared with the previous quarter, it was in line with the company’s and the Street’s projections.
Same-store sales fell by 3%, more than forecasts for a 2.4% decline.
For the second quarter, Gap (ticker: GPS) is expecting net sales could decrease in the mid- to high-single digit range from the year-ago quarter’s $3.86 billion. Current estimates have Gap’s second-quarter sales down by roughly 5% year-over-year. For fiscal 2023, net sales could decrease in the low to mid-single digit range.
Despite the decrease in sales, Gap believes margins will grow in both the second quarter and the remainder of fiscal 2023. First-quarter adjusted gross margins increased 5.7 percentage points compared with the previous year.
Gap stock jumped 16% to $8.61 in after-hours trading.
The company is currently reorganizing its business to improve profitability. Earlier this year, it announced it was cutting 1,800 corporate jobs in addition to 500 jobs culled in September.
“While the macro and consumer environment remain uncertain, Q1 underscores our ability to deliver improvements to the business including share gains at Old Navy and Gap Brand, adjusted operating margin expansion, reduction in inventory, and strength in our balance sheet,” said interim CEO Bob Martin in a statement.
Gap

Revesal day! - plan for 21st December 2023Nifty future and banknifty future analysis and intraday plan in kannada.
This video is for information/education purpose only. you are 100% responsible for any actions you take by reading/viewing this post.
please consult your financial advisor before taking any action.
----Vinaykumar hiremath, CMT

Bitcoin Has To Fill Some December GAPsA CME gap for bitcoin refers to a price discrepancy that occurs on the Chicago Mercantile Exchange bitcoin futures chart between the closing price of one trading day and the opening price of the next trading day.
Gaps occur because the bitcoin spot market trades 24/7 on various centralized exchanges, from which CME derives its Mark Price, while the futures market only trades Sunday through Friday, from 6:00 pm to 5:00 pm ET.
Some believe that gaps on the CME chart can act as significant support or resistance levels, as prices typically tend to fill the gap at a future date. Others argue that CME gaps are simply a technical phenomenon with no real predictive value.
Bitcon CME Futures chart made some GAPs in December, which can get filled in upcoming days/weeks and it can be very interesting to follow. We think that wave C can now fill the GAP from December 3rd and then when correction is completed and bulls back in play, then it can fill the GAPs from December 17 and December 10.

Review and Plan for 15th December 2023Nifty future and banknifty future analysis and intraday plan in kannada.
This video is for information/education purpose only. you are 100% responsible for any actions you take by reading/viewing this post.
please consult your financial advisor before taking any action.
----Vinaykumar hiremath, CMT

golden crossstock tarding at golden cross over
run-away gap in chart
last time run awy gap give big move
so same can be accepted.

TSLA: An Intense Breakout is About to Occur!TSLA shares are trading in a Trap Zone, the area between the 21 EMA, which serves as the main support, and the resistance at $246.70, which was already mentioned in my last public analysis, the link to which is below this post.
This area between the 21 EMA and resistance is called the Trap Zone because as long as there is no real breakout from support or resistance, we could see several false signals and erratic, meaningless movement within the area.
The 21 EMA is slowly rising, squeezing the price against resistance at $246, and sooner or later, we will see a breakout in some direction. There's no way of knowing in which direction the breakout will occur - remember real trading is reactive, not predictive. In some cases it is possible to look for clues in an indicator such as the RSI, and look for a divergence or an Advanced Breakout (which is not the case here).
Since our last study, the price has retested the $246 area, reinforcing our main idea that this is indeed the main resistance for TSLA shares in the medium term. Only if the price breaks through this region will we see a real sign of recovery, which would represent a continuation of the upward trend.
Meanwhile, we see that the price is trading dangerously close to the 21 EMA. If the average is lost, then TSLA could trigger a new bearish move, perhaps looking to fill the gap opened at $225.40. Such a bearish move seen today is definitely suspicious, while the indices and almost all of the "magnificent 7" are rising. I wonder how long such a divergence between TSLA and the rest of the market will persist.
TSLA shares are falling this week, just as we approach the main long-term resistance at the top of its Descending Channel. The 21 EMA is also serving as support on this timeframe, which also reinforces our thesis that this area is a key support point, which could trigger a sharper correction if lost.
For the time being, as long as there is no clear break from its Trap Zone, TSLA's shares are bound to move erratically. To avoid a bearish scenario, now would be the best time to see a reaction. How the price behaves over the next few days will be crucial to what lies ahead in the medium and long term.
I'll keep you updated on this, so remember to like this post, and follow me for more analysis like this.
Best regards,
Nathan.

Thyrocare Readying for a Rally--> 2 Qtrs Sales Acceleration
--> Breakaway Gap on 6th Dec with High Volume
--> Rerating Candidate
--> 21 Bar PP Count: 5
--> 21 Bar U/D Ratio 3.6

SPX: An Unstoppable Rally? Analysis of the D & W charts.The SPX index is still trading within an area of resistance, which we identified together in our latest study, the link to which is available just below this post.
Although we have almost reached the next resistance at 4.607, the impression the index gives us is of a sideways correction. Since November 22, the SPX has been trading within our resistance zone (red area), without triggering any top signals, but without managing to continue the insane bullish rally either.
Despite the recent stabilization in the price, we don't see any significant top signals, or any kind of bearish reaction that could trigger a correction in the near future. But even if the index does correct, there are several support points that could hold the price, such as the 21 EMA, the gap open at 4.421, or even Fibonacci retracements as shown below.
It's worth noting how close the first retracement of 38.2% is to the gap. A correction up to one of these points would not pose any danger to the uptrend, so any pullback could become a buying opportunity. Remember, corrections are different from reversals. If there's no sign of a correction at the moment, it's even less clear that there's any chart structure indicating a reversal.
However, given the weekly chart, I understand the appeal that a correction would have:
The index has risen for five consecutive weeks, and the rally has been very intense. A pullback would be an acceptable and healthy move, and the 21 EMA would serve as a support point here too. It's worth noting that the average is at 4.402 at the moment, very close to the first Fibonacci retracement mentioned above and the last open gap.
For now, let's keep an eye on how the index reacts within its resistance zone over the next few days. Any sign of a top could trigger a medium-term correction, and in my view, if SPX closes below our resistance area again, we could finally see a correction. However, I agree that such movement is quite unlikely, at least right now. As I stated in our last analysis: "December is another good month for stocks, going up 1.50%, on average, and it ends up being a positive month 75% of the time."
I'll keep you updated, so remember to follow me for more analysis like this, and support the idea if you like it.
All the best,
Natthan.

GBP/USD pushing higher into monthly BisiPrice may want to make a higher high into the monthly sibi. we rejected from the 75% level in between the bottom and lower quadrant of the monthly sibi, if we were done with the sibi we would have continued lower from there. but we are back into the sibi and we have closed above the 50% level of the lower quadrant. so I can expect price to want to at least get to the lower quadrant of the monthly sibi.

🏖️ SAND's Bullish : Descending Wedge BreakoutThe crypto seas are witnessing the rise of Sandbox's native token, SAND, as it navigates a bullish pattern amidst market dynamics. In this exploration, we dive into SAND's chart, unveiling a compelling narrative of a descending wedge and a strategic reaction to a weekly imbalance.
Chart Analysis: The SAND Dunes Unveiled
SAND's recent price action has painted a fascinating picture on the charts, with the formation of a descending wedge—a classic bullish pattern signaling potential upward momentum.
Key Observations:
Descending Wedge Overview:
SAND's price movement has been confined within the walls of a descending wedge.
This pattern, characterized by lower highs and lower lows, often precedes a bullish breakout.
Strategic Response to Weekly Imbalance:
SAND has exhibited a noteworthy reaction to a weekly imbalance point.
Imbalance zones often act as catalysts for price reactions, serving as pivotal levels for traders.
Critical Levels: SAND's Journey to $1.6
Wedge Breakout and Liquid Pool at $1.6:
The breakout from the descending wedge is a crucial milestone for SAND.
The $1.6 level marks a significant zone where a liquidity pool has congregated.
Potential Scenarios: SAND's Expedition to $1.6 and Beyond
Wedge Breakout and Momentum Surge:
A confirmed breakout from the descending wedge could trigger a surge in bullish momentum.
Traders are keenly eyeing the $1.6 level for potential liquidity-driven movements.
Validation through Imbalance Response:
SAND's acknowledgment of the weekly imbalance further validates the bullish narrative.
A combination of technical patterns and strategic reactions enhances the confidence in potential upside movements.
Trading Strategy: Navigating the SAND Dunes
For traders considering SAND in their portfolio:
Wedge Breakout Confirmation: Wait for a clear breakout from the descending wedge before entering positions.
Targeting $1.6: Identify strategic entry and exit points around the $1.6 level, considering the liquidity pool dynamics.
Risk Management: Implement effective risk management strategies, given the inherent volatility in crypto markets.
Conclusion: SAND's Ascent and the $1.6 Oasis
As SAND charts its course within the bullish descending wedge, the $1.6 level emerges as a potential oasis—a liquidity-filled pool awaiting exploration. Traders and enthusiasts are watching closely as SAND seeks to transcend its current patterns and dance to the rhythm of a potential bullish symphony.
🏖️ SAND Analysis | 📉 Descending Wedge Breakout | 🎯 $1.6 Liquidity Oasis
❗See related ideas below❗
Have your grains of SAND ready for the bullish tide? Share your thoughts, analyses, and predictions in the comments, contributing to the collective wisdom of the crypto community. The journey through descending dunes brings forth the promise of upward momentum for SAND enthusiasts. 🚀🏝️💚

A perfect day !! - plan for 29th November 2023 Nifty future and banknifty future analysis and intraday plan in kannada.
This video is for information/education purpose only. you are 100% responsible for any actions you take by reading/viewing this post.
please consult your financial advisor before taking any action.
----Vinaykumar hiremath, CMT

Bull Flag breakout on SPY could pull back to fill gapsWhen we take a closer look at the breakout of this flag on the daily, we can see that SPY has 3 gaps to fill. The first being 442, then 431, then the final gap at 424. I expect these gaps to fill in after SPY tappers off around 559 ish if not sooner. Gaps should fill within the next 90 to 120 days before we move back up for the spring summer run of 2024.

SPX: Reached a Resistance After an Insane Rally!The SPX has reached a critical resistance area. As observed on the daily chart above, the index hit the 4,541-resistance line (black line), which was a previous top level from September. This resistance line is quite close to another key point, the 4,567, an open gap since August (yellow line), making this whole area a zone of resistance.
Although the SPX showed some weakness today, there is no sign of a top nearby, and the index would have to make a serious bearish reaction in order to reject the bullish sentiment.
In my opinion, as the index has just hit a resistance area after a relentless rally since October 30 (last bottom), a pullback would be healthy. In this scenario, I see it seeking the gap below the price around 4,421, near the 21 ema. However, it must make a decent top signal to convince me that it will correct.
What if the SPX breaks its resistance area?
In theory, it would resume the bull trend seen on the weekly chart. Its next technical resistance is the 4,607, and above this key point, we see the all-time high at 4,818, near the purple trend line that connects the tops of its Ascending Channel (which is another bullish chart structure).
Therefore, given the multiple chart structures observed in this analysis, we conclude that the SPX is in a mid/long-term uptrend, however, a mid-term pullback would be acceptable now, as it just reached a critical resistance area – the only thing missing is a clear top signal.
Keep in mind that, statistically speaking, November is the greenest month, with an average return of 1.71% (since 1950). December is another good month for stocks, going up 1.50%, on average, and it ends up being a positive month 75% of the time. I’ll keep you updated on this, so remember to follow me if you liked the content.
All the best,
Nathan.

Gap Reports Vastly Improved Q3 Sales And Earnings ResultsThe Gap’s new president, Richard Dickson, 52, has many challenges to overcome. His first meeting with analysts and investors after reporting 3rd quarter 2023 results shows that he has a clear understanding of the Gap’s problems and opportunities. In the three months that he has been on the job, he has closed many unprofitable Gap stores, invigorated Old Navy, and started to reposition Banana Republic and Athleta.
In the third quarter, his efforts have already made an impact on a few key metrics. The company improved both gross margin and operating margins and, most importantly, he is reviving the spirit of the associates and creating a culture of success.
Key Highlights
Net sales were $3.8 billion, a decrease of 7% from last year’s 3rd quarter. The company indicated that those sales results included about 2 percentage points of negative impact from the sale of Gap China.
Diving more deeply into this, comparable sales were down 2%. Store sales decreased 6% compared to last year. The company ended with 3,533 stores at the end of the quarter compared to last year’s third quarter of 3352 stores. The stores are in 40 countries; 2,598 of them (compared to 2,685 last year) are company operated.
Online sales decreased 8% compared to last year and represented 38% of total net sales.
A gross margin of 41.3% showed an increase of 390 basis points versus last year’s gross margin and increased 260 basis points versus last year’s adjusted gross margin. Last year’s adjusted gross margin excluded $53 million in impairment charges related to the decision to discontinue the Yeezy business.
1. The company ended the quarter with cash and cash equivalents of $1.4 billion, an increase of 99% from the prior year.
2. Year to date, net cash from operating activities was $832 million.
3. Ending inventory was $2.3 billion, down 22% compared to last year.
4. Year to date, capital expenditures were $288 million.
5. The Gap paid a third quarter dividend of $0.15 per share, totaling $55 million.
6. The effective tax rate was 15% and includes the benefit of foreign operations.
7. Reported net income was $218 million while reported diluted earnings per share were $0.58.
8. Adjusted net income was $221 million. Excluding restructuring costs, diluted earnings per share were $0.59.
9. The board of directors approved another $0.15 per share dividend for the fourth quarter of 2023.
Technical Analysist
Price Momentum
GPS is trading near the top of its 52-week range and above its 200-day simple moving average.
What does this mean?
Investors have been pushing the share price higher, and the stock still appears to have upward momentum. This is a positive sign for the stock's future value.

$GPS Breaks Double Top Your analysis of NYSE:GPS (Gap Inc.) highlights a nuanced approach to trading based on technical patterns and clearly defined risk management strategies. Let's break down the key elements of your strategy:
1. **Bottoming Pattern with Bullish to Bearish Reversal**: Initially, Gap Inc. exhibited a bottoming pattern, which usually indicates the potential end of a downtrend and the start of an upward movement. However, it seems there's been a reversal from bullish to bearish, suggesting that the anticipated upward trend might not materialize as expected.
2. **Breaks Double Top**: The break of a Double Top pattern is significant. A Double Top is a bearish reversal pattern characterized by two peaks at approximately the same level. A break above this pattern can sometimes signal a potential change in trend, but it's often approached with caution as it can be a false breakout.
3. **Strategy for Entering the Trade**: You're planning to enter a long position if NYSE:GPS pulls back to $15.49. This price point likely serves as a key level based on your analysis, where the risk-reward ratio is favorable.
4. **Risk Management with Stop Loss**: You've set a clear stop-loss condition: if NYSE:GPS closes below $15.49 on a weekly basis, you plan to exit the trade. This strategy is crucial for managing risk and protecting against larger losses if the trade doesn't go as expected.
5. **Philosophy on Trade Management**: Your statement, "Only way to manage a trade is to be in a trade," reflects a hands-on approach to trading. It emphasizes the importance of active engagement and decision-making based on how the market unfolds.
In summary, your approach to trading NYSE:GPS involves waiting for a specific entry point, setting a clear stop-loss level, and being prepared to actively manage the trade based on its performance. This methodical approach is key in balancing potential rewards with the risks involved in trading. Remember, while technical analysis can be a powerful tool, staying informed about the company's fundamentals and broader market conditions is also essential.

TSLA: It Has Just Reached a Major Turning Point (D and W charts)TSLA shares are down today, showing a bearish reaction right after closing their gap at $242.08, which is acting as a resistance level, as expected.
The medium-term trend is up, as TSLA is recording higher highs/lows since bottoming out on October 31 at $194. In addition, it recently triggered an Inverse Head and Shoulders chart pattern after breaking through the $226 area, the neckline of this pattern, which is another bullish reversal chart structure. An IH&S pattern is nothing more or less than a bearish pivot point followed by a bullish pivot point (a lower H/L followed by a higher H/L).
Now, if TSLA really corrects, it could look for its next support levels, such as the $226 mentioned above, which is close to the 21 ema on the daily chart and close to a previous gap as well ($225.40). Despite today's bearish reaction, this top signal has not yet been technically triggered.
Could TSLA reverse and thwart this bullish sentiment? Yes, but it would need to trigger a clear bearish reversal structure (there isn't one so far) or lose the $206 again, because that key point was a previous bottom, and TSLA would make a new lower low if it lost it.
On the weekly chart, we see that TSLA is reacting around a clear support area (yellow line), but is still within a Descending Channel, as evidenced by the purple lines. Therefore, for the long term to resume its bullish sentiment, it must break out of this channel to the upside.
In any case, despite the bearish reaction and a possible pullback, medium-term sentiment is bullish and, in theory, TSLA can still seek higher levels. We'll be monitoring its key points closely. I'll keep you updated on this, so remember to follow me for more analysis like this.

Review & plan for 3rd November 2023Nifty future and banknifty future analysis and intraday plan in kannada.
This video is for information/education purpose only. you are 100% responsible for any actions you take by reading/viewing this post.
please consult your financial advisor before taking any action.
----Vinaykumar hiremath, CMT

DXCM - bottom fishing (swing trade)DXCM had been essentially a range bound stock in the past 3 years, forming what is potentially a long term head & shoulders formation (bearish if break down). However, it looks like the odds of breaking down has diminished with a bullish monthly pin bar now forming after finding support at its 88.6% fib retracement (imperfect double bottom).
The stock is still below its 200 day MA but this MA is less relevant for a stock that is just ranging sideways for the past few years. It can still be a good candidate for swing trade due to its wide range.
The daily chart is starting to exhibit reversal patterns with higher highs (HH) and higher lows (HL). The recent earnings gap up on huge volume was a good catalyst. And the subsequent pullback to almost close the gap (and today's "bullish harami" to signify potential rebound) provided an opportunity to long at lower risk.
Ready to test a small long position with initial stop loss just under $83.50 (allowing for gap fill that might still stand a small chance of happening IMO)
Disclaimer:
This is just my own analysis and opinion for discussion and is NOT a trade advice. Kindly do your own due diligence and trade according to your own risk tolerance and don't forget that money management (ie trailing stop loss and position sizing) is (probably the most) important!
Take care and Good Luck!

Triangle daily TeslaTriangle on the daily chart NASDAQ:TSLA Tesla with a mean possible target of 177 range indicated.


#bitcoin #btc has closed a historical #CME #GAPAs you see on the chart, there was very important #CMEFUTURES gap at 35 - 36K area which was opened in #luna collapse times. Now, #btcusdt price has CLOSED this historical gap and what now?
It' s too early to say #btcprice will go on through the #bullrun or " BTC will directly go to close the OTHER historical GAP at 20 - 21K region!.."
Now, just relax and watch the #market and especially #BTCdominance. #BTCD will reveal the direction of the market. I will update my thoughts.
As you see on the chart, there only 1 #CME #FUTURES #GAP left at 20 - 21K region. Don' t underestimate this and also don' t be pessimistic, just carefully watch #bitcoin moves.
NOT FINANCIAL ADVICE. Dyor.

BTC STRIKE VOLUMEThank you for reading our update. Please remember that this is not advice for trading.
BTC Looks to have a new uptrend volume

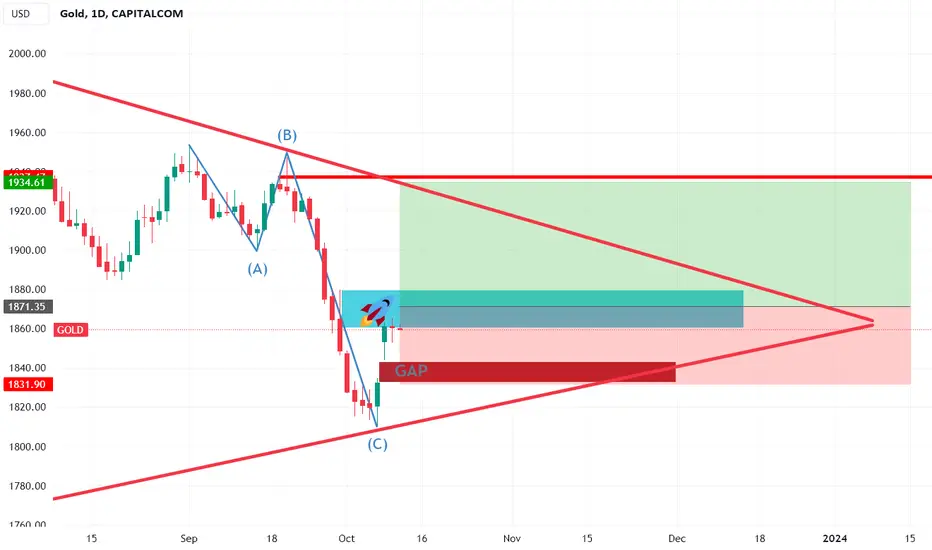
GOLD / XAUUSDIn my opinion, you should always close the GAP before starting a process! But we've seen cases where it wasn't closed, and they suddenly pulled it up. I think the same thing will happen here! It's been the third day, and they still can't close the GAP! What's also important is that many are preparing to close the GAP and start the process. I believe that if they wanted to close it, they would have done so by now.