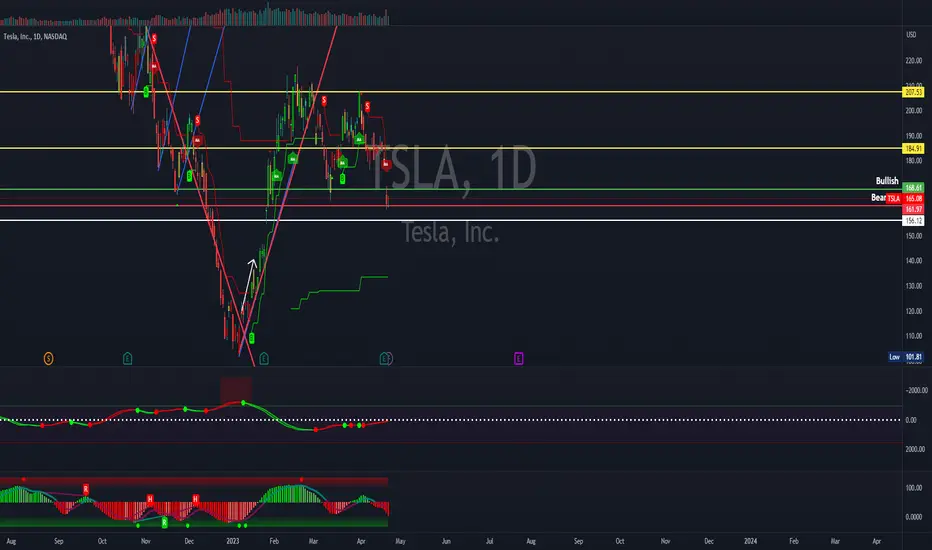
Insane run losing charge? $TSLAWhat to make of the fact Tesla is losing steam? The market share will be threaten from this point as more EV's are making their way to the fray. This is the second hump on what looks like an M pattern. Is this the first sign of Tesla filling some lower gaps starting with the one below 156?
Bullish Case - This is the leading EV maker. With the combination of price drops and tax credits we are looking at the consolidation before a break to fill the gap above. Lets see if this support holds and with is market share it should be an easy task.
Bearish Case - Look at the combination of lower highs and lower lows. It is working on a channel to work it way to break out of the M pattern it is forming. If so, look for that measured move under 140. This is a tough ask, after the gap I can see the psychological number of $150. Either way the gap below will be filled.
Gap
Bitcoin Gap Trade: $20k and then up to $35kShort-term bearish, long-term bullish.
I'm not currently trading Bitcoin and am only stacking, but I use the short-term technicals to time my buys which have been nearly every week since September 2022, and my current cost average is ~$20k.
Bitcoin price is attempting to hold above $28k after breaching but failing to hold above $30k this past week. The reversal here isn't surprising considering that price just pretty much ran from $20k to $30k unhindered so a pullback was expected at some point given the bearish sentiment that still surrounds crypto in general.
As for gap trades, Bitcoin tends to fill gaps sooner rather than later compared to other assets so the most likely path for Bitcoin going forward from here is a fill of the gap down near $20.5k in the coming weeks, price finding solid support in that range, and then a move higher to fill the gap up in the $35k range in the coming months.
Good luck out there traders.

TSLA: Trading at a Critical Support Line.• TSLA crashed after earnings, but it seems it wants to stabilize around the 163 support line;
• So far, TSLA has been moving with technical precision, as we already discussed this bearish scenario in our previous analysis (link below this post, as usual);
• Now, in the daily chart, TSLA just hit its technical support at 163. So far, there’s no bullish reaction indicating that it is doing a bottom sign – but this could change very soon;
• If TSLA loses the 163, then it’ll probably try to fill the gap at 146 in sequence.
• In the weekly chart, the situation is critical, as TSLA is on the verge of triggering a Descending Triangle chart pattern downwards;
• What’s more, the last two candlesticks hit the 21 ema as a resistance as well. This reinforces our idea that it could hit 146;
• In order to avoid this bearish scenario, TSLA would need to react as soon as possible, and trigger an extremely powerful bullish reversal pattern – so far, there’s no such sign;
• I’ll keep you guys updated on this, as usual.
I’ll keep you updated on this. Remember to follow me to keep in touch with my daily analysis.

Will TSLA fill the gap at $146?The current state of Tesla's stock has the potential to go one of two ways. Firstly, there is the possibility of a bounce in the near future which could lead to a nice swing opportunity for traders over the next several weeks. Secondly, there is a gap from 26 Jan from $146.41 to $154.76 which still needs to be filled. It's possible that this may happen next week before buying pressures come in. I am personally a buyer in the gap-fill zone.
There is always the chance that the stock could go in either direction. It's important to do your own research and make informed decisions based on your own personal financial goals and risk tolerance.

BTC 15m Bear Flag without VPVR ResistanceWe have a school example of the bear flag formed on under-hour timeframes, and it targets the price of 28300, which perfectly fills the gap in historic volume shown on the VPVR on the right.

BTC 15m Head and Shoulders with neckline on VWAPHead and Shoulders fully formed in 15 min timeframe. Neckline is a VWAP that is being broken and retested at the moment. The target price of the formed pattern is below 28650, which is the beginning of a VPVR gap on the right. Fibonacci 1.618 regression support is at 28300, a target price of the bear flag I posted about yesterday. You can see it in the link below.

BA Gap Fill SetupBA 65m: Acute analysis potential gap fill to upside contingent on auction acceptance. Positive ER from UAL, expanded partnership with Invictus Games this morning, and ER next week catalysts for participants// 215.55 is a KL to be watched as it is where auction failure has occurred five times YTD// KLs 206.80, 208.77, 208.94, 210.13, 211.50, 212.56, 215.55// Beta 1.43, ATR 5.72, IV: 34.09%// Price at time of publish: 210.65


USOIL - Back we go into the gap of dreams! OIL has been a very interesting commodity to look at recently - I have had my eyes on this HUGE gap for a while now and it looks like we are finally inevitably making a return into the range of it.
BE CAREFUL HERE - these areas of price are hypersensitive and can provide ugly conditions on intraday charts if not approached correctly.
I will personally be closing my short positions once we protrude the box shown on the screen capture - I will re-assess where we go from here in due course.
Until then, stay safe and happy trading!
Best wishes,
Jake

USOIL stable after the gap 🦐After the test of the lower support at the 66 level and the recent decision of several top producers led by Saudi Arabia to output cuts the price is back at the top of the previous range between 72-82.
I can see the gap which has to be filled sooner or later but in this moment the target might be the upper level where a lot of liquidity stays.
How can i approach this scenario?
I will wait for a potential break of the resistance area and in that case i will move on the 4h chart to check for a nice entry according to the Plancton's strategy rules.
If the price will move to the gap i will monitor the supports on the 4h time frame to identify a possible lower entry according to the MTB Strategy.

QQQ hourly Double Top forming, target would fill gapsLooks like a likely double top forming in QQQ. I think it's likely to play out as the double top target move down would also fill a couple gaps in the hourly chart.

GPS $10.74 - $11.36GPS Looks ready for a bounce up to $10.70 and possibly $11.36.
$10.70 would hit the top of the channel and the 200 day moving average.
$11.36 would be cover a gap fill.
Break higher than $11.36 could see $14.00

ALGN - Will earnings be the catalyst?ALGN gapped up strongly on Earnings beat during its last earning on 1st Feb23. It then subsequently corrected and partially closed the gap, finding support eventually @ 297 the previous neckline region (now tuned support) and also right at the 38.2% fib retracement of the big recent upswing AB.
Since it's last Earnings, the stock had been wedging in a range but what is clear is that the bogger trend is likley still on the upside as there was a Golden Cross that occured on 14 Feb (nearly 2 month ago) with both the 50 and 200 day MA sloping up now (mild slope for the 200 day MA as it will take a longer time to refect the new trend). Plus the fact that the stock has been holding above it's basing formation neckline.
Any dip back towards the neckline region (297-303) could be an opportunity to long. I suspect the coming earnings expected on 26th April could provide the catalyst to propel it above this trianglle pattern. However, trade earnings at your own risk.
If trade works out, I will be watching to scale out (partially) from 425 - 455, and manage the rest of the position with trailing stops.
Disclaimer: Just my 2 cents and not a trade advice. Kindly do your own due diligence and trade according to your own risk tolerance and don't forget that money management is important! Take care and Good Luck!

USOIL on a hot level 🦐 After the test of the lower support at the 66 level and the recent decision of several top producers led by Saudi Arabia to output cuts the price is back at the top of the previous range between 72-82.
I can see the gap which has to be filled sooner or later but in this moment the target might be the upper level where a lot of liquidity stays.
How can i approach this scenario?
I will wait for a potential break of the resistance area and in that case i will move on the 4h chart to check for a nice entry according to the Plancton's strategy rules.
If the price will move to the gap i will monitor the supports on the 4h time frame to identify a possible lower entry according to the MTB Strategy.

SE - Formed a BaseSE hit it's lowest point on 9 Nov22, several days before an earnings beat pushed gapedthe stock up strongly. However the rebound since had been volatile until another earnings beat on 7 Mar23 gapped the stock up strongly again, this time well above it's 200 day Moving Averae, and a Golden Cross materialised a few days later. The Gap that happened this time had remained unfilled since.
The stock has clearly turned the corner. Looking to accumulate at this recent dip. However, more momentum might materialise only if and when the stock eventually is clear and stay above the neckline @ 92.
Disclaimer: Just my 2 cents and not a trade advice. Kindly do your own due diligence and trade according to your own risk tolerance and don't forget that money management is important! Take care and Good Luck!

EXPLAINED: Runaway GapLESSON OF THE DAY
Runaway Gap
A Runaway Gap is a continuation move where the price gaps in the middle of a trend e..g Up or Down.
The gap is a void (where no prices overlap between two candles)
And then the price follows the previous trend.
I like to think of a Runaway Gap as a horse that goes from trotting to galloping.
The trend then starts to accelerate and continue in the direction.
Specifics for this example:
· Previous price moves in a downtrend.
· Price then gaps.
· Price then follows the continuous downtrend.
Please react so I know to provide more daily lessons...

SPY/QQQ Market Bias & Top Stock Watches - 4/4/2023 - Choppy BullBias: Getting into some resistance near 415 but still have room to move higher. QQQ has a pretty clear void higher
Top Watches: Long - AMZN, ROKU, MRO. Short - AMC, ZIM, NAPA.
Tune in to my stream at 9:25 EST for my full list of top stock watches and to watch me trade them Live!
Follow @JLaing for a timely morning bias of the market like this, top stock watches, and live day trading every morning!

USOIL DailyPrice is nearing a key level zone that has acted as support & resistance previously multiple times. This key level zone also aligns with the 61.8 fibonacci retracement of the long term impulsive downside movement that took place. I am looking for price to make a move up into 82.50 where on the lower timeframe I will look for confirmation of a bearish reversal, as there is a gap that needs to be filled after opening higher this week. Definitely a setup I will be waiting on & watching closely for a big trade as Oil has had a lot of volatility & movement.

✅USOIL GAP CLOSURE AND STRONG RESISTANCE|SHORT🔥
✅USOIL gapped up in an
Unprecedented way today
And almost immediately
Hit a strong horizontal resistance
At 182.00$ so I think we
Will see a bearish correction
And a gap closure towards
The 78.5$ level
SHORT🔥
✅Like and subscribe to never miss a new idea!✅

SPY/QQQ Market Bias & Top Stock Watches - 4/3/2023 - Choppy BullBias: A bit extended up, a pull back would not be a surprise but lots of buying pressure so could be a bit choppy.
Top Watches: Long - ISEE, APLS, MPC, EDR. Short - FRO, TRMD.
Tune in to my stream at 9:25 EST for my full list of top stock watches and to watch me trade them Live!
Follow @JLaing for a timely morning bias of the market like this, top stock watches, and live day trading every morning!

Bitcoin - All levels on the weekly chart (must know!)
You can use these levels for your trades, because I am pretty sure we will see a reaction on all of them! These levels will be respected even on the 1-minute chart, so do not underestimate them!
If one of these levels is destroyed, it's likely that the price will move to the next level specified on the chart.
On the bullish side of the chart, we have a strong level that will be tested very soon. It's the POC of the previous market structure and a strong horizontal level at 29765.
Above this level, there is an unfilled GAP between 37836 and 32399. This is the only major unfilled GAP on the Binance chart. These types of gaps are called fair value GAPS.
0.618 LOG SCALE FIB (38981) is definitely the strongest resistance out there. Also, we have a POC of the previous structure exactly at the same level. If the price gets to this level, we will experience a massive, brutal crash. Make sure you get informed when we reach this level, so follow me to stay updated!
0.618 LINEAR SCALE FIB (48553) is at confluence with the previous swing high. It's definitely a strong resistance as well, but if the bulls destroy this level, then it opens the gate to a new all-time high (69000), which is the last resistance!
On the bearish side of the chart, there is only 1 strong level at this point, and it's the previous swing low at 15476. I think we will reach this level sometimes later this year or next year!
2 unfilled GAPs below the current price are also strong supports. They are between 22602 - 26508 and 17176 - 19549. I am telling you that these gaps are extremely massive, and the chances of filling them are soooooo high, sooner or later.
If the bulls fail to hold the 15476 level, we will go to 10k! It's a possible scenario, and it could happen, and the chances are not low at all.
Otherwise, this is a bearish Elliott Wave count, which is still my main count. Of course, I also have a bullish count, but I will switch to it after we reach levels above 43k.
This analysis is not a trade setup; there is no stop-loss, entry point, profit target, expected duration of the trade, risk-to-reward ratio, or timing. I post trade setups privately.
Thank you, and for more ideas, hit "Like" and "Follow"!

Trade so easy with FAIR VALUE GAPS!Hello trader, you look great today! I have a useful trading tool to offer you. If you are experiencing positive feelings towards me, please consider following me and helping to increase my exposure.
FAIR VOLUE GAP
First, go to tradingview and search up Fair Volue Gap . Now, you can see your chart dashed lines, to see levels based on these pages. FVG and to make this set up a lot better though we want to clean this up and only show significant Fair Volue Gaps by going into the settings and selecting the auto threshold. What this does is allows the indicator to detect the average best size of each Fair Value Gap to filter out insignificant ones.

SPY/QQQ Market Bias & Top Stock Watches - 3/31/2023 - Bull GrindBias: Gap up over yesterday with room up to ~408. Support at 402.
Top Watches: Long - RUM, SJR, AI, CSCO, MSFT. Short - GNRC
Tune in to my stream at 9:25 EST for my full list of top stock watches and to watch me trade them Live!
Follow @JLaing for a timely morning bias of the market like this, top stock watches, and live day trading every morning!
