FCPO TRADING : 85) a possible false breakout...hi, this is trade 85) frm haidojo trading. fcpo-oct has emerges and becomes the new active month...so if you have traded fcpo long enuf, u must know then onli trade the third active month...the resistance 2560 has officially not broken yet...so we wait for :
1) IF the price move back to retest the 2560 and failed, THEN we have a Double-Top formation, indicating short
2) IF there is a gap down today or tmr, THEN the 2560 candlesticks yesterday has become a "lone island", forming some kind of head...so we can still go for short...
3) IF price juz settles calmly near 2474-2480...THEN rebound...go for long, nothing has changed...uptrend persists...
support level : 2475-2480
resistance : 2560
higher resistance : 2630
WARNING : this is solely for educational purpose onli, it is not an indication of buying nor selling therefore trade at your own risk...
**welcome to leave some comments, your "LIKE" and "FOLLOW" are highly appreciated and they are my main source of motivation to proceed further to post more valuable contents...**
Gapdown

Woah! This thing identifies SPY gappers!So previously, I released an indicator called "Bunch of Numbers", believing that it was pretty useless. BUT guess what? It turns out that SPY gappers (up and down) have pretty similar sequence of numbers.
WARNING: these same numbers have also caused SPY to gap down!! A "Bart" pattern with these numbers at the end will almost always be a gap down.
My methodology:
1) 3 minute chart
2) has to be within 15 minutes of close. Some of these only appear in the last 3 minutes of close.
3) 7's at the bottom of the screen signify that price is touching the 200MA on the 3minute chart.
4) There is no logic or reason behind why a number is labeled "9" instead of "5". It's just a label that the programming gave to a set of conditions. I could have easily labeled these candles with the alphabet
5) Like I said, these same numbers have been known to also GAP DOWN><

BABAAlibaba (BABA) gapped up recently on a Bullish Kicker candlestick, and was followed by an even larger gap up before a selloff today. Today's close formed a Dark Cloud Cover candlestick, and may indicate a downward continuation. Mixed with new global tensions rising with China, BABA may look to gap back down.

Trading Nose Dive . Small account ? ( No problem ) Hi Traders .
This guy today tuck nice dumpster dive on offering. NASDAQ:ROSE
Left big gap to fill . Info located on the chart gives you multiple scenarios . If you don't trade gaps its one of the oldest trading strategies but also can take loong time to play out and some timers they also don't play out . Its trading nothing its for sure . So keep that in mind . I did post one trade and payout recently link bellow .
Feel free to comment and hit that like if you can . More support from community more content I create .
My strategies are simple and I'm looking for trades with the most potential profit possible I can find and that are friendly for small accounts .
So if you like to be informed follow .
Here its the latest play . 60% gains . Some meat still left on the bone with second gap above IMO . But first i think we will see pullback after this rally .,
screen shot for you ,
Cheers .
See you next time .

QQQ 15min SMAs about to cross and gap down QQQ 15min SMAs about to cross and gap down. Island top formation like SPY, but delayed.

$SPY Short Idea | Wave 1 Repeat?Holding 22 shares of TVIX to hedge market atm. Will be looking to grab more after we test & come back down from $311
DotcomJack

BTC1! - Weekly CME Gap update (05/25)BTC1! futures opens with a small gap (~1.5%) down.
Will we close it or not?
I think we will and it get closed within a week. The previous one was closed one day later.
So, if to trade the gap here, it could be something like long $8800, stop below $8600, target $9-9.1k. Maybe we'll get a big candle in that area and fast rejection off $9100.
Hit the "LIKE" button and follow to support, thank you.
Information is just for educational purposes, never financial advice. Always do your own research.

INFRATEL ::: LONGInstrument: INFRATEL
Time frame: 3 hours
indicators:
Stochastics: bearish
PSAR: bearish
My analysis:
CMP: 152.75
Expecting INFRATEL to gap down / sink to 145 - 143.70 on Monday.
Once it starts retracing back upwards would like to buy above 143.70 to 145 keeping the SL below the low of the day for target 153.75
RISK DISCLOSURE:
Technical analysis of FOREX and INDIAN MARKETS. We are not SEBI REGISTERED ANALYSTS The views expressed here are for our record purposes only. Please consult your personal financial advisor before investing. We are in no way responsible for your profits/losses what so ever.

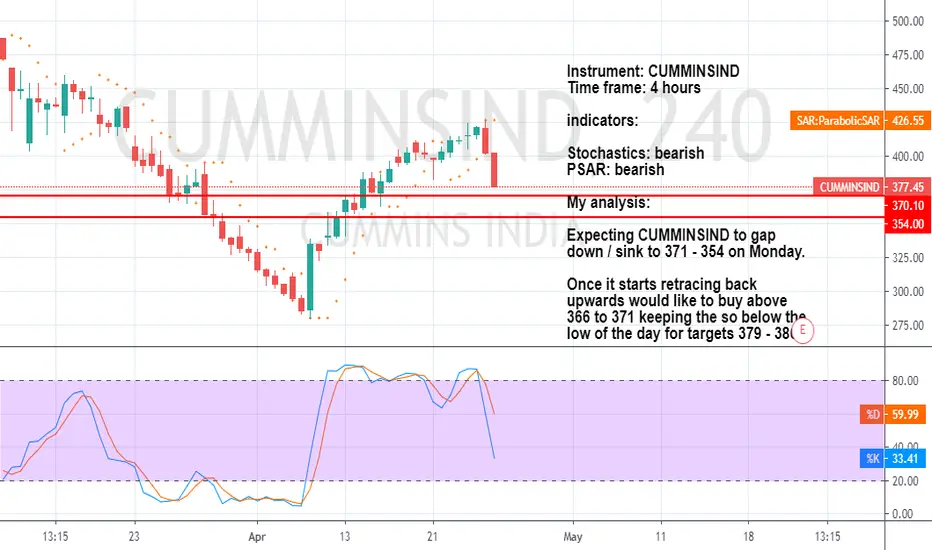
CUMMINSIND GAP DOWN AND BOUNCEInstrument: CUMMINSIND
Time frame: 4 hours
indicators:
Stochastics: bearish
PSAR: bearish
My analysis:
Expecting CUMMINSIND to gap down / sink to 371 - 354 on Monday.
Once it starts retracing back upwards would like to buy above 366 to 371 keeping the so below the low of the day for targets 379 - 386.
RISK DISCLOSURE:
Technical analysis of FOREX and INDIAN MARKETS. We are not SEBI REGISTERED ANALYSTS The views expressed here are for our record purposes only. Please consult your personal financial advisor before investing. We are in no way responsible for your profits/losses what so ever.
BANKNIFTY ::: GAP DOWN ???DATE: 20 APRIL 2020 TIME: 20:05
INSTRUMENT: BANKNIFTY
: F&O
TIMEFRAME: 1HR
CMP: 20488.55
INDICATOR PSAR: BEARISH
INDICATOR STOCHASTICS: BEARISH
EXPECTING A GAP DOWN WHEN THE MARKET OPENS TOMORROW.
SELL BELOW: 20429
STOP LOSS:20577
TARGET 01:20331
TARGET 02: 20259
Technical analysis of FOREX and INDIAN MARKETS. We are not SEBI REGISTERED ANALYSTS The views expressed here are for our record purposes only. Please consult your personal financial advisor before investing. We are in no way responsible for your profits/losses what so ever.

Update: 1 gap down left and a few gaps up $TSLA Update on my previous idea: the gap up has been closed, 2 gaps down have been closed with more gaps up created.
We are closing in on the 3rd gap down which also coincide with the golden 0.618 fib and will very likely be closed next week.
I'm expecting a rebound in the days leading to the Q1 delivery numbers announcement with maybe the date given for battery day the last week of March too.
Bonus added: a gap even lower from October that could be closed as most countries already in hidden recession are now closing everything to prevent the virus from spreading and trying to flatten the curve.

S&P500 Gaps Down -4%#sp500 #spx #sp1! – S&P500 futures have once again gapped down as markets reopened for trading tonight, currently down -137 points for a -4.6% loss.
Price is now below the 50% Fibonacci retracement level which is the midpoint between the low seen in October 2018 and the high made in February 2020. 50% retracements after a large/long uptrend are generally viewed as healthy corrections within the overall price advance and represent good buying opportunities, while further declines below the 50% Fib indicate that the previous bull trend is at risk of turning into a bear trend, at least in the short-term. A sign that the bull trend is likely over and a new short-term bear market is forming would be a move below the 61.8% fib level which is the golden ratio retracement. Should price fail to regain the 50% level this week, the likely target will be the 61.8% fib shown in red at 2729 which would be another -3% decline from current price.
Also in the chart is a broadening wedge pattern, also know as a megaphone pattern due to its shape resembling a megaphone. A broadening wedge is a range where price is holding between two diverging trendlines, or lines that are moving apart. These lines are where traders can expect price to trade between, or find support and resistance at. A break above the upper wedge line is viewed as bullish and the beginning of a new uptrend, while a break below the lower wedge line is viewed as bearish and the beginning of a new downtrend.
In October of 2018 price broke above the upper wedge line and began the climb to new all-time highs peaking in February of 2020. While this move was viewed as bullish uptrend continuation, price has now fallen back within the wedge indicating that the previous break above it was a blowoff top rather than uptrend continuation. Now that price is back within the broadening wedge pattern, the potential for a test of the lower wedge line is now a possibility.
For now the level to watch this week, or possibly even on Monday, is the 61.8% Fibonacci retracement level highlighted in red. A move below this level is likely this week considering the coronavirus fear currently gripping markets and its impact on not just the US economy, but also the global economy. This weekend saw the situation deteriorate in regard to the virus and the climbing infection and death rates in the US, as well as new fears launched by Saudi Arabia as they attempt to put US shale out of business by increasing oil production which as of now as oil trading -22% lower than Fridays close.
It appears as though this week could be even more volatile than the previous two weeks, which both saw record price moves, moves not seen since the global financial crisis in 2008. We may be in for another emergency rate cut by the Federal Reserve ahead of their planned meeting which takes place March 17th-18th. Two emergency rate cuts within two weeks would be another new milestone and further evidence that the US economy is teetering on the edge of financial disaster ahead of what appears to be an inevitable slowdown in economic activity.

Oil Gap Down Open To Target Level#oil #cl1! – Oil saw a gap down tonight to the target area shown in my previous chart shared this morning, and for now is attempting to hold at the lower parallel channel line that I drew which was an anticipated support level based on recent price trend. Price opened at $32.87 which is a -20.37% decline from Friday’s closing price of $41.28.
Still very early in futures trading, but I’m expecting volatility in price while waiting for US traders to digest this move overnight and make their move tomorrow at market open before sharing another update. If Saudi Arabia is determined to flood the market with oil in attempt to put US shale oil out of business, we can probably expect them to continue beating down price this week with talk of more oil output on their end in the coming weeks.
S&P 500 Futures Gap Down#sp1! - S&P500 futures gapped down on the first night of trading following the worst week for stocks since the financial crisis. A continued push down was expected after more negative news flowed out during the course of the weekend, most notably in the U.S. where we saw the first Covid19 death, as well as localized quarantines and self-isolation being recommended in a few states.
The main levels to watch for an indication of what Monday's trend will be for stocks when markets re-open are shown in orange. The upper orange line is where Thursday's price closed and where Friday's price were unable to close above. The lower orange line is where price bottomed on Friday. A move above the upper line would indicate that traders are attempting to form a bottom, or relief rally; a push below the lower orange line would indicate that traders aren't done selling the Covid19 fear as new lows are continuing to be made.
The PPO is still in a hard decline, while the RSI is attempting to level off in oversold territory, though the RSI could remain oversold for quite some and doesn't necessarily mean that prices are prime to buy just yet.
Judging by the continued deterioration of the situation, and lack of containment world-wide, we can expect traders to be hesitant to push prices higher until/unless the Federal Reserve and other global central banks step in with lower rates. Even then, the reactionary bounce on that potential event will likely be short-lived as the overall outbreak looks to be just kicking in to gear.
Good luck out there this week, more updates on SP500 after the markets close tomorrow, or in the early morning if there is a significant price move or updated Covid19 news.

$TSLA $TSLAQ - 1 gap up but 3 gaps downUpdate from my previous idea posted as there is a 3rd gap down from 10-13/01/2020 between 478 & 492$ which is still recent and close enough from my macro 0.618 fib (180-923) to be considered.
I disregard any gap below 5$ or previous to 2020 up trend.
Again I don't know what I am doing there...

TSLA: 1 gap up at 740$ or 2 gaps down at 590$ & 510$Following the article www.investopedia.com it would make sense for the stock to keep going lower and close the 2 recent gaps:
- 29-30/01/2020: 590-618$
- 17-21/01/2020: 510.50-518.5$
Or it could keep going on the rebound from closing/afterhours today and go close the gap between 739 & 776$.
As always, I don't know what I am doing there...

CAC 40 At Crucial Support CAC40 opened With massive Gapdown trapping all the bulls at higher level
This must have forced the small leveraged Trader to exit Their Position at the lower rates forcing the index downwards.
Index can Face Heavy Selling Pressure from tops
All the trapped brave Traders who didn't exit their position in today's fall will be waiting for their prices on the higher side.
So Sell on rise pattern could be seen in this index
CAC40 Is currently trading Below its 100 EMA at crucial Support Level of previous swing low.
Fresh Sell Off Can be Seen Below The swing low till 5720 Levels which is 200 EMA and 4th Decembers Low.

S&P500 futures opened the week with a GAP DOWNAs expected with last week’s idea post, the correction phase is underway, and it is rather massive with a Gap Down of -1% to open the week.
IF the momentum continues, this is very bad news for the equity markets. The current outcome and probable continued momentum is triggered by the weekend surprise of Northern Italy COVID-19 outbreak and lockdown, as well as South Korea’s escalating infections and deaths, including a national highest alert.
These two events were not expected and the two countries have over taken Singapore as the top gunners, after China.
On the heels of topping out last week, the technicals for this chart is very bearish, and would likely continue to be so for the rest of the week. In the last year, this is the second Monday Gap Down in the /ES futures Of more than 1%.

V Symmetrical TriangleV gained momentum in January as it announced new displacement technology for 2020. The stock has a Professional Trader setup for triggering High Frequency Trader algorithms, which ran the stock up with momentum. Profit taking quickly halted the run temporarily with a gap down. Smaller Funds VWAPs triggered on the Buy on the Dip, which created another 4 days of profit taking.

GOOG Buybacks Support PriceGOOG buybacks triggered after a big gap down, on a down market day. The stock is still at risk for more downside action unless buyers move in soon.

cadjpy potential short tradecad jpy opened on a sunday with a gap down, waiting for price to fill that gap again before I can look for shorts.

XLNX Bottom Formation StrengthensXLNX had a sudden Inverted V Topping Formation during the summer of 2019, but has recently filled the gap down and is moving up to a bottom completion.

Pinterest sideways move till earnings reportHi all,
There is no particular reason for PINS to make a move at this moment. In my opinion it just follows the market's trend and i am expecting it to accumulate on the upward channel till next earnings report. At this time i am expecting a gap up or gap down depending on the results. To be honest it's a very difficult trade but i think that since the market is doing well that they are not going to risk another bad quarter and they somehow show the results in a positive way and keep anything bad for another quarter.
