Head and Shoulders to fill the gap.We got a head and shoulders near the top of a range potentially preparing to fill a gap to the downside.
Gapfill

Possible Gap Fill on PINSIf the stock enters the gap at $61.00, might look for an entry for a long position at $61.30 for a gap fill. 5 point move possible if the entire gap gets filled. Entering sooner than $61.30 is extremely risky

FB - Opportunity to long soon?FB has retraced nearly 8% from it's recent high @ 377.55 to a low of 347.70 today. It has since rebounded off today's low to 351, which is at gap fill as well a the 61.8% fib retracment of the recent AB swing up. A mini pin bar (daily) appears to be forming right now.
Look to long next day if it goes above today's candle hi of 353.8 with initial stop loss just below 347.70. Looking for initial profit @ 377.
Disclaimer: TA is about improving our odds of a successful trade (not a guarantee). This is just my own analysis and opinion for discussion and is not a trade advice. Kindly do your own due diligence and trade according to your own risk tolerance and don't forget that money management is important! Thank you. Do give me a thumbs up if you agree. Feel free to let me know what you think! :)

QCOM gap fill playQCOM gapped up from recent earnings and then had an inside day setting up for a big move either up or down. There is an enormous gap above from 152-162 as well as a smaller gap below from 146.50-143.
Considering the volume on the earnings breakout from the ascending triangle, QCOM is leaning more bullish but can be played either direction.
Calls above 152
Puts below 146.50


JPMorgan to $80 by October 2022NYSE:JPM
Jamie Dimon and his army of minion traders at $JPM are printing the classic bear pattern of a H&S top (green). Measuring that formation, that should put us at a local bottom sometime in October.
From there I would expect the Santa Rally to be our retest of the neckline, before creating the base of the much larger H&S pattern in yellow. Measuring that pattern out gives me my price target of $80 when it is all said and done by October 2022.
And yes that is a price gap at $110 (purple box) that I expect to be filled in these moves.
- Penny

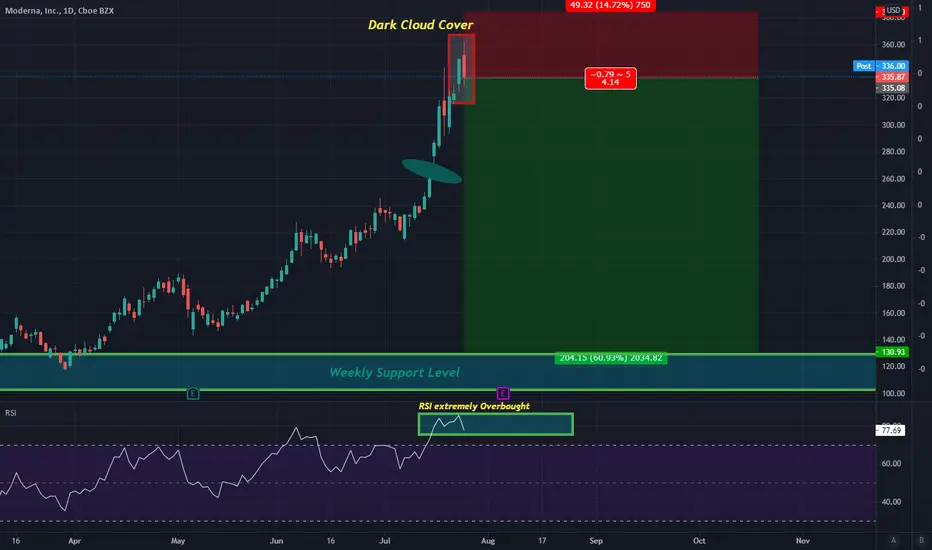
Dark Cloud Cover on daily with Overbought RSI and Gap BelowThis is a second attempt at finding a short opportunity on MRNA after the first failed i have waited and i now see a new signal.
I expect that we will see a daily reversal in MRNA from here in respect to the Dark Cloud Cover candle Close we just got on the daily. At minimum we will see a reversal to fill the gap below but at the worst we will go all the way down to or weekly support level i highlighted in the chart.
$DIS about to make some crazy moves!-Massive consolidation here on the 4hr once we fall into the gap we will grind back up.
-look for nice volume and strong clear trends only then i will take a position.

Cup and Handle! Long CRNCI am bullish on CRNC on the basis of a cup and handle formation that offers an attractive risk/reward. The cup and handle is a bit "broken" only because of a gap-up due to CRNC being added to an index. We have now closed that gap at $109 and it appears that the bullish move is ready to continue. I am eyeing two targets for this trade at the 0.786 fib line and near the previous ATH of $139 where it would likely face resistance.
Other considerations:
1. This move is dependent on growth stocks, so if Treasury yields rebound and it forces a risk-off market, this trade will likely fail.
2. Earnings are coming up and as we can see, CRNC is volatile, so expect a sharp move following the report.
TP1: ~$126 (+16%)
TP2: ~$137 (+25%)
Published trade statistics:
Win Percentage: 6/8= 75%
Avg Gain on Wins: 12%
Avg Loss on Losses: -13%
Weighted Avg P/L % : 5.98%
Pending Trades (including this post): 3
- Sultan of Chart
*This is not financial advice*

K Daily SetupNYSE:K daily long setup:
Over the last few weeks prices have filled in the gap made on the May 6th earnings and then formed a double bottom at that support level. On Friday prices broke the top trendline and MACD has crossed positive.
Buy taking out Friday's high at 64.57
Stop Loss under double bottom at 62.41
Profit Target 72.78
Risk/Reward 3.8

Over-Extended Stock looking for corrections in the futureI will be challenging this stock's bluff over the next couple of weeks.

GSAT is good for long term here!!! GSAT touches the trend line on daily chart, you can take risk to entry around $1.45 and wait for a bounce right here. Moreover, it has a gap down at $1.32, and it could fill the gap around there. Anyway, Gsat is a good stock for long term,.

Mind the Gap!*For entertainment purposes only. Not Financial Advice. Not Trade Advice. Not Miami Vice. DYOR
How low can she go?
Gaps in price action are filled approximately 90% of the time at some point in the asset's price discovery process. Daily Gaps are significant! Here is where 🦈I'm long MIR.
KUCOIN:MIRUSDT COINBASE:MIRUSD BINANCE:MIRUSDT

Breakout opportunityMove up and close above $16.85 might open the door to a solid breakout and gapfill.


EBIX the Mother of All GapsThis small cap gem should be a fun one for swing traders as the asset has nicely put in higher lows and higher highs in price for the last 15 months or so.
And now at this moment it has 2 nice bullish setups going for it:
1) support at its $31 dollar level where there is also the 21 MA just below it as well.
2) a giant crater of a gap that needs to be filled still at around $47.15.
If the price was to fill this gap that would result in a +35% move to the upside from where we currently sit.
The ultimate target sits around $54, however.
If this $31 level continues to hold, lookout as this asset could move quickly.
Weekly candle close below $31 would be enough risk for me to exit the trade.
Keep that bearish scenario in mind as many traders may be attempting to play this gap also.

$DJI$DJI looks ready to fall soon, with overall markets looking somewhat "bullish" I believe we'll see a blow off top event happen before our drop...if we get one. Other factors such as, global taxation from G20, +10% inflation, and surprise tapering should cause a sell off soon. The chart is forming a rising wedge breakdown pattern in my opinion, with a gap fill around 24.43K. Good luck everyone :)

CODX ready to pop!Bullish MACD divergence, gap to fill at 12, closed over the 50ema for the first time since late march, and buy signals screaming reversals to double digits!


Netflix bulls coming back?With QQQ strong as they are, netflix gap fill possibility is looking more plausible everyday

SFIX - (up) Trend to continue after gap fillSFIX gapped down strongly on 8 March after earnings, leaving a lot of suffering bulls who had betted on the wrong side of this earning. The stock finally hit a low on 11 May and began it's recovery, cummulating to a strong gap up on 7 June, this time on earnings exceeding expectations.
However this gap up was right where the prior gap (down) got filled. Those long suffering bulls who had previously betted on the wrong side of earnings saw it as their chance to exit at breakeven or smaller losses. This pushed the stock back down until the most recent gap (up) got filled @ 57.94 (support).
Having establised a support at 57.94, it's now safe to bet on it's uptrend continuation with initial stop loss several ticks below this support. Short term traders can consider to scale out at the 100% and 161.8% extension levels.
Disclaimer: TA is about improving our odds of a successful trade (not a guarantee). This is just my own analysis and opinion for discussion and is not a trade advice. Kindly do your own due diligence and trade according to your own risk tolerance and don't forget that money management is important! Thank you. Do give me a thumbs up if you agree. Feel free to let me know what you think! :)

Bullish- long playENPH has gotten relatively beaten down and taken a much-needed pullback. However, has held up fairly well amidst all of the intraday volatility in the markets and is now is back above its 200day SMA where it has previously found support. Needs to hold above the 200day SMA. Additionally, does look like a fishhook pattern forming, and am looking for ENPH to fill the gap circa 153-167. Bullish
PT1- $152.99
PT2- $169.10

