PCI Gap fill play - 20.55 Thought I published this yesterday, was thinking that the gaps on this might get filled. Not overly optimistic about a run down to 20.35, let alone the one below 20, compromising with an order for a few. Tiny starter position at 20.55 for 14 shares, might just say screw it, we may get get some more bearishness tomorrow or the next week, but as we close in on the holidays, unless pension fund re-balancing manifests as we've been warned for the last few weeks (I think they did it during the election), or another catalyst manifests, I'll just by somewhere in the current vicinity and look forward to that firehose of 2.30$ USD per month pumping profits into my investment account. Monthly payer, so every bit counts when you're small potatoes.
RSI is confirming a breakdown in price on the 30 min, but might be using 4 hr to confirm buy signal if my price is not met in the next day or so. Being impatient on more than a couple of plays in the last week, but so far, any dip seems to be bought up in whatever I am trying to purchase at a discount.
Gapfill

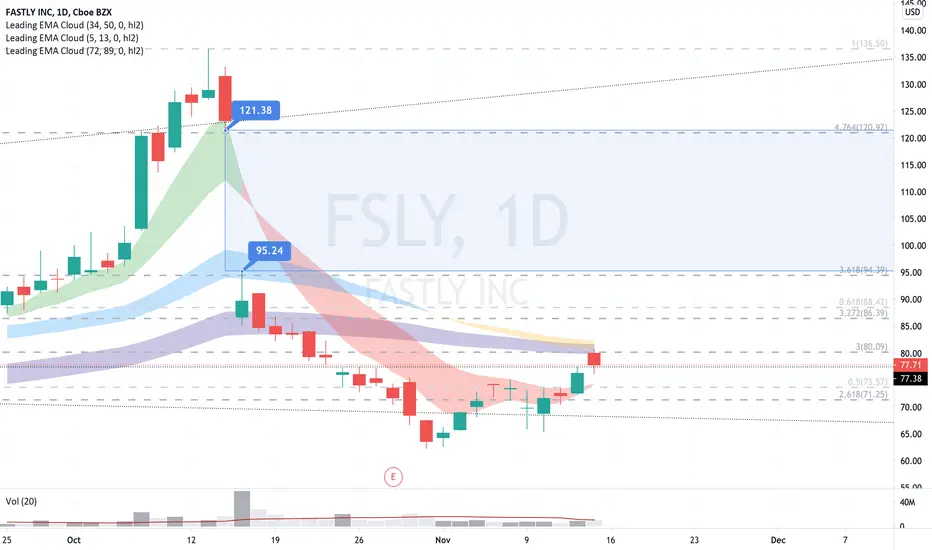
FSLY coiling up near the gap low. Volume decreasingFSLY has been consolidating at the bottom of the gap since the negative TikTok news. TikTok seems to be behind us and FSLY is ready for the gap.
If we have relative high volume, we break into the gap. If the QQQ is selling off, we may have to wait for next week.
Break out above $99.50.
Price Target 1: $123 (Bottom of the breakdown candle)
Price Target 2: $131 (top of the breakdown candle)


$CRM - GAP FILL$CRM - GAP FILL AFTER INVESTORS DAY AH, EXPECTING A STRONG MOVE ABOVE 230 TO 250 AREA

BA better play when reach 250 NYSE:BA a better place for trade is once it fills the 250s gap and closes above it. Then it has resistance at 300 (Gap# 2) and a better profit margin. In fact, it can go to gap# 3. easily. Play strategy
- Buy around 250 with SL 235. Hint: Stop loss calculation Buy Price - ATR * 1.5 .
- Take capital out around once reach 300 (gap# 2) and leave free money to run.
- Close trade once gap# 3 touch around 321.


50 SMA crosses 200 SMA #HXLIn this chart I have outlined the point in which the 50 SMA is crossing the 200 SMA (to the upside) this usually indicates an uptrend. Using that to my advantage I have also found a gap fill in the chart that could be a short term trade. I would expect some sort of consolidation at around the gap fill area and should it therefore continue past the gap fill the next resistance is also shown.
I will be keeping an eye on this to use on my spreadbet account.


VRTX Gap Fill Play - Bullish- Vertex Pharmaceuticals Incorporated engages in developing and commercializing therapies for treating cystic fibrosis.
- Target Price: $292.00 by CreditSuisse Oct 29, 2020 with multiple buy ratings by different analysts
- Recent Drop from failed study of VX-814 for patients with ALPHA-1 ANTITRYPSIN DEFICIENCY, but still one more study going in same target area and fundamentals of other revenue makers intact.
- Price entering the gap from that day's drop.
- Trends of more insider buying since the drop and stock buy backs. Signaling that the stock is undervalued.
- Bull flagging right under the gap.
Key Level: $232.41
Price Target: 269.93
ATR: $6.60
Play:
Bullish Gap Fill
Buy the Dip under the key level to scale in
Use $232.41 as inflection point.
Look for breakout with increased volume
Price Target: 270
Under $224 will invalidate


$CRM GO TO THE DOWNA lot of analysts are starting to give the company downside signals - be careful in all cases - this is just a nudge

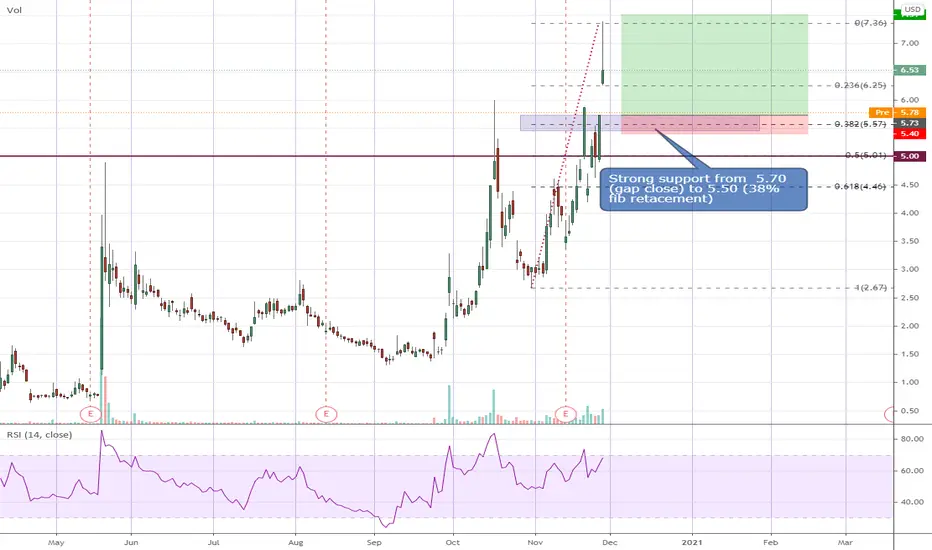
NNDM - direct offering @ $5, where is the support?NNDM was trading up to $7.36 last Friday before closing @ $6.53. Before market opens today, NNDM announced another direct offering @ $5 for a gross proceed of $60m.
The stock is expected to trade lower when market opens after this announcement and could provide a buying opportunity. I am expecting to see support between 5.70 (Gap close here) to about 5.55 (38% fib retracement level). Let's see!
Disclaimer: This is just my own analysis and opinion for discussion and is not a trade advice. Kindly do your own due diligence and trade according to your own risk tolerance. Thank you. Feel free to give me your thoughts :)
ZM Gap FillBig gap from $474 to $499. A break of $474 will send this flying up the gap and potentially thru $500.
We're going into lock down again, there's no way around it. ZM is a good hold until next summer in my opinion.
The break above the resistance on 11/27 was confirmation to me that this is good for a swing!
SHORT TERM PLAY : $500 Strike Dec 31 Exp Call
COUPLE MONTHS SWING : $550 Strike March 2021 Call
Week of 11/30 Target Price: $500
February-March Target Price: $600+, all time highs

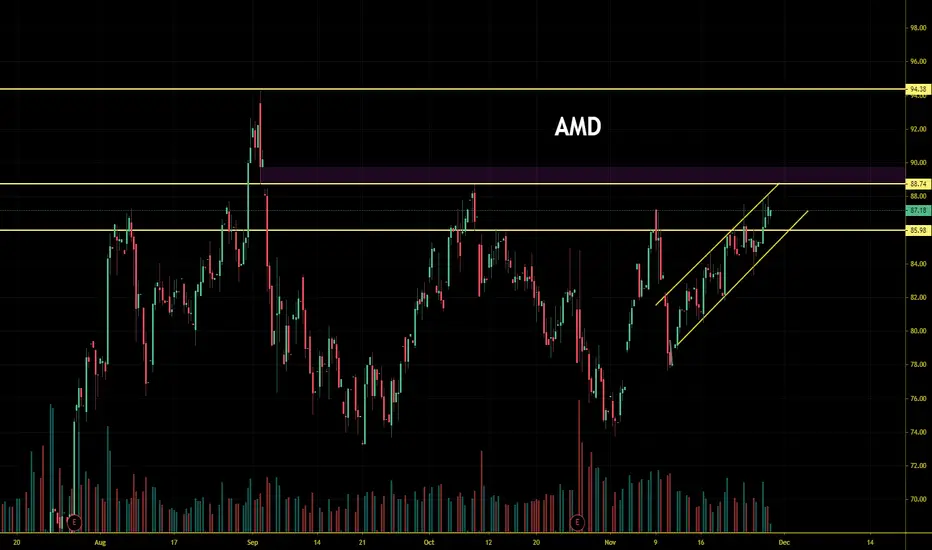
AMD Small Gap Fill, $90 Target$86 is our support. We have a small gap that still needs to be filled from $88.80 to $89.80. As long as we stay above $86, we're perfect.
Last week's high was $88.04. Once we pass that, looks to be a clear shot to $90.
PLAY : Already bought and will continue to buy more $90 strike January 2021 calls , unless $86 doesn't hold.
Sand P Nenstar Shark Harmonic RetracementChart says all. Expect pullback to 3390 to fill the gap at the 0.618. Might turn sooner, ofc.
"Bearish Nenstar harmonic, cousin to shark, cypher, bat/butterfly patterns; a Gartley variant. Typically the selloff from pattern completion at D is a .50 retracement"
Just an idea not advice; trade at your own risk, GLTA!

Going to test gap areaThere is support around 242 also but I guess bearish momentum it can take to 232-282 area where it's gone test the gap and it will revert from there. It's also nearing the oversold region and volume is shrinking too.

H&S on daily chart for possible gap fill$ALGN looks like its forming a head and shoulders on the daily chart into a possible gap fill or at the very least it should retrace to the yellow trendline i drew. GL

Imbalance Trade EURAUD 1hr Imbalance Gap
50% Fib from zone or High of the zone for Entry
1:2 R/R @ 20 pips

Based, ready to launchRight below the fib, will be watching closely for a run up and through the gap.
Basing for gap fill aboveNice recovery after a nasty plunge, could be putting in the base to form a right shoulder and fill the gap above.

analysis EUhello traders, here is an entry area prediction to the downside. As you can see that it made divergence to the left. I'm assuming that will making head and shoulders on the 1hr around 61% of the fib and then shoot down to fill in the gap below. Be careful with news and the vaccine. Thanks for reading!

Analysis Gold hello traders, you see when there is a lot of conformations in those area. There is an huge gap area on the 4 hour downward. Divergence on top of candles and IRS. Head and shoulders form. Short sell coming. All you need is 20pips a day to change your life. Catch a pieces not a whole. Thanks for reading!
