Gapfill

Oversold with gap aboveThis may bounce around in the 90's before breaking 100 to fill the gap, keep on watch.

Apple Gap Fill Apple has a gap to be filled at $99.97 and a demand line starting from around $105.00 which may represent a fantastic buy zone.
This pattern holds a high probability of a bounce off this zone if the rest of the market can hold together over the 2020 election period.
One should be on the lookout for bullish divergence on the MACD and RSI after price retreats to these levels for potential buy signals.
Interim targets should see retests of price to around .382 to .618 Fibonacci extensions.
Conservative target is $130.00 at the .786 fib extension.
Final profit taking target is $147.00 (1.272 Fibonacci extension and estimated measured move which will become more accurate once price breaks out above supply line and gives us a reference area to measure from.
Considering the beautiful Google (GOOG) gap fill bounce on Friday, this trade is looking quite promising!
Good trading everyone :D

A gap fill in all its splendour. Google Long (GOOG)Genuinely beautiful example of a gap fill on Google (GOOG)
A gap (green box) created on October 12 after the market opened higher was eventually filled, becoming a launchpad for price (red price).
Notice the price behaviour around support resistance areas marked in pink.
Fibonacci targets were 50%, .618 and .786 (green price) with the move ultimately overperforming a little.
One of the only big tech in the green on open today...

NTPC SHORTit has formed a head and shoulders pattern on 15min timeframe, rejecting the above resistance around 90, can look for shorting opportunity around its neckline which is at 87.40, or can short around level of 87 from where there is a gap stretching till 86 which can be filled out if it shows bearish signal and follows the pattern

SPX conditions similar to Feb. 19 Top !! Possible Head & Shoulders pattern on SPX daily, bullish momentum fading, setups similar to Feb. 19 Top. We're two weeks until US election, expect volatility to pick up again.

Gap fill from today open to previous day closeQuick video on playing a fade from the current New York session open to the previous day close.


$SPCE How To Best Position Yourself For Future DevelopmentsThis is a follow-up post from my previous $SPCE analysis on October 4th titled "$SPCE Love Space Travel, But You May Want To Wait Before Buying".
Technical Analysis
In my previous post, when $SPCE was priced at $20.77 before the moon towards the October 20th's Highs of $24.36, I talked about how at that point in time, $SPCE had 2 unfilled gaps at $24.02 and $16.43 respective, despite having a history of closing any of its gaps. Within that post, I also gave 2 possible scenarios that I foresaw would occur leading up to the October 22nd's window opening for Virgin Galactic's next crewed spaceflight test. If you are interested to see what exactly my previous analysis was about, you can refer to my previous post which I have linked down below in the 'Related Ideas' section.
Update 1: Since the post on October 4th, we saw $SPCE prices staying above the Symmetrical Triangle chart pattern after breaking out of it and re-testing the Slope of Lower Highs on October 13th. After rejecting the Slope of Lower Highs, it continued bulling and eventually filled 1 of the 2 unfilled gaps at $24.02 on October 20th. However, after filling the gap and reaching the Highs of $24.36, we saw an immediate rejection within the same 4H candle, creating a Shooting Star candlestick pattern. Later on during the session, we saw prices rejecting all the way down and closing at $20.44 for the day.
Update 2: What caused this huge 16% decline from the peak of $24.36? There are 2 reasons for this. The first reason is a technical one based on what I have mentioned earlier. After closing the $24.02 gap, $SPCE entered into a strong resistance zone of $24.26 to $24.85. On top of this, because of the meteoric rise, a Regular Bearish Divergence was also created. These technical factors combined created a retracement cum rejection from the strong resistance zone.
Update 3: However, based on this factor alone, it does not justify a 16% decline from the peak. This brings me to my 2nd reason which is short-seller Jim Chanos of Kynikos Associates' comment on the space sector. If you aren't aware of what happened, at an investor conference, Chanos expressed his bullishness on the space sector but later retracted his statement by saying that he was joking. This, combined with the technical factor I mentioned earlier, created a 16% decline from the peak of $24.36.
Entries, Price Targets, Stop Losses
Because of the highly speculative nature of $SPCE plays at this stage due to so many uncertainties surrounding it and so many things that can go wrong, I can't give an exact price target or stop loss at this juncture. But what I can say is that, if something does go wrong, even the most minute incident that is unfavorable for $SPCE, it is almost certain that we will see $SPCE back in the $16.43 range to close the last unfilled gap. What I can also say is that if you want to trade or invest in $SPCE - don't go all-in yet . The approach to take is to have a small enough position in $SPCE so that you feel that you have some skin in the game but not so much position such that even if $SPCE falls to the $14.00 to $16.00 range, you can still feel emotionless. Personally, I have taken this approach as well, where I have an entry at $20.91 and is mentally prepared to stay emotionless for both a meteoric crash towards $14.00 as well as a meteoric rise towards $30.00.
Disclaimer
I do not provide personal investment advice and I am not a qualified licensed investment advisor. I am an amateur investor.
All information found here, including any ideas, opinions, views, predictions, forecasts, commentaries, suggestions, or stock picks, expressed or implied herein, are for informational, entertainment, or educational purposes only and should not be construed as personal investment advice. While the information provided is believed to be accurate, it may include errors or inaccuracies.
I will not and cannot be held liable for any actions you take as a result of anything you read here.
Conduct your own due diligence, or consult a licensed financial advisor or broker before making any and all investment decisions. Any investments, trades, speculations, or decisions made on the basis of any information found on this site, expressed or implied herein, are committed at your own risk, financial or otherwise.
If this post has helped you out in making your investment/trading decision, give it a huge thumbs up, and follow for more updates regarding this ticker symbol!

GAPS, GAPs, GAPsMr Market likes to fill open gaps. It will do so whenever possible. We have had very good examples of these in recent days.
IMO, we are still on a bullish footing at this stage. I have highlighted the green box. You will note today, prices gapped below the green box and finished back within. That green box is the true range of the last (significant) bull bar. Breaks up or down out of the green box usually will signal a continued move in the direction of the break.
There is potential downside here as there are lower gaps we have not closed around the support level. If we continue to hold the green square, bias would be for continued upside.
My trading stories: dailyxing.medium.com

CME GapA CME gap seen on CME chart, so more likely to move toward $11100 support range and fill the gap.

ADANIPORTS SHORTadaniports is failing to sustain above resistance level of 362 and is taking support on ascending trendline, which if broken, there can be shorting opportunity in tomorrows session around 359 for target of 356 and even it can fall down further to fill up the gap

$SPCE Love Space Travel, But You May Want To Wait Before BuyingTechnical Analysis
Currently, $SPCE is respecting a Symmetrical Triangle chart pattern, where neither the buyers nor the sellers are pushing the price far enough to form a clear trend. As of 4/10/2020, the price closed at $20.77, at the slope of lower highs. Even though I believe that $SPCE has explosive long-term growth potential, assuming that the company is able to reach the stage where they are able to successfully follow their timeline and fly Sir Richard Branson to space , based on the technical factors and risk-reward ratio, I strongly advise against entries at the current price point until further confirmation signals.
The reason that $SPCE was able to soar to the $20 mark in such a short period of time from the recent $16 range is due to a gap up driven by BofA Securities upgrading $SPCE to "buy" with a price target of $35.00. However, as you can see from my chart, historically, gaps are almost always filled - rather quickly in fact. There are 2 exceptions where gaps are not filled yet, namely the 3/8/2020 gap down from $24.02 to $21.75 and the 25/9/2020 gap up from $16.43 to $18.29. With the bearish market outlook currently due to POTUS contracting COVID-19 acting as a catalyst and the Symmetrical Triangle acting as a resistance to push the price down, the likelihood that we will revisit $16.43 to close the gap is very plausible. Furthermore, fundamentally, there has been no change to the company yet - at least until 22/10/2020 . Thus, with the price being purely driven by BofA, the $20.00 price may not be sustainable in the short-term.
Entries, Price Targets, Stop Losses
The best price for entry would either be at the $16.43 range or if the price breaks above the Symmetrical Triangle, retrace back to the slope of lower lows or the $21.00 to $21.58 Support and Resistance Zone, and holds above it.
For my price target prior to 22/10/2020, depending on whether you are bullish or bearish on $SPCE short-term, it will either be $24.02 or $16.43. Since I am bearish short-term but bullish long-term, I am leaning more towards $16.43 prior to 22/10/2020. As for my price target beyond 22/10/2020, it will depend on whether the suborbital test flight is successful. I will do an update of this post in the future once $SPCE announces the result.
As for my stop-losses, bulls stop-loss will be at $16.43 while bears stop-loss will be at $24.02. As you can see, if you were to enter into a new position at the current price-point, bulls have an upside gain of $3.25 per share with a downside risk of $4.34 while it is vice-versa for the bears. Thus, the risk-reward is really not that worth it. Even if you are a long-term investor, $SPCE is still at a highly speculative stage. The best-case scenario in the event of a test-flight delay or crash is a plunge towards $16.43. Although if everything goes as planned, $20.77 would look like a steal for you in the future. But if you have the conviction, go for it. It is a really high risk, high reward play for investors, and it will take conviction to stay in the trade.
Disclaimer
I do not provide personal investment advice and I am not a qualified licensed investment advisor. I am an amateur investor.
All information found here, including any ideas, opinions, views, predictions, forecasts, commentaries, suggestions, or stock picks, expressed or implied herein, are for informational, entertainment, or educational purposes only and should not be construed as personal investment advice. While the information provided is believed to be accurate, it may include errors or inaccuracies.
I will not and cannot be held liable for any actions you take as a result of anything you read here.
Conduct your own due diligence, or consult a licensed financial advisor or broker before making any and all investment decisions. Any investments, trades, speculations, or decisions made on the basis of any information found on this site, expressed or implied herein, are committed at your own risk, financial or otherwise.
If this post has helped you out in making your investment/trading decision, give it a huge thumbs up, and follow for more updates regarding this ticker symbol!

can M fill the gap? 5.75 ---> 7.00Today was a green day on M and ill take it. up a solid +%0.04
in @ around 5.72 avg cost.
hoping M will Fill this nice gap upward to about 6 dollars Plus where ill start taking profit hopefully, keeping some to see if she can boost to 7 and beyond.
Looked at the Graphs for fun today she currently sitting at the previous levels of support/resistance which for me is nice entry/gamble Opportunity! If she falls, it is what it is.. I will be thinking about cutting me losses if she starts dropping below Instead of Breaking out.. I want the stock to breakout , not Drop!
Goodluck everyone @ peace.

SPX Breakout to PullbackDivergent RSI on latest pushup; gap to fill at 3305, move might terminate in 3450 area of former consolidation.
Not trading advice; just an idea, trade at your own risk; GLTA!

Gap Filling Below ? BTC/USD #cmegap #bitcoin $BTC #cryptoWe see here Bitcoin is sitting at a level where it must soon make a decision. Up or down ? But remember we have a CME Gap below us near
9670 . It is thought these usually fill sooner rather than later before a continuation upwards - and I expect a continuation upwards maybe by Halloween . I will link my 2 ideas previous on this subject below . So I believe we will see a slight breakdown in the next few days probably to 96xx level where that red Bullseye is on my chart above , though it can always spike a bit lower . I'm still bullish for upside after that . But we may gap fill first to 96xx .

Get 2 WORK , we have some missions 4 u:)Tasks :
u need to get above 200 DMA
u need to close the gap
u need to get more expensive/
GOOD LUCK

SLV GapsAMEX:SLV As SLV works it way through its levels the best support and resistance could be a Fibonacci. It is important to note that throughout the summer as SLV had approached these levels leading up to the swing high it gapped up above all the levels except .382. I'm unsure why it has seen so many large jumps in price but it could be forming a double bottom at 20.51 and move back up next week to chase fills on some of these untouched areas.

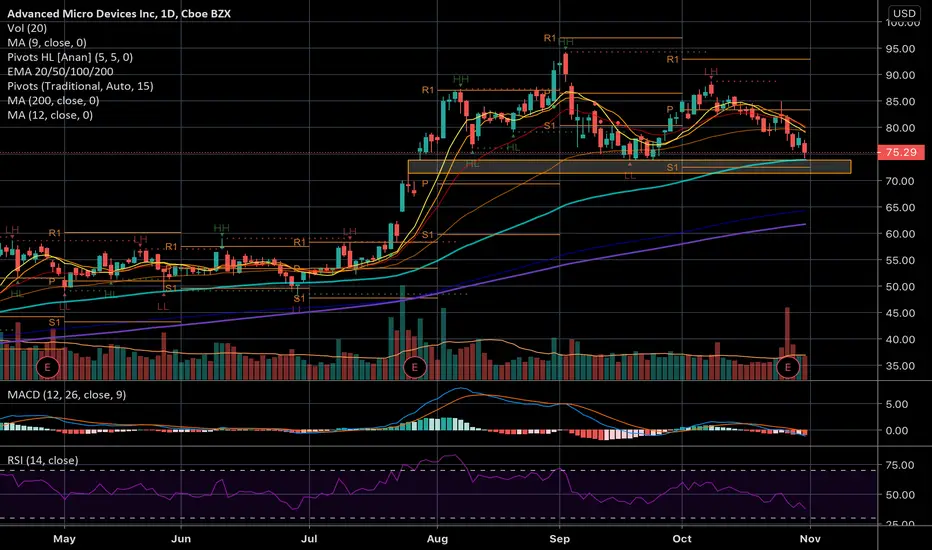
Large gap to fill above, unusual options activityCame up on the unusual options activity scanner and its easy to see why. From the long upper shadow of the candle you can see it tried to move thru the gap but likely followed the market and retreated. Given enough time, over a few sessions and some upward momentum in the market, this may fill to the upside.
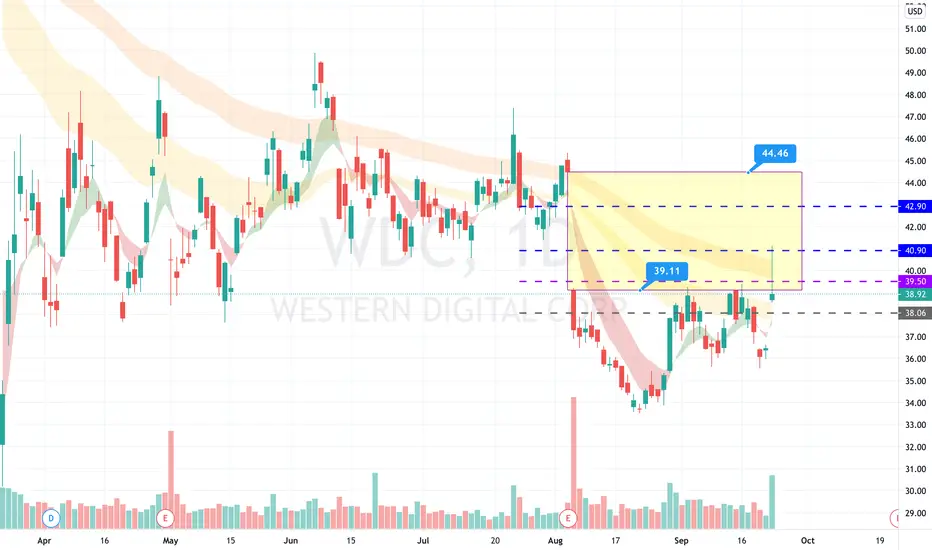
Bullish reversal with a gap to fill aboveUpdated from the earlier idea with adjusted fibs. Where the extension from March to recent monthly highs aligned, I used that fib as marked entry.
Solid uptrend established
Still oversold on the daily
Entry near the fib especially after a successful backtest as support would be a solid entry.
First gap comes from a large space in which there was no candle closures since the gap down; this may not be a technical gap down but may have an impact on price action. The true gap is small and marked within. Either way, this should make a nice move upward through that space.


