BTC1!: Bitcoin is going to close 10% CME GAP?As you may recall after the terrible fall from 8000 we left behind 10% CME gap.
it seems we can close it in the coming days. Not long from this level ofc.
Hit the "LIKE" button and follow to support, thank you.
Information is just for educational purposes, never financial advice. Always do your own research.
Gapfill

SPX - Just closed a GAP.* Remember to support with LIKE and FOLLOW me for more analysis *
SPX today’s candle is a little annoying, yes, but we shouldn’t expect that the market can always go up, without taking a rest. The price respected the 2858 support zone (light blue line) and closed a gap.
If we look at the hourly chart, we may see this move as a correction after a pivot breakout, which is a natural and healthy move for SPX.
Now, there’s not much to do. Like Charles Dow would say, the trend will continue, until it got reversed. In the lack of any bearish sign, we can understand any drop in the prices as a pullback.
* LIKE this idea and FOLLOW me, because:
- Here, you will see clean charts;
- Daily analysis;
- Trades with clear risk management;
- The best of Dow Theory, Price Action and Candlestick psychology;
- Chart patterns with statistics. *
* My name is Nathan, I'm a trader and portfolio manager and I'm here to LEARN. Leave your COMMENT and FOLLOW me to keep in touch. *

OMP - HUGE Gap up?Have to wait and see on this one, but pretty clear where it should go. Have to see if it can hold and what the earnings are :)

OAS - short sellplease show support by liking this.
I am not a financial advisor and i do not advise taking any of my trades that i post, because of the risk.
The analysis is purely for entertainment and idea what could happen with this stock.
if you have any questions feel free to ask.
+BlackStock


AAPL - Will the trend continue?We see that AAPL is now above the 21 ema, above an upward trendline, and if it closes today above the U$ 271.70 will be a very good sign.
If AAPL loses this upward purple trendline, the price will ramble for a while. Meanwhile, the trend will continue. There next challenge will be breakout the U$ 288.25 price region, then it’s easy to imagine the prices going up to U$ 304 or closing the gap.


Textbook Gap fill. Target of $316. RSI bullish trend lineDouble bounce off Fib .786 combined with RSI trend line bounce. All point to a textbook cycle completion to 316... As crazy as it is, this market wants to go higher before it goes lower so there is some gas left in the tank.

Triangle Breakout in CADILAHC and may fill previous gapsif it breaks 333 level it can fall upto 308 levels, it may fill gap. moreover we can see lengthy falling candles with high volumes, indicating further downfall.

AUDJPY - GAP YET TO BE FILLED - 161% FIB Extension targetGood morning traders,
Fairly simple trade set up here.
AUDJPY still has a gap yet to be filled.
The 161.8% FIB extension level could provide a target, this is also inline with the gap which needs filling.
Any thought or comments let me know!

ABBV to Long, from 67 to 81ABBV to Long, from 67 to 81
Existing Condition:
1. 08/16/2019 Weekly demand zone confirmed
2. in 60 min, down trendline break by breakaway Gap (G1)
3. Re-test the Gap, Gap filled.
Entry below 67
Stop: 62.5
Target1: 81; Risk:reward=1:3
Target2: 88; Risk:reward=1:4
If G2 (runway Gap up) breaks the 2nd down trend line. That is a measuring (40-50%) of the trend.
That is another entry point.
This is a trading school homework. I need 6 months to practice trading plan.
If you like it, thank you for your support. Please use SIM/Demo account to try it, until my trading plans get high winning rate.
In my real trade, I use options. I bought Jun 80 Call, limit 1.46.
If stop: lose about 1.00.
Sum of my ideas:
5 active, 4 winner, 1 loser, 0 pending for condition;
4 analysis only, 8 cancelled;

CADCFH Hope to see GAP FilledCADCHF imo should fill the gap and continue its ride up :)
Trade at your own risk. THis is just my idea and my view


BTCUSD: 10% CME GapCME opens with ~10% gap. Last 4 gaps were filled within a day or a week.
Information is just for educational purposes, never financial advice. Always do your own research.


Monday Gap Volume Define Bear or Bull mode For Better Forecast
waiting and Drink Tea Cup and watching TV News about Corona Virus Is best Jobs
when Market is Start .i try to make better Idea

Gap LawWhenever there is a gap down in the futures, by law they fill fairly quickly compared to the cash market. I will document any instances that took 10 or more trading days.

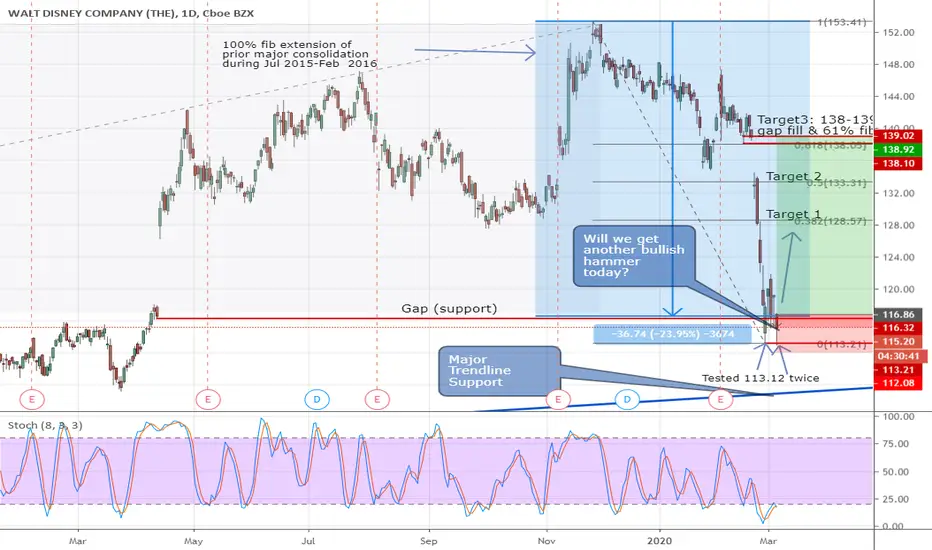
DIS - Bullish hammer today?DIS is looking ripe for some swing up. The recent plunge is of a similar magnitude (just a little more than 100% fib extension) of a major prior consolidation that happened between July 2015 - Feb 2016.
The gap was filled at 116.40 on Monday and although it went lower to 113.20, it recovered to close above. At 113.20 (it's lowest point in this plunge), it was just $5 shy of a major trendline support.
Today it retested Monday's low at 113.20 again attempted to bounce from there. I would be interested to go Long if it could close above 116 (thus forming a bullish hammer for today). With a Stop just below 13.0 and looking to scale out as it reaches each target up.
DBX - Gap closed and resumption of trendDBX retraced to close gap at 18.70 which is also a horizontal support level. The overal trend is still bullish after having formed a prior base. Got long on it at 19.67 with initial stop just slightly below 18.70 support. Looking to take partial profits around 21.20-21.80 but is expecting the long term uptrend to continue way higher eventually (trail the stops up).

BEAR MARKET RALLY! GAPS WILL BE FILLED!BEAR MARKETS SLIDE DOWN A SLOPE OF HOPE!
RETAIL INVESTORS PILLING IN! 401Ks PRAYING FOR A BOUNCE!
GAPS AT 17994.6 AND 28402.9!

$TSLA $TSLAQ - 1 gap up but 3 gaps downUpdate from my previous idea posted as there is a 3rd gap down from 10-13/01/2020 between 478 & 492$ which is still recent and close enough from my macro 0.618 fib (180-923) to be considered.
I disregard any gap below 5$ or previous to 2020 up trend.
Again I don't know what I am doing there...

TSLA: 1 gap up at 740$ or 2 gaps down at 590$ & 510$Following the article www.investopedia.com it would make sense for the stock to keep going lower and close the 2 recent gaps:
- 29-30/01/2020: 590-618$
- 17-21/01/2020: 510.50-518.5$
Or it could keep going on the rebound from closing/afterhours today and go close the gap between 739 & 776$.
As always, I don't know what I am doing there...
