Gapfill

SELL...SELLI realize this is the hottest thing right now, and seeing it drop from whence it came seems out of the realm of possibilities.
But it follows a pattern that happens over and over: Parabolic move/Gap. Bounce into FOMO buyers resitance, then fade.
Wait for bounce into resistance then look for short positions.

Uber Short Term BullishEntered a options call on Monday (expires Friday – high risk) since most of my indicators point short term bullish and we have 2 gaps that will probably get filled before tanking again to even lower lows. Anyone agree? As long as price maintains above $28, I will be in profit for my options call.

TESLA Class A Bearish DivergenceGood evening ladies and gentlemen, Tesla has gapped up and is currently sitting at critical resistance with Strong Class A bearish Divergence. I believe this is a small range where one would take a short in. I have my stop placed slightly above it. But in order to maintain a safe 1:3 risk/reward ratio, I am aiming for the 50% and 61.8% as my exit targets which also happens to coincide perfectly with a gap to be filled at the 50% retrace.
Join our Free Telegram Channel: t.me
We are a new community growing day by day in hopes to accomplish a trading premium group by December 1st of 2019.
Subscription options are $15 a week, $50 a month or $500 a year. These are extremely cheap options compared to most other premium groups! We give the best possible technical analysis with a touch of art work to it hence the name "ChArtWorks" ;). "We remove the hard work from your end and just give you the trade set ups."
50% off all Contracts for Military Veterans and Active Duty Service Members, just provide your DD214 or Military ID for proof of Status. Discharge Type is completely confidential and does not need to be shared. I am a Marine Vet myself and I will not share any information regarding Military status with anyone else.

GBPUSD SELL 15MIN - RISHILADWA @TRADERS PORTALMarket gap has formed, a lot of liquidity has also been stopped out. can expect a plummet to fill the gap.

APN - Possible gap close coming upTraders don't like gaps in the price and there has been a large gap in JSE:APN since March this year.
The price ha finally reached the top of the candle that caused the gap, and if it confirms a break above the spike, I wouldn't be surprised if it goes all the way up and closes the gap. Let's wait and see what happens.

Rally built on gaps! - Expect a drop to 100% FIB levelGood morning traders,
The rally in all US indices has been built on gaps. Check the Dow Jones, NASDAQ and also the SP500.
There are numerous gaps which need to be filled.
There is no gap which has not been filled in the history of the stock market (apart from the present ones).
The SP500 has now reached the FIB 127% extension.
Expect some negative press regarding the trade war next week.
Bearish divergence on the RSI
Please let us know your thoughts!
www.forexstoreau.com

In For A Big Move SomewhereAs my previous posts may have shown, i'm not really a huge fan of this rally. We truly do live in the twilight zone right now and TA is being washed out by many different factors including news, QE that's not QE, rate cuts, tweets, hopium, etc.
Technically we've been on this $23 rally on declining average volume, on massive RSI bearish divergences on every TF including the monthly, and up straight out of a half completed descending triangle. Now there's nothing stating this can't keep pumping from here but it seems like the China happy talk crack pipe got a little too hot the past couple days and we've stalled out. We've left multiple gaps down below, and that mixed with the low volume we had on the way up we could see this proverbial house of cards get blown down with a pretty small gust of wind. It seems like the futures traders are the ones who have been sending us higher and it seems like they've wanted to turn this over the past day or two.
With the Bollinger Bands on the hourly tightening, which generally precedes a move in either direction, the market has been working off it's 'overboughtness' the past couple days. we could definitely just be bull flagging, but those gaps are like a nagging itch in the back of the markets head that needs to be scratched. Keep that in mind.
Be wary and goodluck.

8.8k gap filled! Resume moon?CME Futures gap just got filled without the price dumping nearly as bad on the other exchanges to fill it....now onward to fill the gap around 11.2-11.8 i think it was!

Bitcoin Futures - Watch for Gap Fill - $8800Quick update:
Watch for Bitcoin (or even just the futures to fill this gap), as you can see prior gaps were ALL eventually filled, i expect the same here.
A move to fill this gap would also coincide with my prior call for a brief retracement, and would also present with a re-entry point for those who have yet to gain exposure.

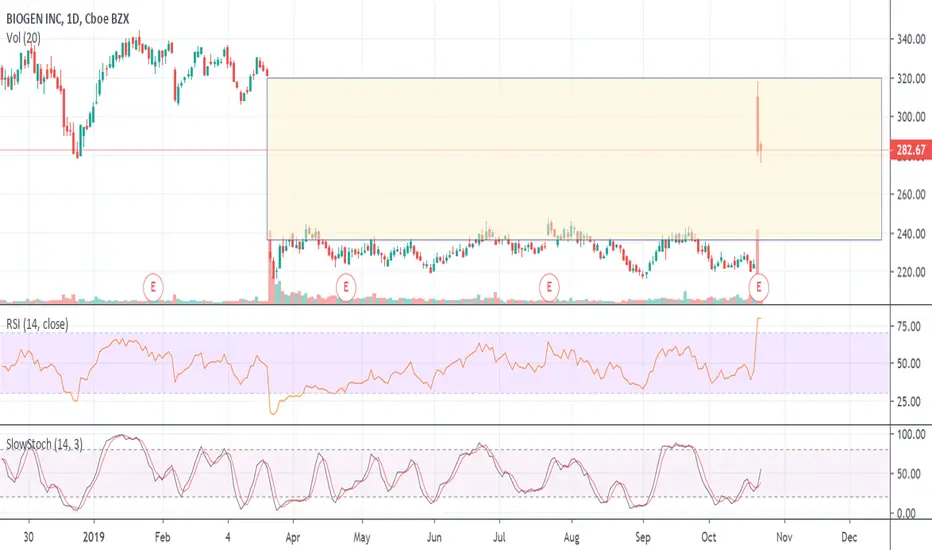
BIIB - Can it hold the line?Massive gap down on March 21 & stock spent the last seven months consolidating before the massive gap up yesterday on positive drug news. Can the stock hold this gap up? I want to see it continue to close above $280 as it consolidates at this new level, then you can get another move up...assuming no bad news comes out about that Alzheimer's drug. If the price pulls back then the $240s may be back in play.
[insert $oxy pun]11/08/19 47 C 100 basis .32$.
11/15/19 51 C 100 basis .18$.
Plotted out every gap fill with ranges and levels.
May the best bettor win.

exchange the exchanges : exchangeception $amtdinterestingly, now I am looking at multiple exchange stocks.
Very clean chart and massive gap to be filled, in position, stop 37.51.

$schw the floor w/ emvery clean chart, the rays at the local high are daily gaps, taking this on spot and may open options positions.
stop at 39.71.

SPX OVernight Top in Place? Lower before Higher; Correction Inc!Chart says all. Been shorting too soon as usual, but the 7-wave Triple combo is a rare and confusing pattern.
Overnight ES futurez tapped the intersection of long-term TL and near-term TL in this wedge; they converged at 3056.
China says they were just kidding and wont get serious with the Great Donald, such a big surprise!
Expect to fill the gaps from past weeks, get support around 295 on SPY and bulls may try again for the 9th wave.
A real Bearish Correction can start anytime; but seasonally Feb-March would be a likely scenario with trade and election worries looming.
On Wednesday 60% of trading was selling, only 40% buying to reach new ATH; RUT and DJT diverged, Transports just got killed; these are leading indicators.
Broader market is not in step with the indexes, which advance on progressively smaller volume and fewer issues with each successive bull wave.
VIX is sub-13 again and in a compressing wedge, expect a big pop in volatility very soon! Play the VIX with UVXY calls if you dare!
This is an idea and does not in any way constitute investment advice- trade at your own risk! GLTA!

LSE:UFO ¬ Mt.BFX | Pickers Pluck ¬ Inverted ChartAll the info is on the chart, it was made inverted so any layout issues are probably because of that, 'alt + i' or right click the y axis and invert chart.
TP 1 - 0.48
TP 2 - 1
TP 3 - 2
TP 4 - 7.75
TP 5 - 20
TA
Powers of Two
Fibonacci
Gap Theory
Eliiot Wave
Trend Lines
Alien Metals (UFO) is a speculative risk investment, this is not investment advice. DYOR before investing.

double bottom in play if symmetrical triangle doesn't pan outthe symmetrical triangle/ bull pennant appears to be losing some steam here but if it doesn't pan out the bulls still have another chance to continue the uptrend with a double bottom in play around 8886(as shown here in purple). A retest of this zone would make a lot of sense since there is currently a gap on the CME futures chart around that zone that needs to be filled...and if price action were to retest this zone soon enough and indeed get strong bounce support there we could trigger the double bottom while still validating both the symmetrical bull pennant and the 1 day chart bull flag (in green) at the same time. We can see a nice bullish confluence here between the breakout targets of both the double bottom & the symmetrical triangle (pennant not factored in) so hopefully that increases the probability for a bullish validation.

INTC - Pulling back after filling gapAn update from my previous INTC post on October 24th. The price has continued moving higher since the positive earnings announcement but the price seems to have been rejected right at gap resistance. Just have to wait and see where the stock can find support. I'm looking around $54.80 which is the 100% Fibonacci Extension level.

Looks like the CME futures gap is about to fill soon!Looks like the CME futures gap is about to fill soon, 8800-8900 could be a nice entry for a long position!

Moon Cancelled? 4 H EMA Golden cross is not getting any love :((Whazuup my people, hope you are having a terrific trading day and had a phenomenal weekend as well.
I think we are primed to have a nice 1000 USD correction within a very short time. 8.5 target lies on FIB 0.5 which is universally beloved retracement level for BTC and IMHO we will at least test this area today or latest tomorrow. Trend reversal theory will be confirmed or disproved based on the price action that we encounter back at 8.5K level. Current price action looks bullish, yet BTC has a habit of closing all the fast gains in a relatively prolonged downturn. Key pivots for me are at 10.3( closing and maintaining daily over there will be a confirmed trend reversal), the medium term-bullish scenario will be if we retest 8.5K and swiftly reverse to the upside.
Have a profitable day my friends and don't get rekd :))
Summary Answers:
1. Moon is not cancelled, going down to 8.5k level will test the bullish resolve of the current price action. If we start consolidating at levels 8.5 or blow I'd expect a further sliding continuation of a downtrend.
2. Why 4H golden cross did not get any love? - 1. It is too far away from the price action 2. Bulls are currently exhausted and do not have much power to push the price further. In fact, they are so exhausted that we have closed down an all the gains that preceded to the golden cross.

ZS - Scaling InZS had a gap up due to earnings back on March 1st. The stock saw a rise in price within a bullish price channel but was creating a bearish divergence with the RSI indicator. Even with the pullback, the price remained in the bullish channel until it broke down in mid-August.
Another earnings report in September led to a gap down that created an Island Reversal pattern & carried the stock price below the March gap, which was now acting as resistance.
The stock price continued falling as it tested that March gap resistance a few times but as the price fell the RSI has moved higher creating a Bullish Divergence.
With the price moving out of an oversold condition I am looking for the price to move up to re-test the September gap resistance. Depending on bullish momentum the stock may be able to continue rising to fill the September gap.

DRI - Let's Go Out For A BiteDRI had a gap up on an earnings announcement back on March 21st. The top of this gap became support while the stock price continued to rise. This rise in price created a bearish divergence with the RSI indicator.
The earnings release in September led to a gap down. The price actually consolidated just below the March gap. Friday's trading has the price testing the resistance level of the March gap zone with the stock finding strength.
DRI is finding relative strength within the Restaurant industry but still needs some more time to see if it is gaining strength on the SPX. If the price continues to rise I would expect a re-test of the bottom of the gap down zone around $122.

Long when 7150 gap is filled!!In my opinion the 7150 must first be filled before we getting a BULL market.
