Biogen looking for gap fill breakoutBIIB is up this morning on an extremely strong earnings beat and a guidance upgrade. BIIB has an upside gap to fill, with some clearance on the volume profile. That should make it fairly easy for BIIB to keep moving upward to 280 once it breaks decisively above 245.35 resistance.
Gapfill

BTC safely above double top neckline..may go fill gap at 11.2k. We can see price action has broken back above the yellow horizontal double top neckline keeping us safe from a dreaded double top breakdown for now. We are also once again back above the top trendline of the falling wedge which previously had a fakeout breakout but this time around could very likely reach its breakout target(which from this spot on the wedge is around 11.1k) I think if this does occur, FOMO will give us the ability to then take price action up another pip or 2 to fill the CME gap at 11.2 either that or cme could trade at a slight premium around there and fill the gap without btc reaching 11.2 itself. Either way if we breakout here I think the 11.2 cme gap is likely to get filled and then the impending 4hr death cross will have very good odds of sending price action back down to those 8.5 / 7.2k gap levels. I think absolute worse case scenario here is 6k before the ned of the correction but I could see us skyrocketing back up after only reaching 8.6-8.5k. Also price action doesn't have to hit 8.5k to fill the gap if suddenly the CME contract were to start trading at a discount. For now I'm going temporarily long until the 4hr death cross...then neutral until I see whether the deahcross will be sustained, or just a fakeout.

CME BTCUSD Gapfill - Short swing setupBTCUSD setup for a swing to around 10k (or lower depending on the price action)
Two things I'm looking at:
- Weekly Pivot Point is coming in at around 12k on spot and 12.4k on CME's
- Gap fill at 12060
Looking to take profit at the H4 200EMA, currently 9800 on spot.
Will stop out of this trade if CME's closes a H4 candle above the weekly pivot point (12.2k- 12.4k)
Disclaimer:
I'm not a financial advisor. Don't take this as financial advice.

1day chart pattern beginning to take shape: Falling Wedge?We have finally reached a 31% correction here when we dipped into the upper 9k region...odds are good the 1hr/4hr chart h&s pattern is really a decoy at this point as a 1 day chart falling wedge is starting to take shape more and more as the candles progress and is starting to seem more valid. We have also filled the highest gap on the cme futures contracts on the last correction leaving only the gap at 8.5k left to be filled. There is a slight chance this gap won't be filled but we could also easily throw a daily candle bottom wick down to it briefly and then slingshot back up and still manage to keep the daily candle bodies above the bottom trendline of the 1day wedge. I'll be keeping a close eye on the 4hr and 6hr charts to see if we have a turn back to the downside on them before forming a higher high on those time frames...if we do form a lower high on the 4&6 hr charts then odds of dipping down to fill that gap are still very good however if we form a higher high on either of those 2 time frames probability will then favor that are big correction may be complete and the bullrun is likely to resume. Still no guarantee that this falling wedge is the main pattern here on this move but as of now it is the frontrunner.


Bitcoin's - Independence Day!Just a quick observation. It may be possible for the correction to end sooner than expected. Another perfect opportunity is on July 5th right after the July 4th Holiday to not only fill the CME Gap but also bounce off another closely watched trendline.
See target area.
So, to upgrade my weekly update it is very possible for this correction to finish as soon as the end of next week or drag out for a couple weeks as previously stated. It really just depends on how ambitious the market decides to get.
Take away? Be ready for anything in the $8,000-$8,500 range. I firmly believe any longs picked up in that area will be well rewarded later this year. If we go down there, those will be prices we probably NEVER see again. EVER
Good Luck
BBS out!

Do not trust the move: SHORT
Classic bounce into resistance (bag holders) after half-way point bounce.
Of course it could break through, and create a massive squeeze, but we are talking a shit ton of volume would have to come in to overwhelm.
Short all the way to gap-fill

$SNCR Synchronoss Technologies Has Room To Run and Gaps To Fill$SNCR has been one of the most beaten down names in the tech sector. The stock once traded as high as $52.50 a share before starting its long descent.
Now, things look to be turning for the company and its stock. Roth Capital analyst Richard Baldry initiated coverage on the cloud-based enterprise computing and messaging specialist with a buy rating and a $13 price target.
This follows the company's investor day where participants liked what they heard in terms of $SNCR longer-term growth, sales, and capital-allocation strategies.
With all the gaps needed to be filled overhead and the depressed nature of the stock, we believe $SNCR can make a serious run higher. Shares are now trading above their 20, 50 and 200-day moving averages. It would not surprise us to see a quick move to the $10 to $12 region.
As always, trade with caution and use protective stops.
Good luck to all!

$XON Intrexon Corp Climbing Up The Charts$XON has been making a nice run up the charts lately. We don't think this run is over by far as there looks to be a lot of momentum behind $XON.
There's also a gap higher that needs to be closed from $12.77 to $12.96
The stock is getting a boost today after announcing an exclusive wellness agreement with Surterra Wellness.
The companies will join forces to advance Surterra's cannabinoid production at a reliable, efficient, cost-effective, industrial scale utilizing Intrexon's proprietary yeast fermentation platform. The $100 million deal, including milestones and royalties, will leverage each company's expertise to ultimately bring new cannabis products to market to meet growing, and more selective, future consumer demand, with greater supply chain security, in a more consistent, efficient and cost effective way.
As always, trade with caution and use protective stops.
Good luck to all!

BTC - there's a gap to fillKRAKEN:XBTUSD
Take a look at the gap that has developed on the futures chart. There's a strong possibility that this gap will be filled before BTC continues it's trip to the moon. I'm currently in a short position, targeting $8500 ish. Let's see if the gap fills!

BTC Would like to see if we fill this gap down to around the 8k mark and then would look for a bounce and continuation to a new year high.

BTC Futures Gap FilledFutures traders filled the gap down to $8,230, watching to see if that level holds as support now.


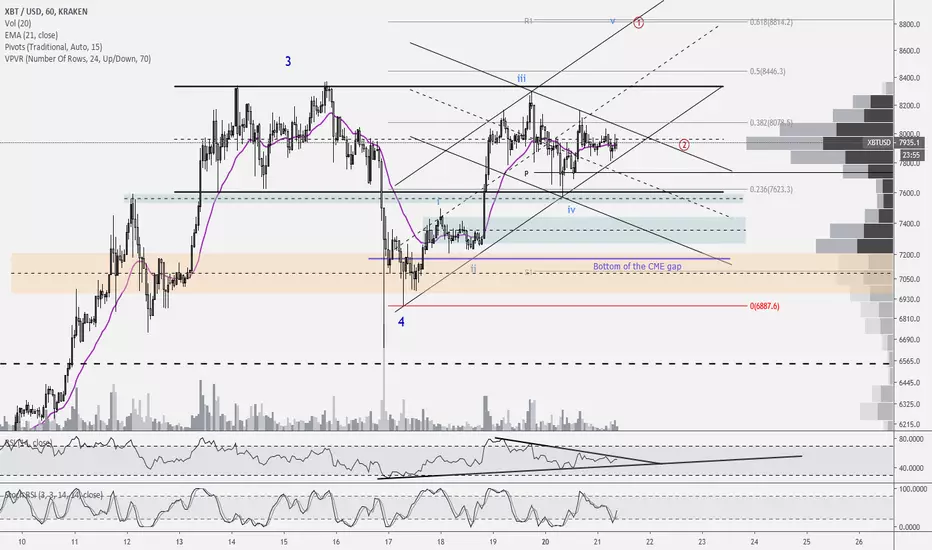
BTCUSD 1H chart (5/21/2019)Good morning traders. Yesterday's chart has been hidden by Tradingview because I inadvertently mentioned other social media sites that I am on. So we will be using the same chart today. Overall, price remains in the TR it began printing on May 13th. Price's current location appears to be printing a diamond. Often diamond tops result in reversals, but not always. Whichever direction price moves, traders can usually expect that the ascending resistance, or descending support, lines will keep price in check.
If it does break down through support, then traders should watch for a possible pullback at the demand zone/bottom of the TR around $7600. Price continuing through that area sets up the possibility of price filling the CME gap fully. However, this does not mean that price is headed to $5000. On the contrary, my expectation would be for price to bounce off the S1 pivot and head back up while continuing to print an ascending triangle. If price drops into the lower demand zone around $7400, this would invalidate my light blue wave count but would still keep the dark blue wave 4 intact. If price breaks up, then I would expect it to be a short-liquidating push up and target the R1 pivot. Can price head higher in this scenario? Sure it can, especially because I expect that a lot of people are short in this area. With that in mind, although we usually expect price to be kept in check by the resistance line, it is possible that price could surge through that ascending channel's resistance.
For now, the 1H RSI is neutral with support and resistance lines noted. A close below support or above resistance on the 1H TF should indicate that price will continue in that direction. The 21 EMA and HVN are supporting currently supporting price. Stoch RSI just bounce out of oversold which means it has room to drop just a bit. The 4H RSI remains slightly bullish, but is sitting on its support. Stoch RSI on that TF is just now dipping into oversold. Daily RSI is bullish at 67 and the Stoch RSI is just now attempting to bounce out of oversold. With all of this in mind, I wouldn't be surprised to see price break to the downside, but I do believe that it would be limited in duration due to Stoch RSI being so close to bottoming out on all those TFs and RSI being neutral to bullish. Daily R3 pivot is at $7520. The orange zone indicates the daily demand zone which, again, I expect to ultimately support price on any attempted drop.
While it does appear that we could be seeing a double top possibly forming over the past week, I'm hesitant right now to see the follow through since the various exchanges have significant differences in their May 16th swing low. The double top would not be confirmed until price closes below that swing low, so it would confirm on Binance first and Bitstamp last, with almost $1000 difference in pricing. More importantly, the target of the double top is the height of the swing high to swing low subtracted from the swing low. So not only would Bitstamp have to wait almost $1000 more to just confirm the double top, but then it would also have a $1000 lower target. Binance would be hitting its double top target just around the time Bitstamp confirms its own double top. The price target variance is just too large for me to give much consideration to a possible double top pattern at this time.
Remember, Wave 2 was 1.5 months in duration and I have been saying since then that I expected Wave 4 to be at least 2 weeks long, but potentially up to 4 weeks. We are just over a week into Wave 4 at this time. While a sudden thrust through the resistance found at the $8000-$8300 level would have price exiting Wave 4 earlier than expected, with the volatility we have seen, I wouldn't be overly surprised. With all this being said, I remain long from ~$6830.
Every day, we have a choice to act positively or negatively, so if you get a chance, do something decent for someone today which could be as simple as sharing a nice word with them. You just might change their day, or even their life.
Remember, you can always click on the "share" button in the lower right hand of the screen, under the chart, and then click on "Make it mine" from the popup menu in order to get a live version of the chart that you can explore on your own.


BTC Futures GapThe CME Bitcoin futures chart will be showing a large gap in price when trading resumes. Gaps like to be filled so expect a potential backtest to $6,290.

Filling the gapThe market couldn't wait for this moment. Now it can go deeper happy.
This one was a healty move, but I don't see any support before 2800's level. Waiting for a CLEAR reverse before entering again.


USDCAD shortFirst of many posts :)
Enjoy! Always open for productive comments and discussions!
USDCAD short:
1) Big resistance 1.3500 level
2) Retest of broken trendline
3) Gap needs to be filled
Long term target 1.3250
Cheers,
Cubefox

ETH Liquid Index - Nasdaq FuturesAre people trading this like people are trading stock gaps?
Seems interesting, and weakens my short term bullish bias on Ethereum.
I've successfully traded the BTC gaps time and time again, but the ETH chart is much newer.
Looking for a friend..

BTCUSD 4H chart (CME 4H chart also) 4/29/2019Good morning, traders. We have had a rather uneventful weekend which has been upsetting to many as the market has not provided direction. Tether Bitcoin pairs continue to print a premium over USD Bitcoin pairs. CME futures printed a gap at $5500 which will need to be filled, however this could come after price moves down first. Bitstamp has a 1H gap around $5400 as well. Price is not looking particularly strong at this time, however as price drops to $5100 the order books flash strong bids so we may be seeing retail selling into professional hands at that level. Currently, the daily candle has gapped down at $5161 so I expect that if we do drop it won't be long-lived. The recent weekly close printed a candle spread almost identical to the previous week's, just ending where that previous week began, and the weekly remains bullish at 55.5 at this time, though Stoch RSI is still overbought but finally falling.
We can see price has crossed above the EQ of the descending channel which is usually considered bullish. If price pushes through the channel's resistance then we should be expecting a target of $5800-$5900, depending on when it happens, based on the height of the channel. Price has remained on the topside of the TR as it continues to print higher lows overall. So the move up mentioned ultimately would result in a target between $5900 and $6000, based on the height of the TR. Of course this is all in addition to the older targets from larger patterns that we have previously discussed. In the near term, a close above $5206 should get the ball rolling on greater appreciation and would have price targeting the top of the ascending channel that it may current be printing, as well as have price exiting the descending channel and TR.
Everything else aside, the blue TR is the dominant pattern that traders should be watching. Secondary is the descending channel that price has been printing since the recent high. And third is the ascending channel within that descending channel. We have the monthly close tomorrow, so price may continue more sideways than anything else through that time. I have continued to mention that we are either at, or near, the top of this third wave and trying to trade this is often futile for most traders because they tend to hold for a big move and then get liquidated or scared off due to the noise before it happens. For most traders, this is not the time to be in a trade. It's best to wait for confirmation of this upward movement to be completed and then go long at the completion of the corrective wave 4.
My final thought is in regard to a short squeeze. There's a lot of talk about it due to the significant increase in shorts, their overbought level, and the strong shorts-to-long ratio, as well as the longs oversold level. Since short squeezes most often happen at support, we would need to consider the blue TR's EQ as support. But what else should have us considering that this may occur? We have printed three daily dojis after that strong drop. As a matter of fact, the daily chart, starting from the recent high, looks a lot like a checkmate pattern (can also see this on the 4H chart). The large candle's low at $4991.42 has not been reached since the initial drop last Thursday. Instead, price has been trapped in a narrow trading range of about $150 on top of the TR's EQ (i.e. support level). Confirmation of this pattern would be 1-2 strong bullish candles. The short squeeze wouldn't fully commence until around $5700, but the shorts that piled up just a few hundred dollars above the current price could be the fuel to get price to that level.
Every day, we have a choice to act positively or negatively, so if you get a chance, do something decent for someone today which could be as simple as sharing a nice word with them. You just might change their day, or even their life.
Remember, you can always click on the "share" button in the lower right hand of the screen, under the chart, and then click on "Make it mine" from the popup menu in order to get a live version of the chart that you can explore on your own.
