Gapfill

long - rso - bullflag gap fillnice continuation to close the gap safe buy stop in at $10 target $11.50 for +15%


DJIA LongGap still yet to be filled. In an uptrend on higher tfs. Price has broken the 200sma and retested, now clearly stalling. Good time to get in for the gap fill. Price can potentially reach 20775, we'll see how price reacts if it reaches target.


Tesla closing gaps.Price bounced off the gap created on Feb 23rd. instead closed the gap from March 16th. and is now making lower lows.
what about that?


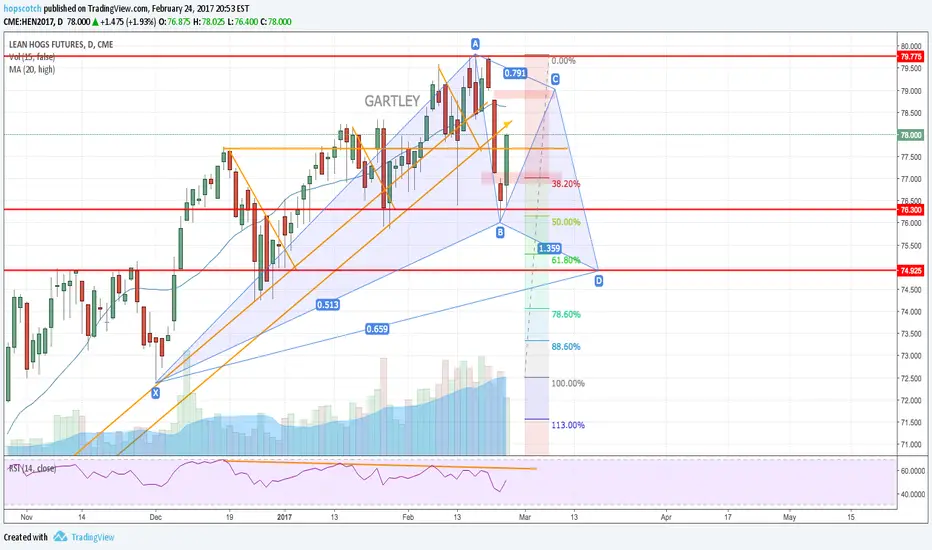
Hogs Going for Second gapThe market hates gaps and will always try to fill at some point. June Lean Hogs filled one gap and will probably attempt the next one Monday/Tuesday. Lean Hog index has stopped increasing, but remains around 77.73.
SBUX LONG TARGETSorry for not posting the original buy. This is my price target short term for SBUX.
The 24th is a dividend date and I will collect those as well.
This stock is small movement but profits none the less.

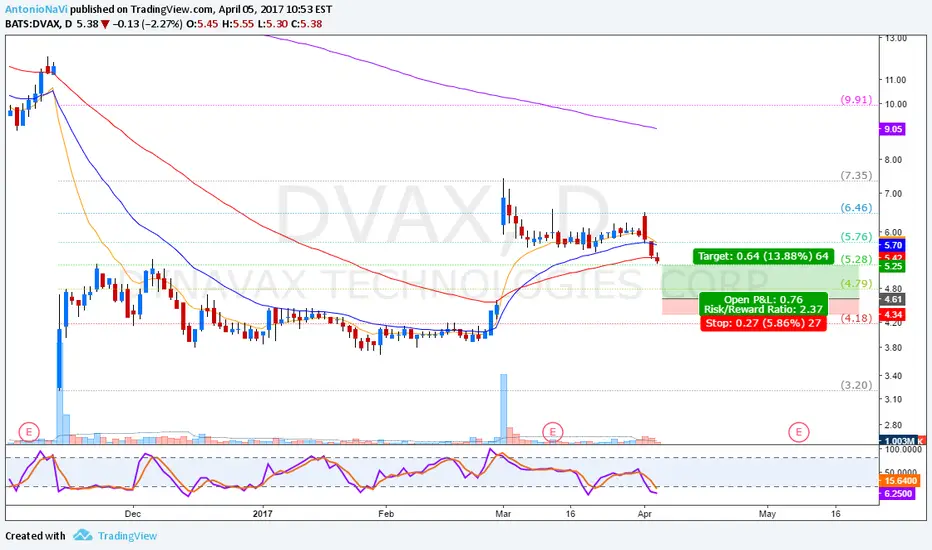
Filling the Gap?For the past month, price has been pushed down slowly staying near support for most of the time. Also, the 20ma has been acting as a dynamic resistance, and price has seen more resistance from a descending trend line.
Price has just broken and close below support (Double Blue Line)
Price has also closed below the 50ma, which has acted as dynamic support/resistance in the past.
There is also a head & shoulders pattern on the MACD Leader, and Insync Index
Price target is $87.88 for a R:R of 4.47
Went short with an entry of $99.06 after seeing a break of $99.20, Stop loss at $101.57

GBP/USD BUY (Gap Fill Trade) GBP/USD long idea.
MyFxBook www.myfxbook.com
Stops set at break even and ready to be patient. Assuming gap will fill.

FB Surging Up and Looking to Fill the GapFacebook (FB) gapped lower back on November 2 from $127.17 to $122.00 after a worse than expected earnings report. After hitting $114.77 last Friday, FB is hot out of the gates in 2017 and back into that Gap Area (see shaded rectangle above).
Facebook has been trying to break its downtrend and it finally looks poised to do so.
The RSI and MACD indicators are in good position for a bullish move as well, with both trending up and a recent bullish crossover in the MACD.
If Facebook can continue its momentum in 2017, we could be looking at prices of $124.60 (127.2% Fib Extension) and then a full fill of the Gap Area to $127.17.

$MWW gap fill?$MWW has some MAD volume today for a gap up out of descending broadening wedge. If it gets some legs, could fill gap to 4.10s. Very think above 3.50s. Could really move through that area.
Although, coming into resistance.

Example of why you sell when the GAP is filledOnce the GAP is filled stocks usually retrace before going high, or make a new trend lower.


Buy Target $600 at 50% Fib50% Fib level at 600 fills the gap and appears to be a potential short term bottom.
