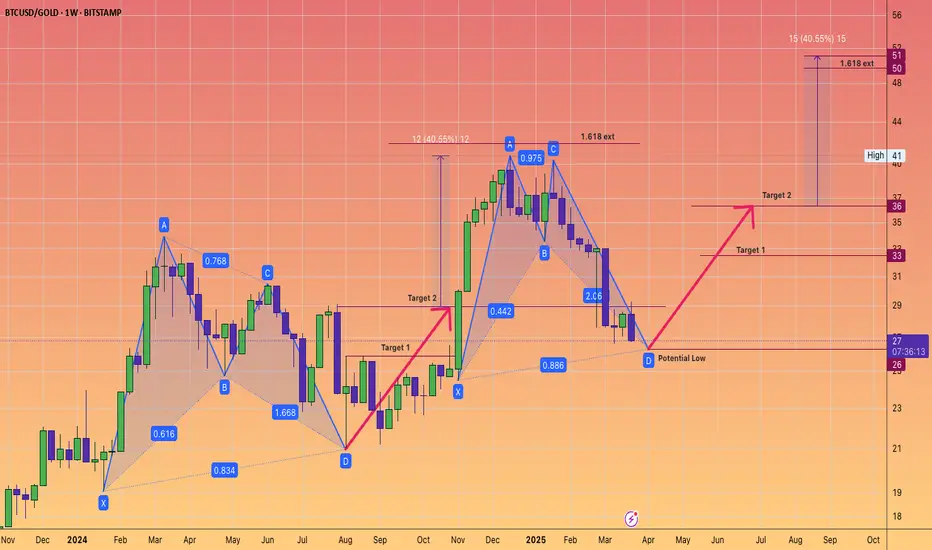
Bitcoin harmonic pattern. Back to back Gartley. BTCGOLD ratio.The BTC/GOLD ratio has experienced a significant correction, currently standing at 27 gold ounces per 1 Bitcoin, down from a peak of 41, representing a decline of 34%.
Gold, priced at $3,114 in US Federal Reserve notes, is in a sustained bull market.
It is reasonable to anticipate that the digital equivalent of gold will gain traction once gold stabilizes at a higher price point.
The Gartley pattern is recognized as the most prevalent harmonic chart pattern.
Harmonic patterns are based on the idea that Fibonacci sequences can be utilized to create geometric formations, which include price breakouts and retracements.
The Gartley pattern illustrated indicates an upward movement from point X to point A, followed by a price reversal at point A. According to Fibonacci ratios, the retracement from point X to point B is expected to be 61.8%.
At point B, the price reverses again towards point C, which should reflect a retracement of either 38.2% or 88.6% from point A.
From point C, the price then reverses to point D. At point D, the pattern is considered complete, generating buy signals with an upside target that aligns with points C and A, as well as a final price target of a 161.8% increase from point A.
Often, point 0 serves as a stop-loss level for the entire trade. While these Fibonacci levels do not have to be precise, greater proximity enhances the reliability of the pattern.
Will these consecutive Gartley patterns succeed in bolstering Bitcoin's strength? We will soon discover the answer.
Gartleybull
BILI Technical ConfluenceNASDAQ:BILI
Noting possible bullish spread across BILI:
Suggest stop loss at $17.5

Comprehensive Analysis of the Gartley Harmonic PatternThe Gartley Harmonic Pattern, a cornerstone of harmonic trading, was first introduced by H.M. Gartley in his 1935 book "Profits in the Stock Market." This pattern leverages Fibonacci retracement levels and geometric price formations to identify potential market reversals, providing traders with a strategic edge.
__________________________The Bullish Gartley Pattern___________________
Structure:
X-A Leg: The initial upward movement.
A-B Leg: A retracement of approximately 61.8% of the X-A leg.
B-C Leg: An upward move retracing between 38.2% and 88.6% of the A-B leg.
C-D Leg: The final downward movement, retracing 78.6% of the X-A leg, marking the pattern completion at point D.
Entry Criteria:
Entry Point: Enter a long (buy) position at point D, where the price is expected to reverse upward. This is typically the 78.6% Fibonacci retracement level of the X-A leg.
Stop-Loss:
Placement: Set a stop-loss order slightly below point X to safeguard against unexpected price movements. This minimizes potential losses if the pattern fails.
Take Profit:
First Target: Place the initial take profit target at point B, the retracement level of the A-B leg.
Second Target: Set the second target at point C, the retracement of the B-C leg.
Extended Targets: For a portion of the position, consider holding to capture further gains if the price continues to rise.
_________________________The Bearish Gartley Pattern_____________________
Structure:
X-A Leg: The initial downward movement.
A-B Leg: A retracement of approximately 61.8% of the X-A leg.
B-C Leg: A downward move retracing between 38.2% and 88.6% of the A-B leg.
C-D Leg: The final upward movement, retracing 78.6% of the X-A leg, completing the pattern at point D.
Entry Criteria:
Entry Point: Enter a short (sell) position at point D, where the price is anticipated to reverse downward. This corresponds to the 78.6% Fibonacci retracement level of the X-A leg.
Stop-Loss:
Placement: Set a stop-loss order slightly above point X to limit potential losses if the pattern does not play out as expected.
Take Profit:
First Target: Place the initial take profit target at point B.
Second Target: Set the second target at point C.
Extended Targets: Consider holding a portion of the position for additional gains if the price continues to decline.
_________________________Key Considerations__________________________
Precision: Accurate measurement of Fibonacci levels is critical. Even slight deviations can invalidate the pattern.
Confirmation: Utilize additional technical indicators or price action signals to confirm the pattern before initiating a trade. This can include moving averages, trend lines, or oscillators.
Risk Management: Adhere to strict risk management practices. This includes setting appropriate stop-loss levels and managing position sizes to protect capital.
____________________________Conclusion______________________________
The Gartley Harmonic Pattern is a sophisticated and reliable tool for identifying potential market reversals. By mastering the intricacies of both the bullish and bearish Gartley patterns, traders can enhance their analytical capabilities and improve trading outcomes. Integrating these patterns with other technical analysis methods and maintaining rigorous risk management protocols is essential for consistent trading success.
Incorporating the Gartley pattern into your trading strategy involves practice and diligence. Ensure that you continuously refine your skills in identifying these patterns and executing trades accordingly, always mindful of market conditions and broader economic factors.

USDJPY: Completed bull gartley; possible second chance entryUSDJPY has completed a bullish gartley on the 4hr/ 1hr chart. Possible double bottom on the 1 hr chart at previous structure for a second chance entry

XLMUSDTWe have a long signal on the daily indicator. These are short term goals. I expect 100% completion on the hartley. There will also be continued growth after these values

BATA INDIAHello and welcome to this analysis
Stock has made a bullish Harmonic Gartley and in this process has also made a double positive regular RSI divergence.
After such a sharp downfall stock has done a couple of candles in a consolidation zone and now could rally till 1600 with a smallish block near 1525, as long as it does not breach below 1380.
Good risk reward scenario at this juncture
Good luck with your investing

SPY Update (weekly) I have two scenarios, "At the Crossroads", to cite an old Robert Johnson song. The black ABCD pattern is negative, and assumes a trend back down to the center of the down channel created last year. The green ABCD assumes an uptrend continuation. Note that on the weekly, we have posted a hammer which rests above the Gann confluence line (positive). Both targets are a 1.27 extension, common for Gartley. RSI(12) on the weekly is 53.93, and has "Room to Move" (an old John Mayall song). Right now, I'm leaning toward the uptrend target, which stands at 425.58. The only word of caution is that we still sit below the cloud, which is considered resistance.

ZUARI AGRO CHEMICALSHello and welcome to this analysis
On daily time frame it is forming a Bullish Harmonic Gartley that has its potential reversal zone between 148-143.
Accumulate in that zone with 135 as stop loss for upside potential targets of 170/190 and ATH
Good risk reward set up from medium term prospective.

EURUSDHi traders, watch EURUSD with your own according strategy and look for a long position opportunity for a short term trade setup GOOD LUCK.

USDCAD H4Hi traders, USDCAD is setting up for a upside move i am expecting from price to come around our mentioned pattern completion area and looking price action for a long position opportunity, if price break 1.39753 level without hiting our mentioned pattern completion area then this setup will be invalidate.
Trade with your own strategy GOOD LUCK.

$FUND.X Unification entry PT .125-ish Next Target PTs 5-10 and hFUND Price Live Data
The live Unification price today is $0.227815 USD with a 24-hour trading volume of $311,241 USD. We update our FUND to USD price in real-time. Unification is down 30.18% in the last 24 hours. The current CoinMarketCap ranking is #815, with a live market cap of $7,847,637 USD. It has a circulating supply of 34,447,402 FUND coins and the max. supply is not available.
If you would like to know where to buy Unification at the current rate, the top cryptocurrency exchanges for trading in Unification stock are currently BitForex, ProBit Global, Poloniex, and Binance DEX. You can find others listed on our crypto exchanges page.
Unification (FUND) is a cryptocurrency . Unification has a current supply of 120,000,000 with 34,447,402 in circulation. The last known price of Unification is 0.22754702 USD and is down -30.26 over the last 24 hours. It is currently trading on 10 active market(s) with $311,221.84 traded over the last 24 hours.

Bullish Gartley m24 ETHlooks like we have a bullish gartley pattern set up here. I'm adding to my longs in this range.

LONG LUNA at the PCZ of a GARTLEYThis is as bottom as it gets, massive support at $0 hahahah and then a gartley appears?? COME ON!!! Buy of a lifetime lets gooooooo

Long Gartley Pattern GBPNZD 4HGartley pattern formed this week and got triggered in this afternoon
Previous level of resistance likely to act as support before GBP moves higher.
Entry at: 1.92124
Stop loss at: 1.90807
Target 1 at: 1.93080
Target 2 at: 1.93728
Targets will be moved to account for extension of D leg

Bullish Gartley on AUDCAD 4HI didn't have time to post this trade before I went to work, but it was spotted and triggered in around lunchtime.
Price had moved down into a level of previous structure support.
Aggressive buy limit order set at 0.91095
Stop loss set at: 0.90736
Take profit 1: 0.91459
Take profit 2: 0.91683
Targets will adjusted based on price movement beyond entry point.
If T1 is hit I will roll SL to break even for a risk free trade.

AUDUSD - MORE DOWNSIDE!! FX:AUDUSD is setting up for lower prices with a big break from the ABCD up to 0.7650.
The C-D leg will take us down to 0.6500-0.6600 area where the ABCD Gartley finishes with the 618 from the March 2020 lows. Also the major number of 0.6500.
6.5 being halfway between FIB numbers 5 & 8.
Looking for a pullback to sell into this one as well.
Enjoy the weekend. I hope this helps.

Band Harmonic Gartley (Bullish)Band Harmonic Gartley pattern
I have taken a position already on this coin, although market looks like it could shake at any moment if band can hold the line there is possibility to hit targets.
Entry zone clear on chart with Stop zones and targets marked out.

$COIN bullish gartleyI used to do a lot of harmonic patterns analysis. Not so much now but I do notice one if it pops out clearly on the chart. And that’s when they work well, big massive pattern that fit the ratios closely.
In $COIN I see this Gartley having close to the gartley fib ratios. The D wave down is a bit steep but its around 0.786 of XA. We can watch for a trade long here if the market gains strength

GBP/SGD:BULLISH GARTLEY PATTERN TRIGGER | LONG SETUP Welcome back Traders, Investors, and Community!
Check the Links on BIO and If you LIKE this analysis, Please support our Idea by hitting the LIKE 👍 button
Traders, if you like this idea or have your own opinion about it, please write your own in the comment box . We will be glad for this.
Feel free to request any pair/instrument analysis or ask any questions in the comment section below.
Have a Good Day Trading !

BTC Bullish GartleyI believe that we are not in a bullish gartley pattern and will break out long at point D. This is not trading advice, trade at your own risk. Good luck to all.

Bitcoin Gartley + ABCD HormonicPotential Gartley + ABCD Hormonic on the Bitcoin chart.
No financial advice.

AMC Bullish Gartley PatternHere we are looking at Heiken Ashi candlesticks to get a better picture of the overall trend in AMC over the past couple months. The RSI and MACD both at neutral/oversold and look ready to reverse to the upside. Price tested lower bound of Bollinger Bands and bounced HARD back above it. A bullish Harami was created friday July 9th indicating a possible reversal of the short term downtrend. From the run up starting May 24th we can draw a bullish Gartley harmonic. If this harmonic pattern holds to be true the next Bullish PT would be 162% fib extension of the first run up and retracement which indicates a price of roughly 138 in the near to mid term future. Also worth noting, the highest strike call on AMC is currently 145.

NIFTY SPOT LEVELS . Buying zoneBULLISG GARTLEY PATTERN IN NIFTY 50 SPOT.
CAN BUY NIFTY FUTURE NEAR 15500 TO 15552.
STOPLOSS BELOW 14450 ( ON CLOSING BASIS)
