AVN AnalysisAVN is tricky one. In my humble opinion, and you may disagree with it, it is forming a bullish harmonic gartley pattern.
It may retrace to around Rs. 30 and then may go up to 150+.
This is as per my limited knowledge and understanding and is not a buy / sell call.
Gartley

MPRC - Announce your seriousness about raising pricesEGX:MPRC timeframe: 2 hours
Identified a bearish Gartley pattern with:
- Sell point: ~36.00
- Targets: T1 at 34.30, T2 at 33.00
- Stop loss/rebuy: 36.60
If prices close above 36.60, the next resistance at 37.33 (1.618 extension of XA) could serve as another sell point. All data is on the chart.
The MACD shows a negative signal, supporting the bearish outlook. Meanwhile, EGX30/EGX70 are hitting new highs, which might push prices higher.
Given the multiple scenarios, adhere to stop losses or rebuy points to protect profits and minimize losses.
Disclaimer: Not investment advice; consult your account manager before acting. Good luck.

SWDY - LOW RISK EGX:SWDY timeframe 1 hour
created bullish pattern
entry 74.40
stop loss : 73.90
T1: 75.80
T2: 77.00
T3: 78.30
Its not an advice for investing only my vision according to the data on chart
Please consult your account manager before investing
Thanks and good luck

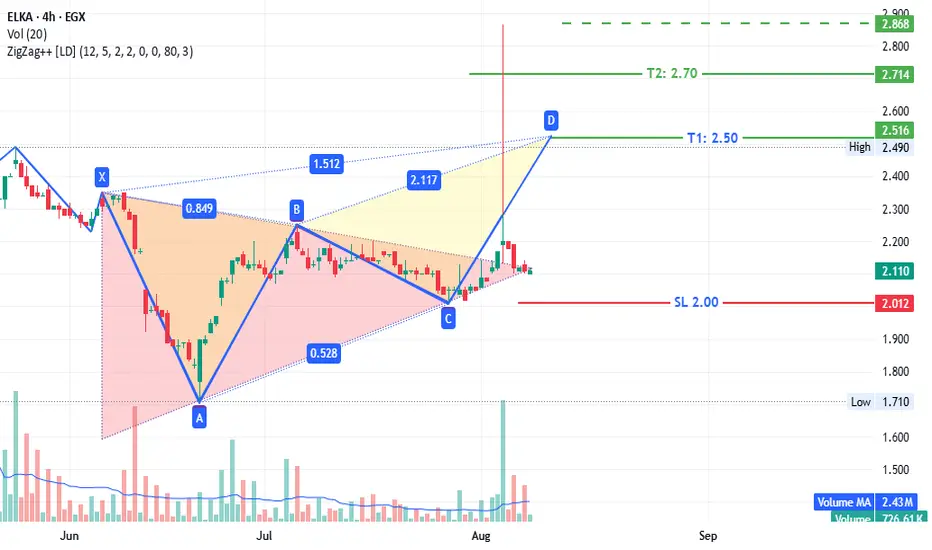
ELKA - Beware of the bull trapEGX:ELKA timeframe 4 hours
A completed triangle pattern supported by a potential bearish Gartley pattern targets :
T1: 2.50
T2: 2.70 up to 2.90 ( triangle pattern's target )
stop loss 2.00
This is not investment advice; consult your account manager before making decisions.
good luck
SPX500 - what's next?Further to my previous idea on SPX.
SPX respected the Resistance at FR 161.8 at 6400.
Price went down and reverted form SMA200 (4H)
Now price has completed the Perfect Gartley Pattern and reached point D.
If (against fundamentals) price reverts down from there and breaks down through SMA50 (4h), I will consider it as Bearish Validation and I will expect correction movement, which cen go down to ca 6000.
Just my humble opinion

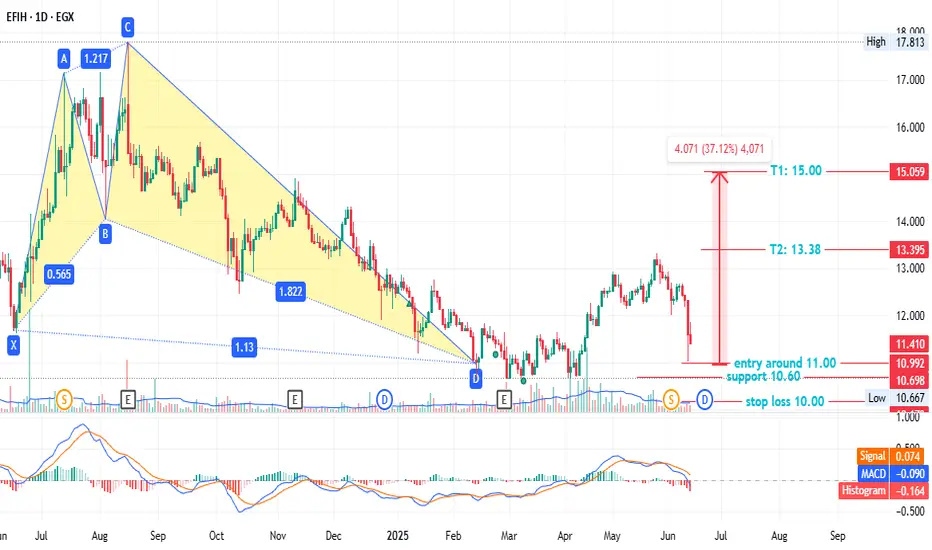
EFIH - anther chance - low risk EGX:EFIH - 1-Day Timeframe
A bullish pattern emerged on Feb 13, but prices adjusted after the 3/2 stock split on Jun 02. Key levels:
- Entry: ~11.00
- Stop loss: 10.00 (7.00% loss)
- Support: 10.60 (6-month low)
- Targets:
- T1: 13.38 (22.24% profit)
- T2: 15.00 (37.12% profit)
This is not investment advice—only my analysis based on chart data. Consult your account manager before investing. Good luck!
Natural Gas SpotFormed Gartley though break 0.786 ratio but allowed upto starting point , also forming ABCD pattern, appear ib wave B or X later will decide b or X which wave . Let see. I am not SEBI registered analyst, this is not buy , sell , hold recommendation. Only personal view for educational purpose. Thanz. if goes wrong no offence.

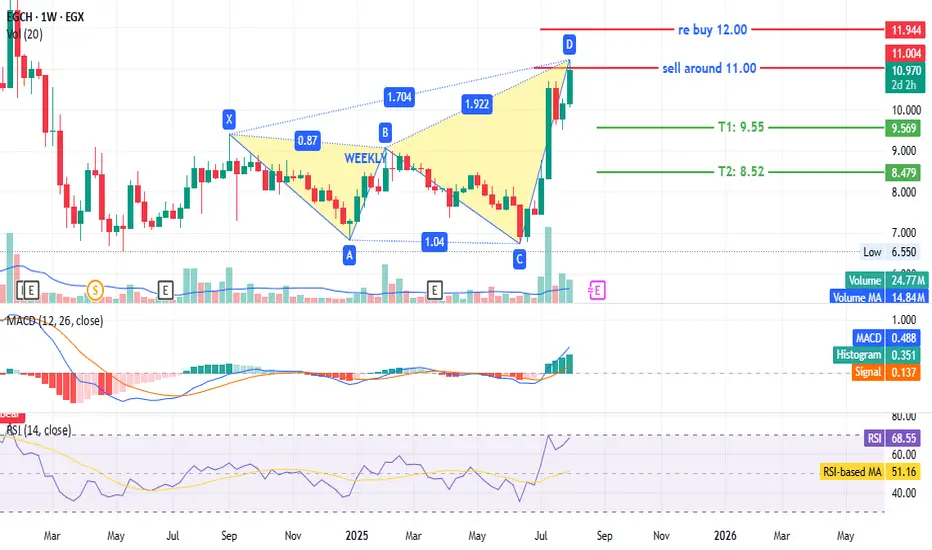
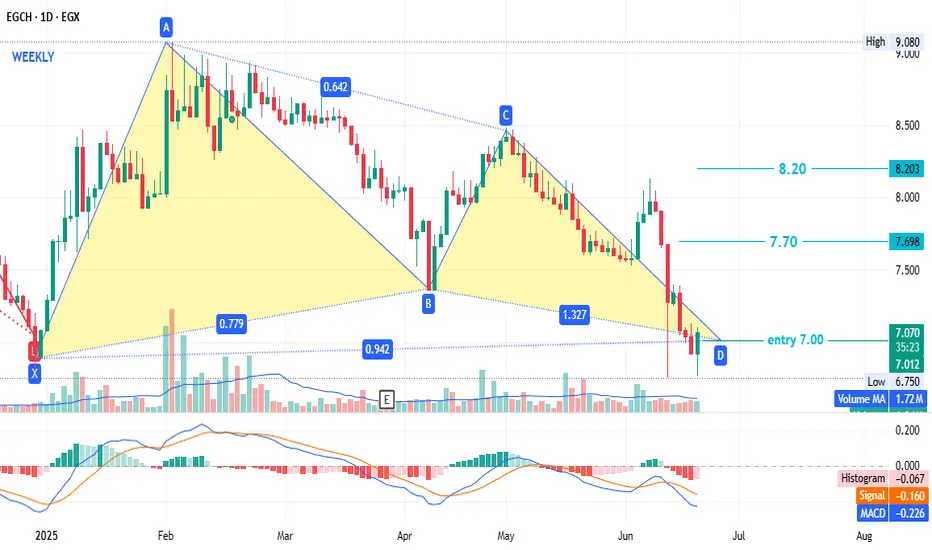
EGCH - great opportunity but be carful EGX:EGCH timeframe: 1 week
Identified a bearish Gartley pattern with:
- Sell point: 11.00
- Targets: T1 at 9.55, T2 at 8.52
- Stop loss/rebuy: 12.00
However, prices may still rise if the weekly RSI closes above 70. Currently, MACD and RSI show no negative signs, and EGX30/EGX70 are reaching new highs, suggesting potential upward movement.
Disclaimer: This is not investment advice; consult your account manager before making decisions. Good luck.
Update idea: Ad
XAUUSD eyes potential Gartley patternOn the daily chart, XAUUSD has retreated from its highs, and short-term bears have the upper hand. Currently, we can pay attention to the area below 3191, which is a potential buy level for a bullish Gartley pattern and is within the previous demand zone.

EURUSD - perfect Gartley Pattern?Technical Analysis - no fundamentals taken into account.
EURUSD proce has just completed a perfect Gartley Pattern. If respected, proce will come down to 1.23748 at least. Potentially lower.

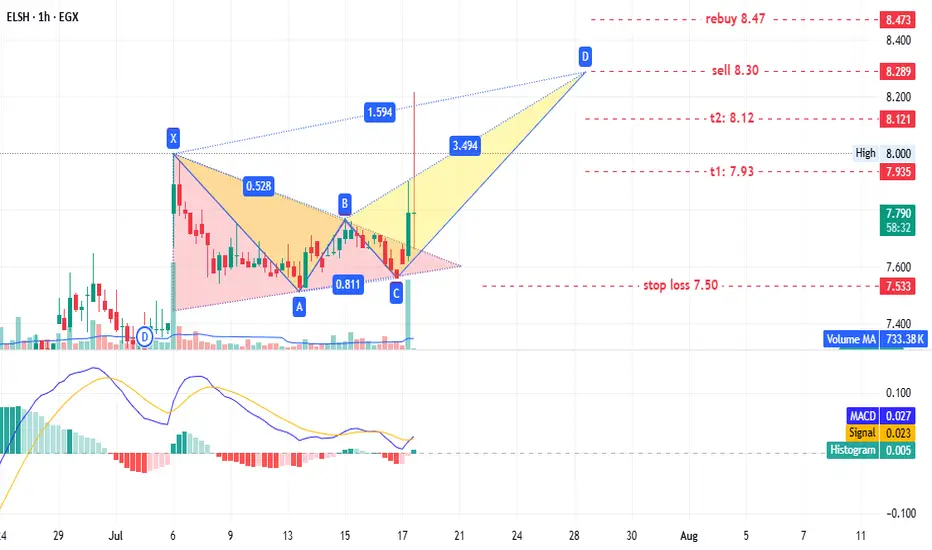
ELSH - old player EGX:ELSH timeframe: 1 hour.
A triangle pattern was identified, targeting 8.20. No new entry is recommended for shareholders, but if prices retest the triangle pattern at 7.65–7.60, it could present a low-risk entry opportunity.
This may also form a potential bearish Gartley pattern with targets:
- T1: 7.93
- T2: 8.12
- T3: 8.30 (sell point)
Stop loss: 7.50.
If prices continue rising and close above 8.47, consider rebuying what was sold at 8.30.
Disclaimer: This is not financial advice, only our analysis based on chart data. Consult your account manager before investing.
Good luck!
Pi Network Faces Scrutiny as Market Cap Hits $3.4BPi Network, the mobile-first crypto project that attracted millions of users with its "mine-on-your-phone" concept, is facing growing scrutiny as its market capitalization has surged to $3.4 billion, despite lingering concerns over its actual utility and use cases. As hype continues to propel its valuation, the community and broader crypto market are demanding answers: What can Pi really do?
Background and Growth
Launched in 2019 by a team of Stanford graduates, Pi Network aimed to democratize cryptocurrency mining by enabling users to earn tokens on their smartphones without expensive hardware. Through aggressive referral-based marketing and a user-friendly interface, it reportedly attracted over 50 million users globally.
However, after years in beta and a still-limited mainnet release, the Pi token is not yet fully tradable on major exchanges, and its price remains speculative. Despite that, Pi's market cap is estimated at $3.4 billion based on limited OTC (over-the-counter) trading and projected supply metrics.
Utility Concerns Intensify
With a large user base and growing token valuation, the pressure is on for Pi Network to deliver tangible value. Key concerns include:
Lack of utility – Most users cannot use Pi to pay for goods or services in real-world scenarios.
No open mainnet – While a “closed mainnet” has launched, the network still lacks full public blockchain access, hampering transparency and developer participation.
Centralization – Pi’s governance and decision-making remain opaque, raising questions about decentralization and long-term sustainability.
No listings on major exchanges – Without real-time market discovery, token valuation remains speculative and potentially misleading.
Community Reaction
Many early adopters continue to support Pi, viewing it as a long-term project that needs time to mature. Some local communities even organize Pi-based bartering systems. However, critics argue that without real-world use cases, Pi remains a glorified points system rather than a functional cryptocurrency.
The disconnect between market cap and utility has fueled concerns of a speculative bubble. In fact, some compare Pi to past projects like BitConnect, which promised much but delivered little.
The Road Ahead
To maintain its momentum and justify its valuation, Pi Network must:
Open its mainnet to public interaction and developer contributions.
Secure listings on reputable exchanges to enable transparent price discovery.
Establish real-world utility, such as integration with e-commerce, payments, or DeFi applications.
Improve transparency around tokenomics, governance, and long-term roadmap.
Failure to address these areas could result in an erosion of community trust and capital flight to more proven projects.
Conclusion
Pi Network’s $3.4 billion market cap is both impressive and problematic. It highlights the power of community-driven growth but also underscores the risks of hype-driven valuations. As the crypto market matures, utility—not just marketing—is what will determine long-term success. For Pi, the clock is ticking to move from potential to performance.

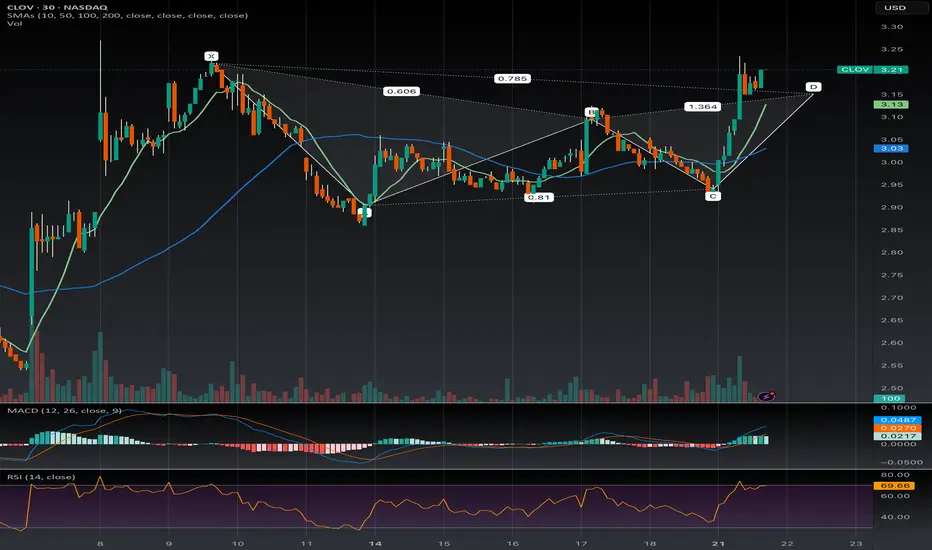
$CLOV Short Term Bearish Gartley NASDAQ:CLOV is forming a Bearish Gartley pattern with the D point projected at $3.10, nearing a potential reversal as of Monday, July 21, 2025. The RSI at 68.46 is close to overbought territory, adding support to the possibility of a bearish move if confirmed below $3.10. Keep an eye on a break below $3.10 with increased volume.
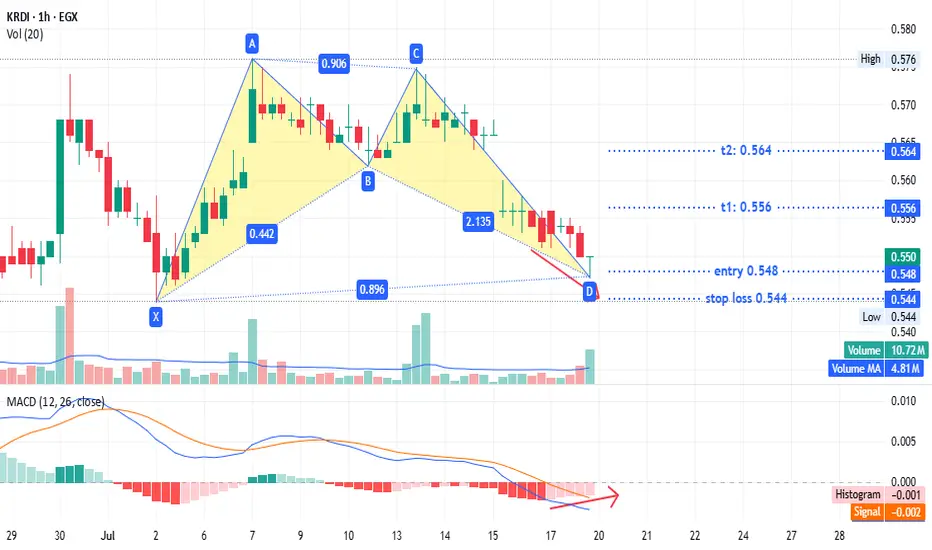
KRDI - just for fun but secured TASE:KRDI timeframe 1 hour
created bullish pattern
entry 0.548
stop loss : 0.544
T1: 0.556
T2: 0.564
MACD show positive diversion may that support our idea
Its not an advice for investing only my vision according to the data on chart
Please consult your account manager before investing
Thanks and good luck
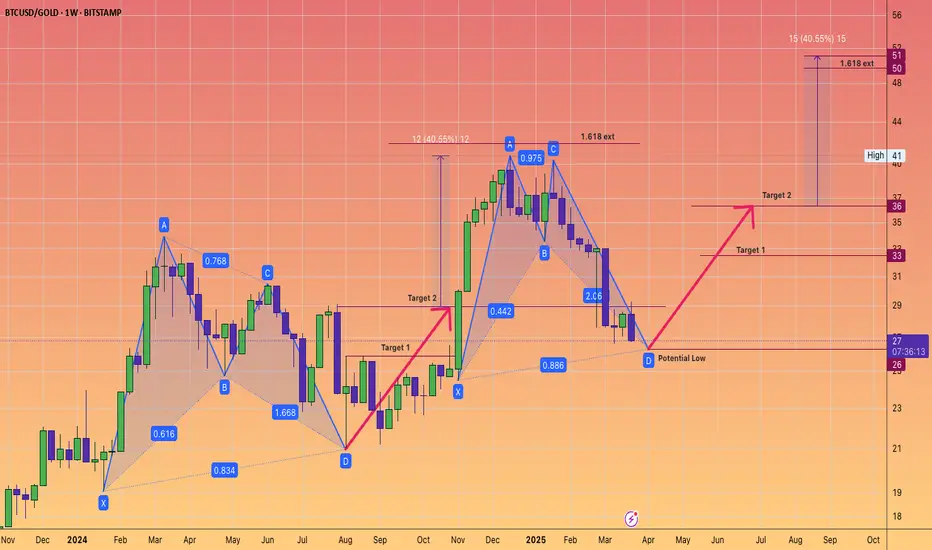
Bitcoin harmonic pattern. Back to back Gartley. BTCGOLD ratio.The BTC/GOLD ratio has experienced a significant correction, currently standing at 27 gold ounces per 1 Bitcoin, down from a peak of 41, representing a decline of 34%.
Gold, priced at $3,114 in US Federal Reserve notes, is in a sustained bull market.
It is reasonable to anticipate that the digital equivalent of gold will gain traction once gold stabilizes at a higher price point.
The Gartley pattern is recognized as the most prevalent harmonic chart pattern.
Harmonic patterns are based on the idea that Fibonacci sequences can be utilized to create geometric formations, which include price breakouts and retracements.
The Gartley pattern illustrated indicates an upward movement from point X to point A, followed by a price reversal at point A. According to Fibonacci ratios, the retracement from point X to point B is expected to be 61.8%.
At point B, the price reverses again towards point C, which should reflect a retracement of either 38.2% or 88.6% from point A.
From point C, the price then reverses to point D. At point D, the pattern is considered complete, generating buy signals with an upside target that aligns with points C and A, as well as a final price target of a 161.8% increase from point A.
Often, point 0 serves as a stop-loss level for the entire trade. While these Fibonacci levels do not have to be precise, greater proximity enhances the reliability of the pattern.
Will these consecutive Gartley patterns succeed in bolstering Bitcoin's strength? We will soon discover the answer.
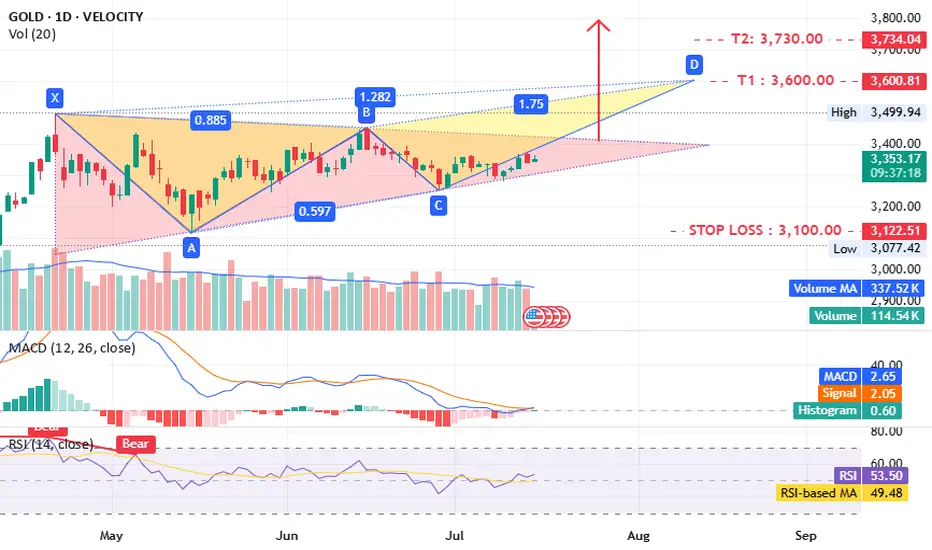
Gold what is next ?!!TVC:GOLD timeframe 1 day
is forming a potential triangle pattern, which could lead to a bearish setup.
The MACD and RSI indicators are positive, supporting this outlook. A close above 3400 would further confirm the idea.
Targets:
- T1: 3600
- T2: 3730–3800
Stop loss: 3100
Support: 3300–3260
Consider opening a long position now, with confirmation above 3400.
Disclaimer: This is not investment advice, only an analysis based on chart data. Consult your account manager before making any decisions. Good luck.
ETH POTENTIAL BULLISH GARTLEY Seeing a potential bullish gartley forming on ETH if it is unable to break above the .886 of the AB wave. Targets would be $2004 to $1786 for the .786 or 1.618 of the BC leg

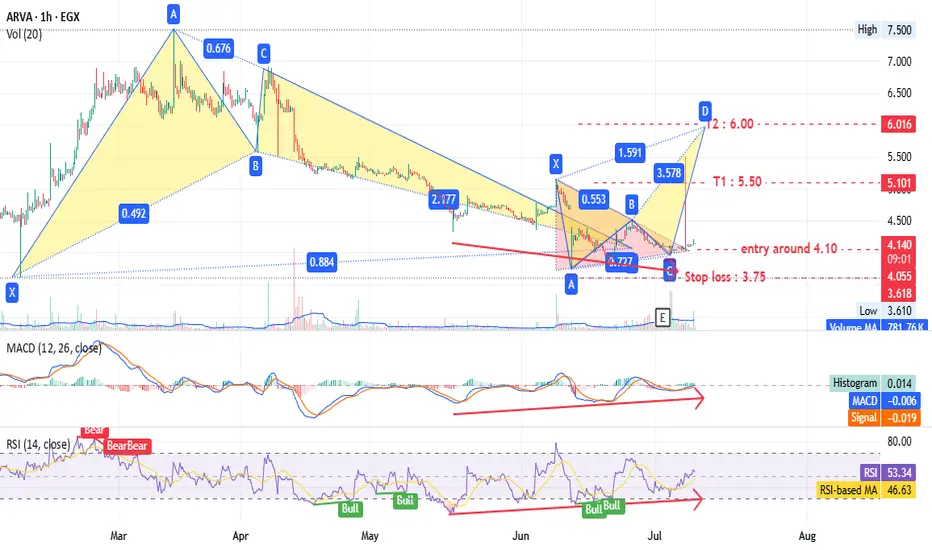
ARVA - many patterns give one target - Amazing EGX:ARVA timeframe 1 hour
Entry around 4.10
Stop loss at 3.75 (10% loss).
Targets at 5.50 and 6.00 (up to 44% profit).
Hourly chart shows a triangle pattern and bearish Gartley pattern.
Daily timeframe also indicates a bullish pattern with the same targets.
MACD and RSI support this analysis.
Note: This is not investment advice—only my analysis based on chart data. Consult your account manager before investing. Good luck!
TSLA BUY 253.8Recently, TSLA has maintained a volatile operation. Currently, we can pay attention to the area around 253.8 below, which is a potential buying position for a bullish Gartley pattern. At the same time, this position is within the previous demand area.

BTC — Weekend Pump Fades.. All Eyes on the Gartley Reversal ZoneBitcoin has been consolidating in a tight range between $110K and $105K over the past two weeks. This weekend’s attempted breakout stalled out quickly! BTC was rejected at the Point of Control (POC) of the previous range and came close to the 0.786 retracement of the recent drop.
🧠 Reminder: Weekend pumps are notorious for being unreliable, especially without strong volume.
Now, the charts point toward something much more structured — a potential Gartley harmonic pattern forming, with multiple levels of confluence suggesting the next key decision zone is just around the corner.
🧩 Gartley Completion Zone: $106,290–$106,400
This price zone is loaded with confluence:
✅ 0.786 Fib retracement of the XA leg sits at $106,290
✅ 1.0 trend-based Fib extension of the BC leg is at $106,370
✅ Anchored VWAP from all-time high aligns precisely at $106,370
✅ VAL (Value Area Low) sits at the same level
✅ Imbalance (Fair Value Gap) from earlier price inefficiency lies in this exact region
All of this stacks up into a high-probability reaction zone.
🎓 Educational Insight: How to Trade a Gartley Harmonic
The Gartley pattern is one of the most powerful harmonic setups — a structured form of retracement and extension that captures exhaustion before reversals. Here's how it works:
🔹 XA: Impulse leg
🔹 AB: Retracement of 61.8% of XA
🔹 BC: Retraces 38.2%–88.6% of AB
🔹 CD: Extends to 78.6% retracement of XA and aligns with a 1.0–1.272 Fib extension of BC
🟢 Point D is the entry zone — your reversal opportunity.
📉 Stop-loss sits just below invalidation (Point X).
💰 Targets usually lie at 0.382 and 0.618 of the CD leg.
🔎 Why It Works: It traps late traders and captures price exhaustion at natural Fibonacci ratios. Combined with other tools — like VWAP, liquidity zones, and order flow — it becomes a high-conviction strategy. These patterns are most effective on higher timeframes like 4H or daily.
_________________________________
💬 If you found this helpful, drop a like and comment!
Want breakdowns of other charts? Leave your requests below.

EGCH - old enemy - low riskConsider a long position with the following parameters:
Entry: 7.00
Stop loss: 6.80
Targets: 7.70 (T1), 8.20 (T2)
This is not investment advice but my analysis based on chart data. Consult your account manager before investing. Good luck.
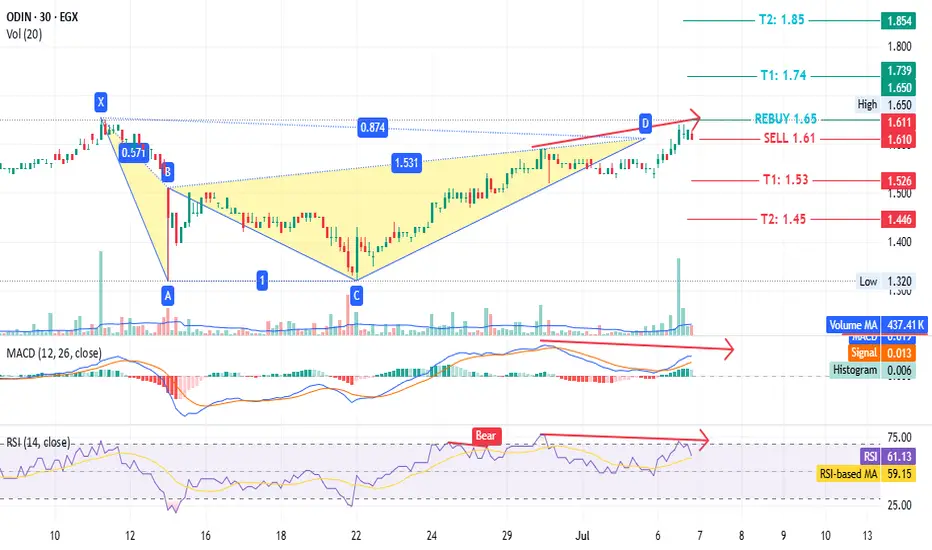
ODIN - confused but easy NGM:ODIN timeframe: 1 hour
Identified a bearish Gartley pattern with:
- Sell point: 1.61
- Targets: T1 at 1.53, T2 at 1.45
- Stop loss/rebuy: 1.65
If rebuy is triggered:
- New targets: T1 at 1.74, T2 at 1.85
- Stop loss: 1.61
MACD and RSI indicators do not support the recent price rise, aligning with the bearish pattern.
Disclaimer: This is not investment advice, only an analysis based on chart data. Consult your account manager before making any decisions. Good luck.
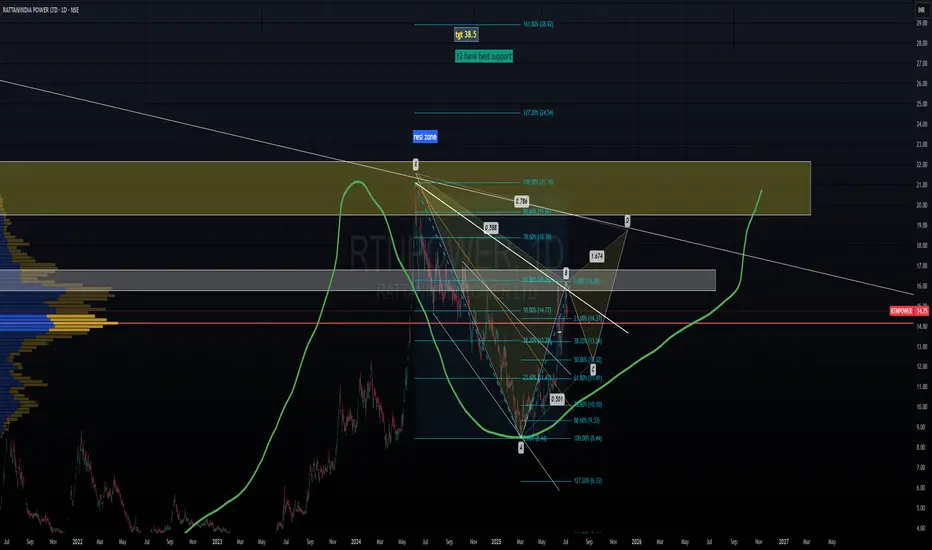
rtn power looks bull after some bearishnessrtn power may makes harminc pattern, if possible it, it will reach pont d target, means 12.5 to 18 around.