XCUUSD - Bearish Gartley Pattern- if Gartley Pattern on EURUSD works, USD will be getting stronger over the next weeks
- HGN25 is ca 30% above the 5 year average for Jul contracts
- If tariffs don't come to effect - what I think will take place - the reduction in proce is possible
- then perhaps the Gartley Patter may work. Hopefully
Traders - have a good week!
Gartley

$MPRC - Beware of the bears trap** EGX:MPRC - 1-Day Timeframe**
A highly complete bearish Gartley pattern is forming.
- **Sell Point:** Around 26.50
- **Stop Loss/Reentry:** 28.17 (estimated loss: -7.00%). A close above 28.17 would signal continued upward momentum.
- **First Target:** 23.70 (estimated profit: 10.40%)
- **Second Target:** 22.00 (estimated profit: up to 16.87%)
**Notes:**
- The RSI shows weakness but remains above 70, indicating strength. A close below 70 would signal a halt to the upward trend. Until then, the stock remains positive for the long term.
- This analysis is based on the 1-day timeframe.
**Disclaimer:** This is not investment advice—only my interpretation of the chart data. Consult your account manager before making any decisions. Good luck!

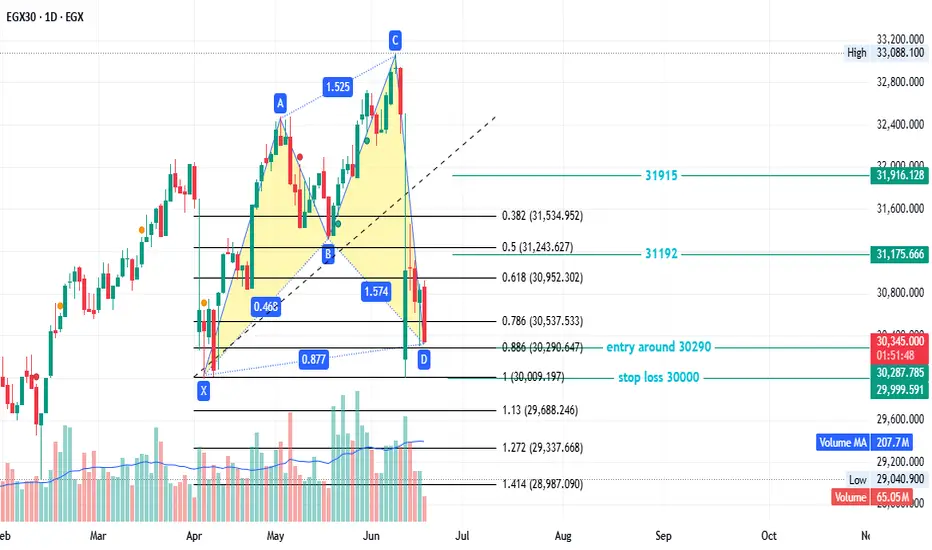
EGX30 - good newsEGX30 created a bullish pattern
entry around 30290
stop loss 30000
first target 31192
secund target 31915
This is not investment advice—only my analysis based on chart data. Consult your account manager before investing. Good luck!
BellRing Brands (BRBR) Weekly Gartley@ Key Levels + Kijun SignalIn March 2025, I previously took a look at this budding public company BellRing Brands, Inc. for a long-term investment horizon. It was priced around 74 at the time, then the fall of the overall market status put additional pressure on its stock, although the company itself is booming and meets my fundamental parameters. See the following:
Since then, we had an awesome and confident forward guidance from the company in the last earnings call in May 2025: bellring.com
Now, looking at BellRing Brands (BRBR) once again, on a weekly chart, key technical patterns have formed that look very promising and solid with its many confluences.
TECHNICALS:
WEEKLY:
Many weekly confluences have appeared from a technical perspective. Here is what I see:
(1) There is a clear Bullish Gartley-ish pattern in a weekly retracement to 50% followed by a retracement to 78.6% of a preceding move.
(2) The price is around 78% fib support.
(3) Horizontal area of support: The 50 - 58 area is a whole prior area of horizontal support that was a prior resistance area back in July 2024, and the price has landed back on that area. You know what we say as technicians and investors: past resistance = future support.
(4) MACD Hidden Bullish Divergence (weekly)
(5) The price tested the weekly cloud and broke through; however, bullish extremes were triggered when that happen, which is rare based on all my personal studies. In fact, the current level 55-58 marks the end of a bearish double top cycle that began around March 2025.
(6) A weekly Doji with volume support (classified as a "dVa" in my old notes of Volume Price Analysis).
Here is the weekly chart:
MONTHY:
BRBR is poised to rally Q3 and Q4 2025.
We have a potential monthly bounce of the kijun forthcoming along with good fundamentals going forward supporting the growth of the company in the long term.
** potential monthly Kijun Trend Bounce **
Here is the monthly chart:
Target:
Currently, the price is 58.54. My tentative target is around 140 by March 2026.
Thus, with all the fundamental support, good forward-looking guidance, and the technical I believe that BellRing Brands (BRBR) is at a great price right now. It is prime to continue its stretch of growth for 2025. Looking forward with investor foresight, the case for BellRing Brands and its stock (BRBR) is not only a high-probability outlook of positivity, but a high odds outcome of technical price pattern success. What a great discount.... :)

USD/JPY Bearish Gartley Pattern Completion - SELL SETUP
📊 Trade Overview
Pair: USD/JPY
Pattern: Bearish Gartley
Timeframe: 15 minutes
Direction: SHORT
Setup Type: Harmonic Pattern Completion + FVG Confluence
🎯 Market Analysis
The price is evidently bearish according to market structure, currently in a retracement phase, and I expect a bearish continuation at the 61.8 Fibonacci level of the wave.
The harmonic pattern establishes an 88.6 Fibonacci ratio for bearish entry with a balanced and low-risk R/R of 1:1.82 (profit - risk).

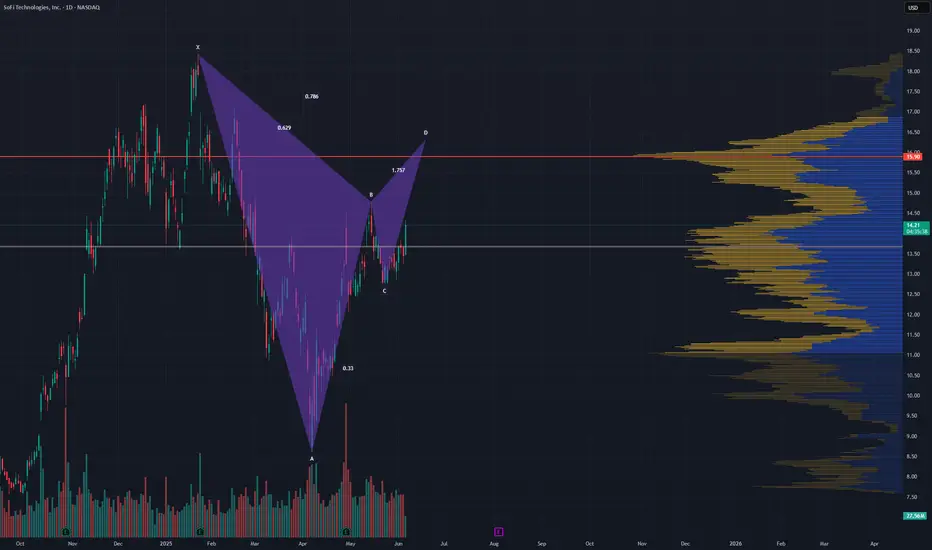
$SOFI looks like its forming a bearish Gartley Noticed this potential #Gartley #Harmonic on #SOFI the other day. I hope my 14c calls do get blessed with its completion.
I expect a retrace to 13.30 then 11.55 of the completion.
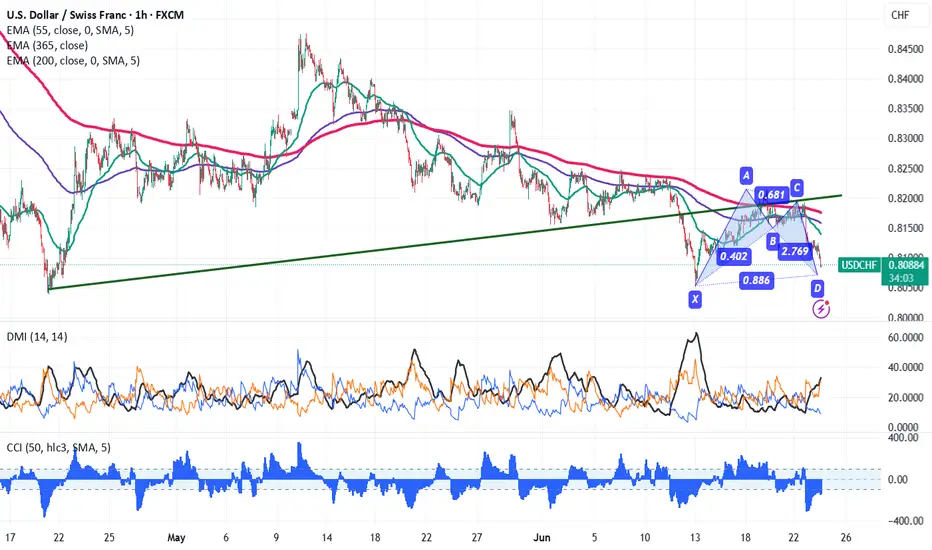
USDCHF Forms Bullish Gartley, Targets Upside Despite Bearish BiaChart pattern- Bullish Gartley pattern
Potential Reversal Zone (PRZ)- 0.8070
USDCHF pare most of its gains improving risk mood. It hits an intraday low of 0.80877 and is currently trading around 0.80866. Intraday bias appears to be bearish as long as the resistance 0.8140 holds.
Technical Analysis Points to Further Upside
The pair is trading below the 55-EMA, 200 EMA and 365 EMA on the 4-hour chart indicates a bearish trend. The immediate resistance is at 0.8140 any break above targets 0.8180/0.8250/0.8300.
Support Levels and Potential Declines
On the downside, near-term support is around 0.8080, any violation below will drag the pair to 0.8000/0.7920.
Indicators (1-Hour)
CCI (50) - Bearish
Directional movement Index - Bearish
Trading Strategy Recommendation
It is good to buy on dips around 0.8070 with a stop-loss at 0.8040 for a TP of 0.8185..
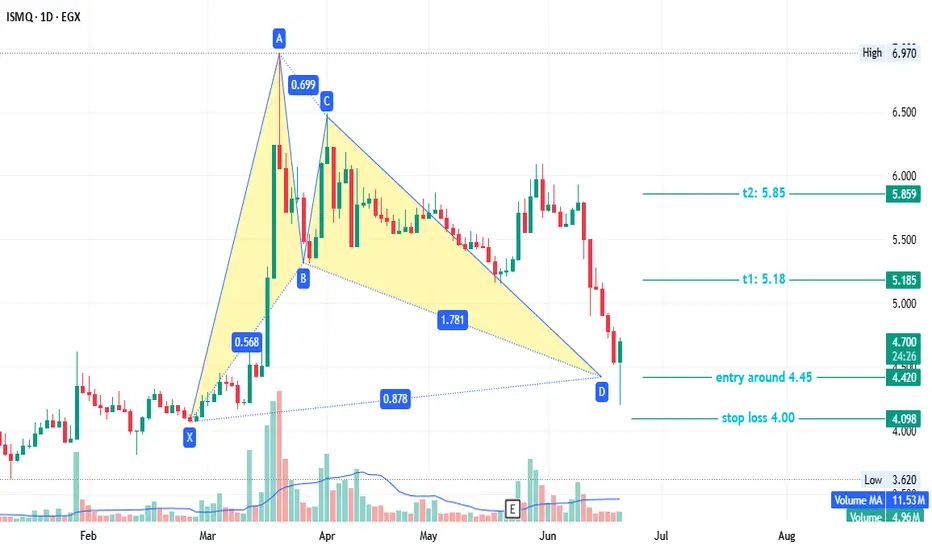
ISMQ - interested EGX:ISMQ timeframe 1 day
Created Bullish Gartley pattern, so we can see action price in this point .
Entry level around 4.45
Stop loss 4.00
First target at 5.18
Second target 5.85
NOTE : this data according to timeframe 1 day.
Its not an advice for investing only my vision according to the data on chart
Please consult your account manager before investing
Thanks and good luck

ICDI - save your profits and capital#ICDI timeframe 4 hours and also 2 hours
Created a bearish Gartley pattern
Sell point around 3.72 ( prices now is 3.74 )
Stop loss / reentry 3.80 (estimated loss -2.00%)
First target at 3.53 (estimated profit 4.87%)
Second target 3.80 (estimated profit up to 9.24%)
Third target 3.20 (estimated profit up to 13.90%)
NOTE: this data according to timeframe 4 hours and also 2 hours.
It's not an advice for investing, only my vision according to the data on chart.
Please consult your account manager before investing.
Thanks and good luck.

ADRI - Egyptian stock market - good for medium term investing #ADRI timeframe 1 DAY
Created Gartley Bullish pattern.
Entry level at 1.08 ( price now 1.07)
Stop loss 1.02 ( loss may go to up -5.50% ) - support 1.05
First target at 1.24 ( with profit around 14.49% ) resistance 1.15
Second target 1.37 ( with profit around 26.60% ) resistance 1.28
Third target 1.52 ( with profit around 40.84% ) resistance 1.45
NOTE : this data according to time frame I DAY , so its may take time up to 3 months .
Its not an advice for investing only my vision according to the data on chart
Please consult your account manager before investing
Thanks and good luck

#EAST - great fundamental - positive long term #EAST timeframe 1 hour
Created Bullish Gartley pattern, so we can see action price in this point .
Entry level around 30.20
Stop loss 29.70
First target at 31.65
Second target 32.50
Third target 33.20
NOTE : this data according to timeframe 1 hour.
Also MACD show positive diversion that may support our idea.
Its not an advice for investing only my vision according to the data on chart
Please consult your account manager before investing
Thanks and good luck

LUTS - out of box ( T1 10% VS SL 2% )EGX:LUTS timeframe 1 day
Created Bullish Gartley pattern, so we may see action price in this point.
Entry level around 0.573 ( prices now at 0.557 )
Stop loss 0.54 ( estimated loss 5.55% )
First target at 0.629 ( estimated profit 10.00% )
Second target 0.702 ( estimated profit 22.50% )
Third target 0.754 ( estimated profit 31.55% )
NOTE : this data according to timeframe 1 day.
Also MACD show positive diversion that may support our idea.
Its not an advice for investing only my vision according to the data on chart
Please consult your account manager before investing
Thanks and good luck

SELL GBPJPY (9 June Analysis)A simple straightforward setup for this coming week can be seen here on GBPJPY. The main structure is a double top. Price has been traveling within a channel forming the right top, I expect price to decline during Asia session this evening.

HYPE Precision Trading — Pattern, Patience, ProfitHYPE has shown strong performance since early April, maintaining a clear uptrend. Currently, the market is consolidating in a range between $30 and $40 and it’s setting up for something interesting. Let’s break it down and map the next high-probability trade setup.
Potential Gartley Harmonic Pattern Forming
A valid Gartley pattern may be developing, with point D potentially forming around the $29 level. This zone offers solid confluence for a high-probability long setup.
🟢 Long Setup – Gartley Harmonic Pattern Completion at around $29
Confluences around $29–$28.3:
0.786 Fib retracement of XA
Trend-based Fib Extension 1:1
Negative -0.618 Fib as take-profit level for prior short
Anchored VWAP (0.666 band multiplier) acting as dynamic support
200/233 EMA/SMA support on the 4H TF
FVG + liquidity pool resting just below $30
Setup Details:
Entry Zone: Trend-based Fib Extension 1:1 or laddered between $30–$28.3
Stop Loss: Below $27.5 (adjust depending on where point D forms)
Target: 0.618 of CD leg ≈ $34.4
R:R ≈ 1:3.5
🔴 Short Setup – look for rejection at $36
0.618 Fib retracement from previous move (ideal short entry)
Invalidation: Break above $38.2 (above point C)
Take Profit: $30-$29
R:R ≈ 1:3
🧠 Educational Insight:
Harmonic patterns offer precise entries and targets by aligning Fibonacci levels with market structure. When combined with tools like Anchored VWAP and liquidity analysis, they become powerful tools for swing trading.
Summary:
HYPE continues to respect structure beautifully, offering repeated swing setups in the 10%–20% range. With clear fib symmetry and predictable behaviour, it remains one of the more technically sound altcoins.
Stay patient. Wait for the pattern to complete. As always — don’t chase. Let the trade come to you.
_________________________________
If you found this helpful, leave a like and comment below! Got requests for the next technical analysis? Let me know.

HOUSECOIN Gartley to T1Ticker: HOUSECOIN
Entry: 0.03132
Stop Loss: 0.02119
Take Profit: 0.066
R/R Ratio: 3.43
Pattern: Gartley
DOT: 1 on daily Timeframe
HSI: 92
AmpRSI: 54

ECAP - Egyptian stock#ECAP timeframe 1 DAY
created 2 Bullish pattern ( Gartley and AB=CD ) , so we can see action price in this point .
Entry level at 22.70 ( price now 22.40 )
Stop loss 22.00( loss may go to up -3% )
First target at 24.45( with profit around 7.60% )
Second target 25.97( with profit around 14.70% )
NOTE : this data according to time frame I DAY ,
Its not an advice for investing only my vision according to the data on chart
Please consult your account manager before investing
Thanks and good luck

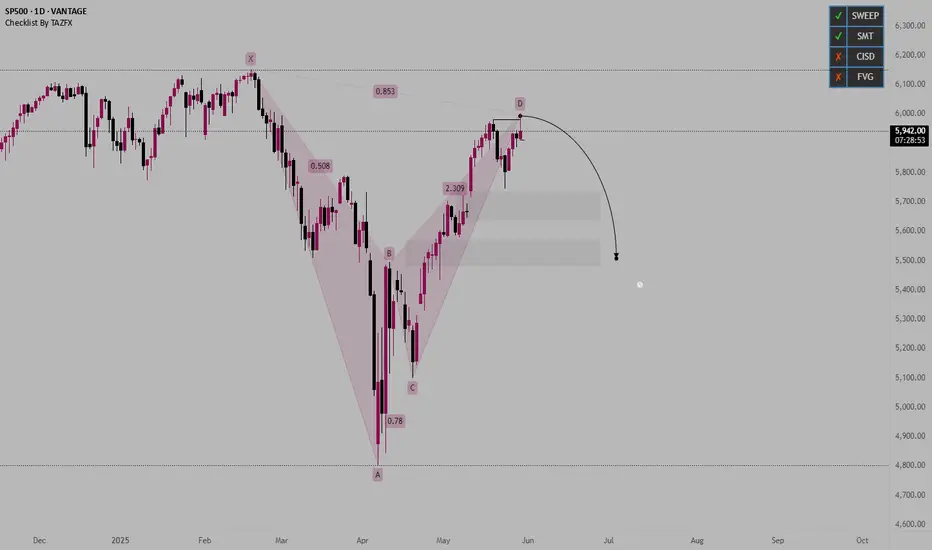
US500 - BEARISH HARMONICFollowing are the marked targets as am expecting price to move to downside to atleast fill the gap area
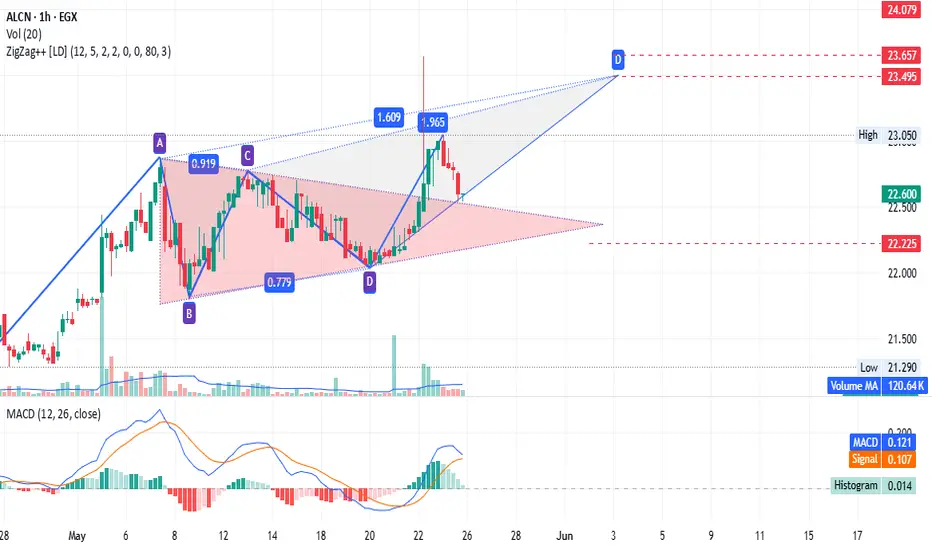
#ALCN - not an advise it just an ideaaccording to chart we have triangle pattern and potential bearish pattern,
Now is testing the uber line of triangle pattern
so stop loss now is 22.22
target and next sell point is 23.50 to 23.65
rebuy at 23.89
It's not advice for investing, only my vision according to the data on the chart.
Please consult your account manager before investing.
Thanks and good luck.
#ABUK - very confusing / where is the bottom ??!!!!3 levels prices may respect it :
first : 49.18
secund : 43.64 ( may be )
third : 38.69 ( really, no one bigger than market )
i am waiting for any positive sign at any level, now MACD is negative on daily basis .
any way consider stop loss to save your capital
good luck

#ATQA Egyptian stock - great opportunity - great fundamental.#ATQA timeframe 30 minutes
created 2 strong Bullish Gartley pattern, so we can see action price in this point .
Entry level around 8.85 .
Stop loss 8.65 ( estimated loss -1.85% )
First target at 9.35 ( estimated profit 6.33% ) - resistance 9.15 .
Second target 9.69 ( estimated profit 10% )
NOTE : this data according to timeframe 30 minutes .
Its not an advice for investing only my vision according to the data on chart
Please consult your account manager before investing
Thanks and good luck

VIRTUAL TA Masterclass — Elliott Wave Meets Gartley HarmonicVIRTUAL has been on fire! Printing a clean 5-wave Elliott impulse with a +431% run in just 33 days. But after every strong trend comes a healthy correction, and that’s where we likely are now. Trading below key resistance and showing signs of exhaustion. The question: Where is the next high probability trade setup?
Let’s break down what the chart is telling us.
🧠 Structure Overview
Wave 5 peaked at $2.2169
Wave A dropped -25%
Wave B bounced +30%
Currently: VIRTUAL's trading under the $2 psychological level and weekly open ($2.0358) → signs of momentum cooling
A corrective Wave C is likely underway, and all signs point toward a very specific zone.
⚠️ Liquidity Dynamics
The longer VIRTUAL grinds sideways near $2.00 without showing real momentum, the more vulnerable late long positions become:
Retail traders are buying resistance
SLs are likely clustered just below Wave A’s low
This creates a liquidity pocket waiting to be swept — perfect fuel for Wave C
🔍 The $1.58–$1.47 Support Cluster: 14 Layers of Confluence
This zone isn’t guesswork — it’s loaded with technical overlap:
1️⃣ 1:1 Trend-Based Fib Extension of Wave A → $1.573
2️⃣ Monthly Open → $1.5354
3️⃣ 0.382 Fib Retracement of the entire rally → $1.5295
4️⃣ Bullish Fair Value Gap → $1.57–$1.53
5️⃣ Anchored VWAP from ATH → ~$1.46
6️⃣ Anchored VWAP from Wave 3 → ~$1.46
7️⃣ 0.618 Fib Speed Fan Support (~end of May timing)
8️⃣ 4H 233 SMA → ~$1.52
9️⃣ 4H 200 EMA → ~$1.52
🔟 Daily 200 SMA → $1.5251
1️⃣1️⃣ Weekly 21 SMA → $1.462 (reinforces the VWAP zone)
1️⃣2️⃣ Declining Daily Volume → momentum weakening
1️⃣3️⃣ Liquidity Pool below Wave A → likely to be swept
1️⃣4️⃣ $2 = Golden Pocket Resistance + Psychological Barrier
🔴 Short Trade Setup (Active as Long as SFP Holds)
For those favouring downside continuation toward the Wave C target, a short setup is in play:
Entry: Weekly open retest around $2.0358
Stop-loss: Above SFP high at $2.143
Target: 1:1 Trend-Based Fib Extension of Wave A → $1.573 or the Swing Low of Wave A at $1.647
R:R ≈ 1:4 — a solid, well-structured short opportunity
As long as price remains below the SFP and the $2.00 golden pocket resistance, bears maintain control.
🟢 Long Trade Setup
Entry: Ladder between $1.58–$1.47
Avg. Entry: ~$1.53
SL: Below $1.40
TP1: $1.88 (local resistance) → R:R ≈ 1:2.5
TP2: $3.33 (0.618 Fib of entire bear market) → R:R ≈ 1:12
👉 Bonus TP for Harmonic Setup: 0.618 Fib of CD leg
✨ Bonus Confluence: Potential bullish Gartley Harmonic in Play
VIRTUAL is also forming a valid Gartley harmonic pattern — one of the most reliable reversal setups in classical trading theory.
🔸 XA: B retraced to 0.602 → ✅ (criterion: ~0.618)
🔸 AB: C retraced 0.87 → ✅ (valid range: 0.382–0.886)
🔸 CD: Projected to complete at 0.786 of XA → ~$1.474
• CD is a 1.356 expansion of BC
• AB ≈ CD symmetry is valid
• TP = 0.618 retracement of CD leg
This adds even more weight to the $1.47–$1.53 buy zone.
📘 Educational Takeaway
The best setups don’t rely on one method — they align multiple disciplines. Here, we have Elliott Waves, Fibonacci retracements, anchored VWAPs, volume structure, moving averages, time symmetry, and now a harmonic pattern — all pointing to the same opportunity. Most traders never wait for alignment. That’s why most lose.
💬 Final Words
✍️ Smart trading isn’t about always being in a trade — it’s about being in the right one at the right time.
While others FOMO at $2, you wait for the right opportunity to come to you — where structure, liquidity, and probability all shake hands.
The patient are rewarded. Always.
___________________________________
If you found this helpful, leave a like and comment below! Got requests for the next technical analysis? Let me know.

#OFH - one more time#OFH timeframe 30 minutes
created 2 strong Bullish Gartley pattern, so we can see action price in this point .
Entry level around 0.47.
Stop loss 0.465 ( estimated loss -1.00% )
First target at 0.49 ( estimated profit 4.00% )
Second target 0.50 ( estimated profit 6.40% )
Third target 0.51 ( estimated profit 8.15% )
NOTE : this data according to timeframe 30 minutes .
Its not an advice for investing only my vision according to the data on chart
Please consult your account manager before investing
Thanks and good luck
